
[vc_row][vc_column][vc_separator border_width=”5″][/vc_column][/vc_row]
[vc_row][vc_column][vc_column_text]
Good evening everyone.
[/vc_column_text][/vc_column][/vc_row]
[_s2If current_user_can(access_s2member_ccap_eurusd)]
[vc_row][vc_column][vc_separator border_width=”5″][/vc_column][/vc_row]
[vc_row][vc_column][vc_column_text]
EURUSD
[/vc_column_text][/vc_column][/vc_row]
[vc_row][vc_column][vc_separator border_width=”5″][/vc_column][/vc_row][vc_row][vc_column width=”2/3″][vc_custom_heading text=”1 hr” use_theme_fonts=”yes”][vc_column_text]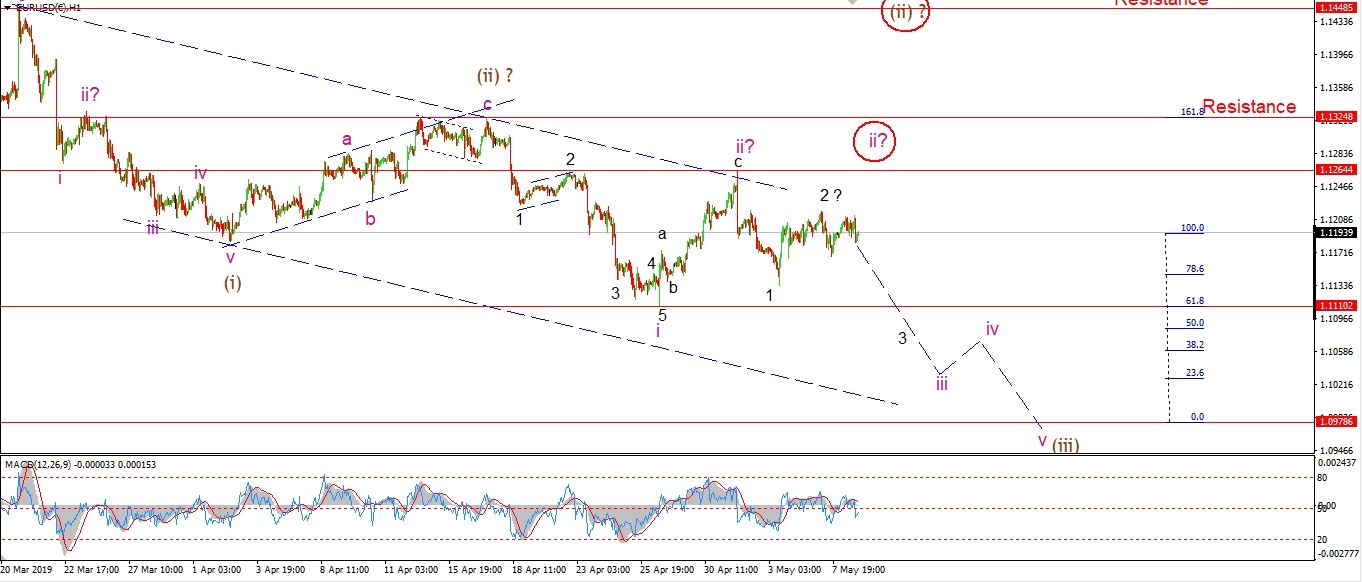 [/vc_column_text][/vc_column][vc_column width=”1/3″][vc_custom_heading text=”4 Hours” use_theme_fonts=”yes”][vc_column_text]
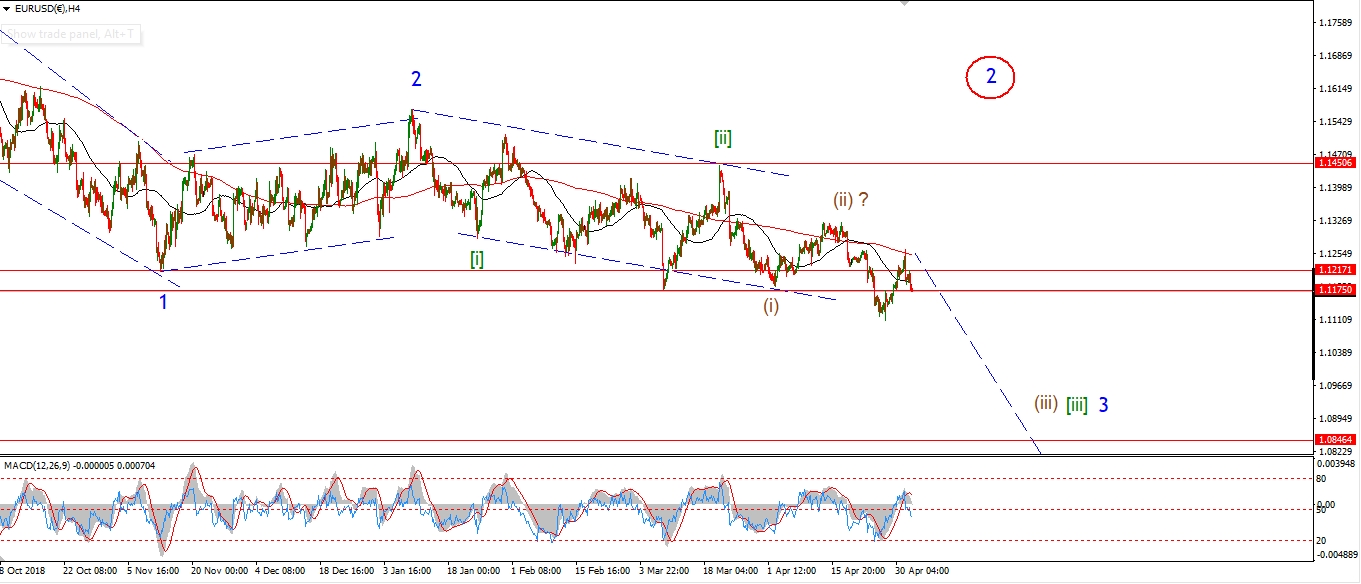 [/vc_column_text][vc_custom_heading text=”Daily” use_theme_fonts=”yes”][vc_column_text]
 [/vc_column_text][/vc_column][/vc_row]
[vc_row][vc_column][vc_column_text]
So far the wave ‘2’ high created on Tuesday is holding at 1.1217.
The expected downside acceleration has not materialized at all yet.
But neither has the market invalidated this current bearish count.
So long as the market keeps creating lower highs as it has,
then the bearish outlook is intact.
Tomorrow;
Initial resistance at 1.1264 should continue to hold,
and a break of 1.1110 will signal that we are moving into wave ‘3’ of ‘iii’.
[/vc_column_text][/vc_column][/vc_row]
[/_s2If]
[_s2If current_user_can(access_s2member_ccap_gbpusd)]
[vc_row][vc_column][vc_separator border_width=”5″][/vc_column][/vc_row][vc_row][vc_column][vc_column_text]
GBPUSD
[/vc_column_text][/vc_column][/vc_row][vc_row][vc_column][vc_separator border_width=”5″][/vc_column][/vc_row][vc_row][vc_column width=”2/3″][vc_custom_heading text=”1 hr” use_theme_fonts=”yes”][vc_column_text]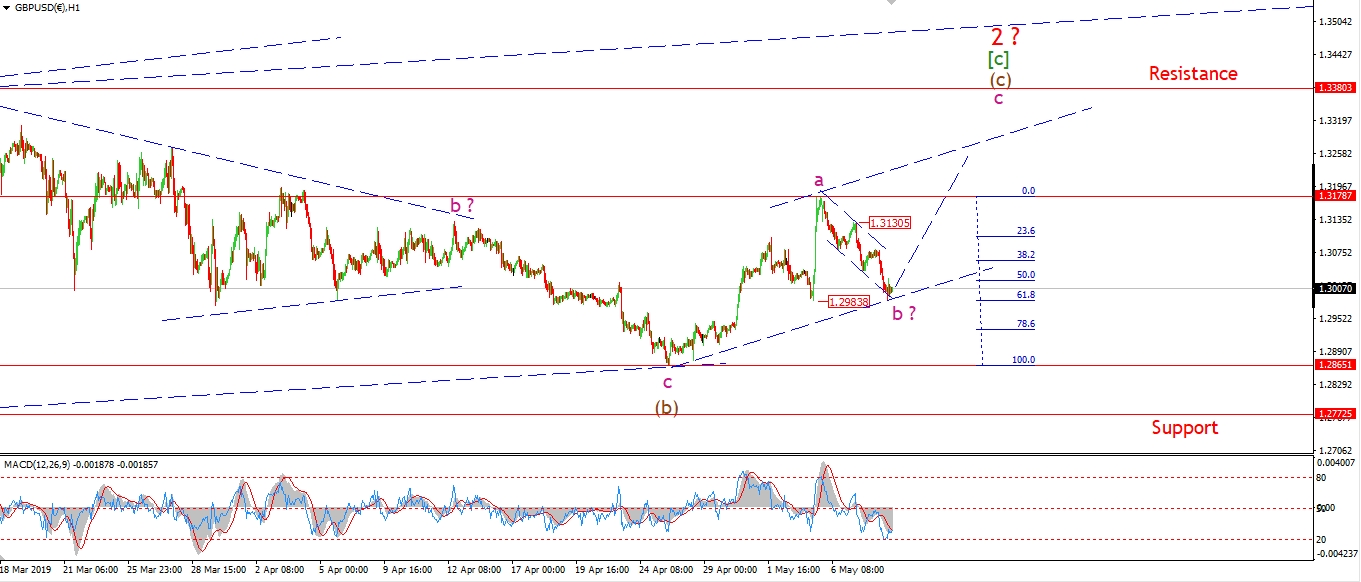 [/vc_column_text][/vc_column][vc_column width=”1/3″][vc_custom_heading text=”4 Hours” use_theme_fonts=”yes”][vc_column_text]
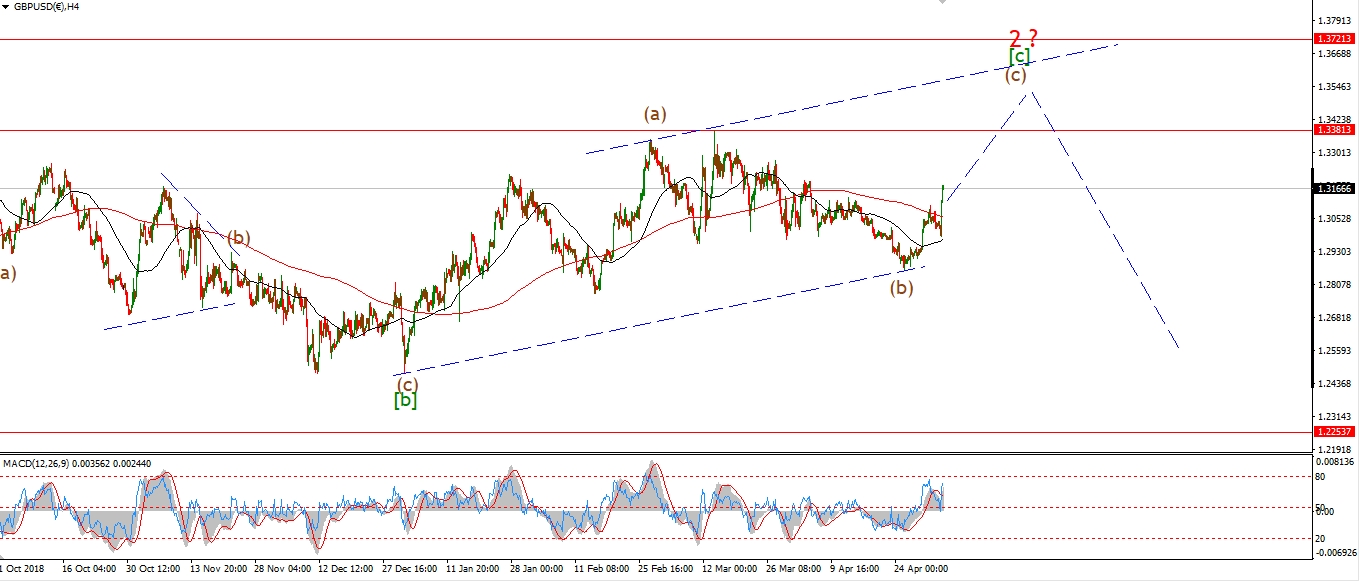 [/vc_column_text][vc_custom_heading text=”Daily” use_theme_fonts=”yes”][vc_column_text]
 [/vc_column_text][/vc_column][/vc_row]
[vc_row][vc_column][vc_column_text]
I have changed the wave count slightly today showing an ‘a,b,c’ rise for wave (c).
rather than a normal five wave structure.
The correction off the recent high at 1.3178 is too large in relation to the second wave,
to be counted as a fourth wave.
But it is very much in proportion when viewed as a ‘b’ wave.
The price has retraced to the previous fourth wave within wave ‘a’ at 1.2983 this evening.
This level also marks the 62% retracement level of wave ‘a’.
Tomorrow;
Watch for wave ‘b’ to complete near current levels overnight.
A push back above 1.3130 will signal wave ‘c’ has begun.
[/vc_column_text][/vc_column][/vc_row]
[/_s2If]
[_s2If current_user_can(access_s2member_ccap_usdjpy)]
[vc_row][vc_column][vc_separator border_width=”5″][/vc_column][/vc_row][vc_row][vc_column][vc_column_text]
USDJPY
[/vc_column_text][/vc_column][/vc_row][vc_row][vc_column][vc_separator border_width=”5″][/vc_column][/vc_row][vc_row][vc_column width=”2/3″][vc_custom_heading text=”1 hr” use_theme_fonts=”yes”][vc_column_text]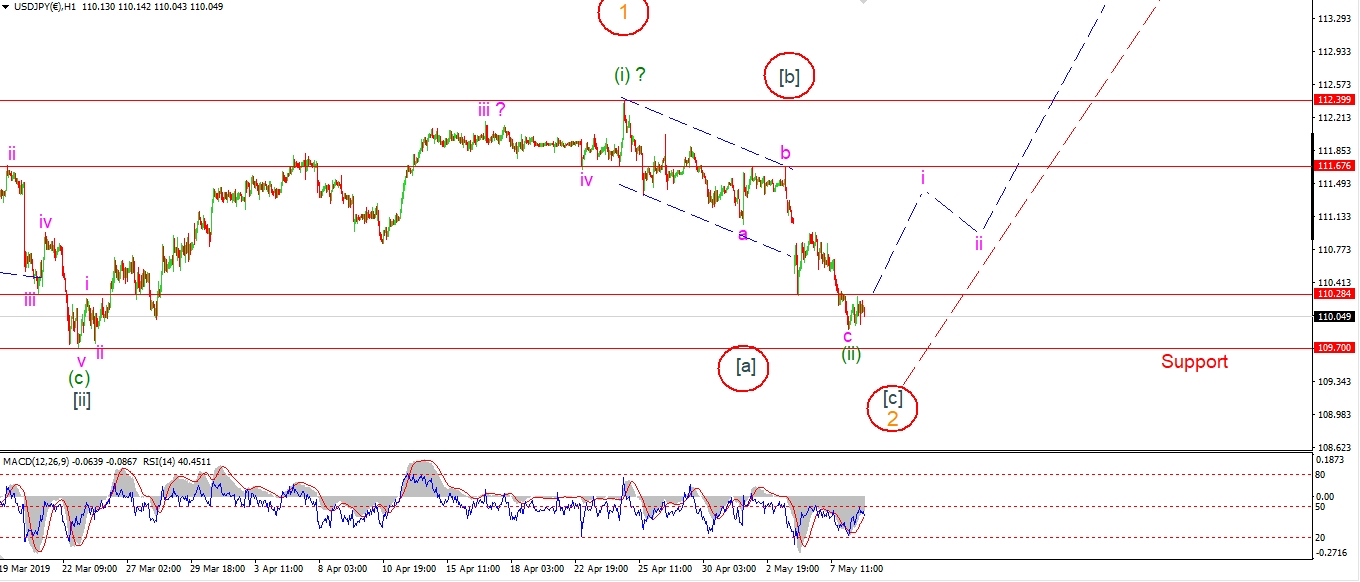 [/vc_column_text][/vc_column][vc_column width=”1/3″][vc_custom_heading text=”4 Hours” use_theme_fonts=”yes”][vc_column_text]
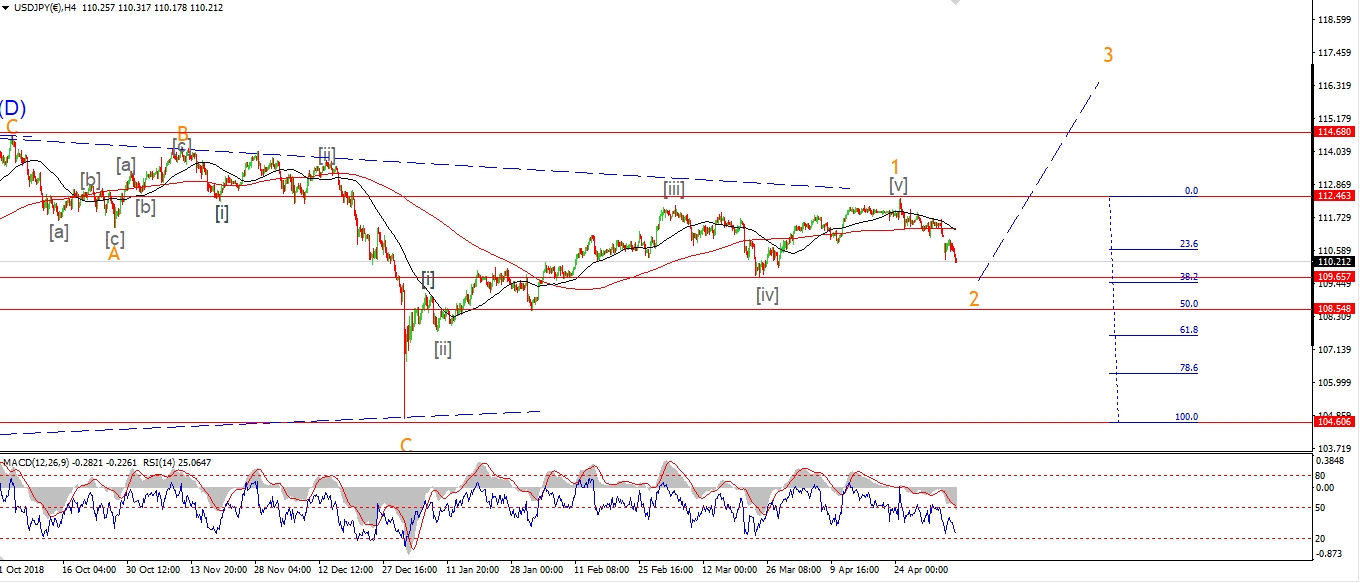 [/vc_column_text][vc_custom_heading text=”Daily” use_theme_fonts=”yes”][vc_column_text]
 [/vc_column_text][/vc_column][/vc_row]
[vc_row][vc_column][vc_column_text]
USDJPY is on the verge of triggering the alternate count shown circled in red.
A break of 109.70 confirm it for sure,
but even if that low does not break,
I think the alternate count may fit the action better now anyway.
Both wave counts that I am working with are bullish in the medium term.
As both wave counts call for a rally in wave ‘3’.
Tomorrow;
Watch for a break of 109.70 to confirm the alternate count.
We should see a turn higher soon enough to begin wave ‘3’,
There is every chance that wave ‘i’ will begin before the end of this week.
[/vc_column_text][/vc_column][/vc_row]
[/_s2If]
[_s2If current_user_can(access_s2member_ccap_dow_jones)]
[vc_row][vc_column][vc_separator border_width=”5″][/vc_column][/vc_row][vc_row][vc_column][vc_column_text]
DOW JONES INDUSTRIALS
[/vc_column_text][/vc_column][/vc_row][vc_row][vc_column][vc_separator border_width=”5″][/vc_column][/vc_row][vc_row][vc_column width=”2/3″][vc_custom_heading text=”1 hr” use_theme_fonts=”yes”][vc_column_text]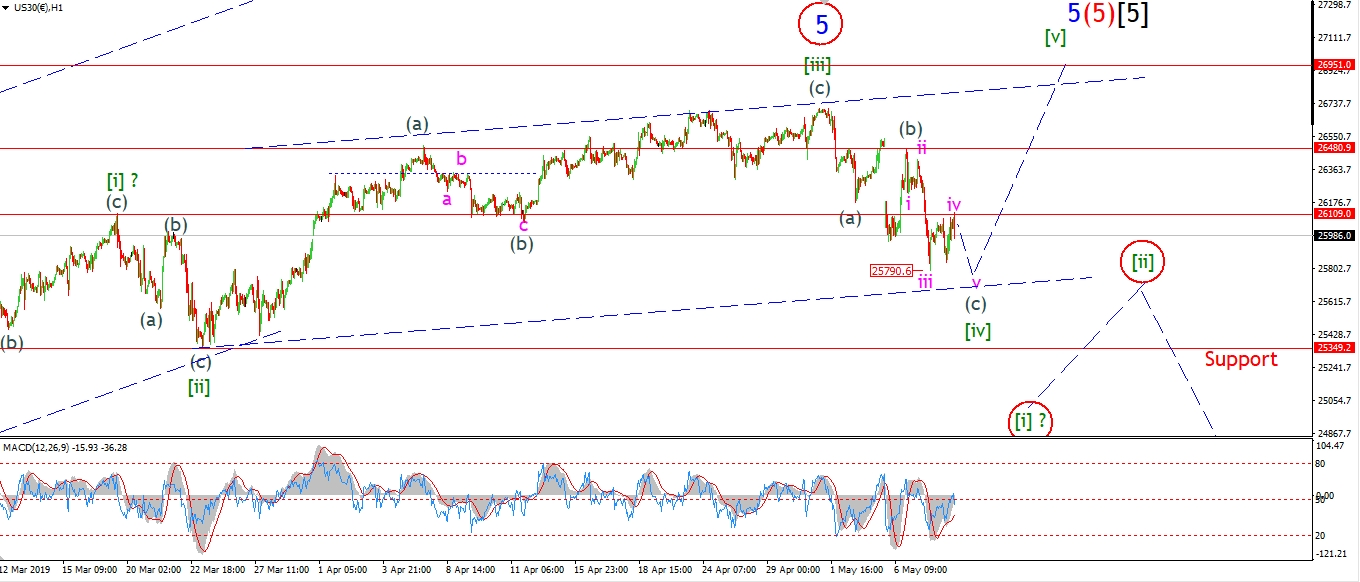 [/vc_column_text][/vc_column][vc_column width=”1/3″][vc_custom_heading text=”4 Hours” use_theme_fonts=”yes”][vc_column_text]
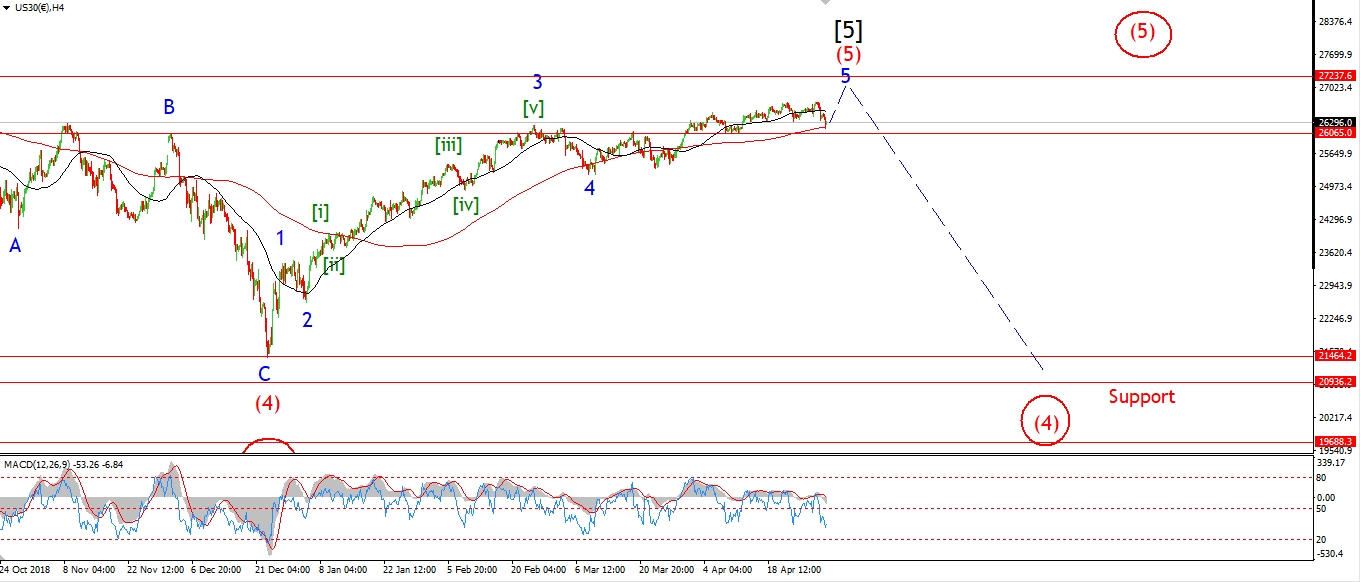 [/vc_column_text][vc_custom_heading text=”Daily” use_theme_fonts=”yes”][vc_column_text]
 [/vc_column_text][/vc_column][/vc_row]
[vc_row][vc_column][vc_column_text]
Todays rise in the DOW looks like a three wave correction higher.
I have labelled it as wave ‘iv’ of (c).
One more dip below 25790 tomorrow will complete a five wave decline in wave (c).
And that should complete this wave [iv] correction.
If the market is only correcting in a fourth wave within an ending diagonal,
then the previous wave [ii] should offer significant support at 25349.
A break through this level however, will trigger the alternate count shown.
And then we can work on identifying a full five wave structure lower off the high.
This will signal the market is turning down in a possible large degree trend change.
And the bear market will be on the cards once again.
Tomorrow;
Watch for a final drop in wave ‘v’ of (c),
and then a turn higher to begin a three wave rally in wave [v] to complete this ending diagonal.
A break of the wave (b) high at 26480 will confirm that wave [v] has begun.
[/vc_column_text][/vc_column][/vc_row]
[/_s2If]
[_s2If current_user_can(access_s2member_ccap_gold)]
[vc_row][vc_column][vc_separator border_width=”5″][/vc_column][/vc_row][vc_row][vc_column][vc_column_text]
GOLD
[/vc_column_text][/vc_column][/vc_row][vc_row][vc_column][vc_separator border_width=”5″][/vc_column][/vc_row][vc_row][vc_column width=”2/3″][vc_custom_heading text=”1 hr” use_theme_fonts=”yes”][vc_column_text]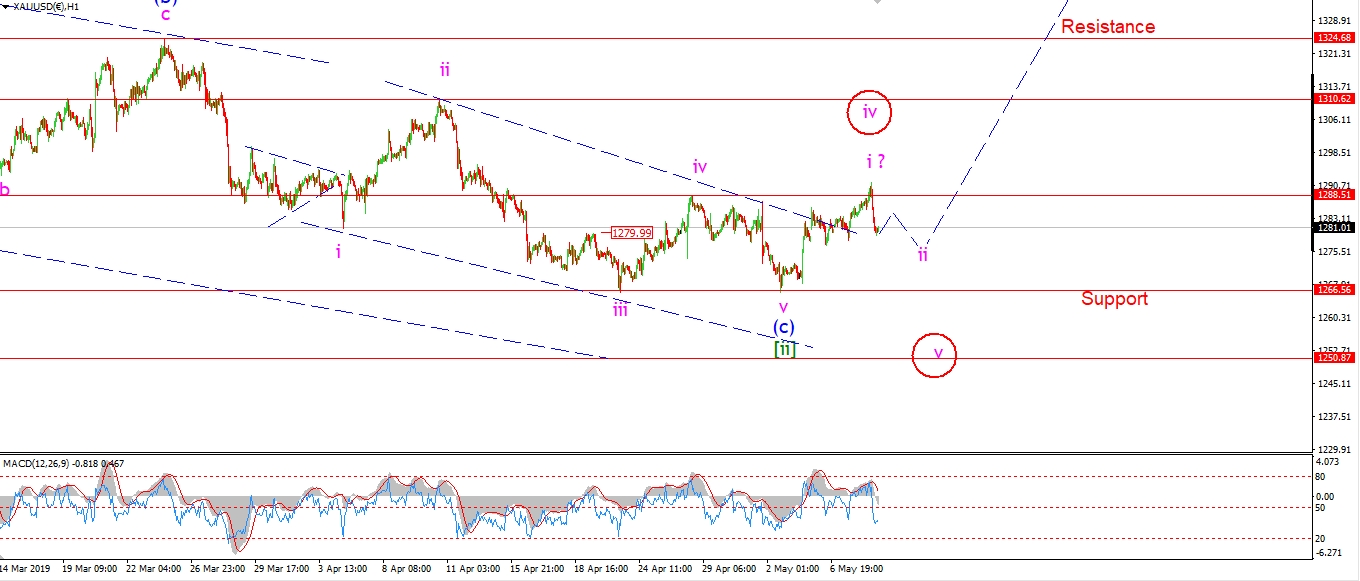 [/vc_column_text][/vc_column][vc_column width=”1/3″][vc_custom_heading text=”4 Hours” use_theme_fonts=”yes”][vc_column_text]
 [/vc_column_text][vc_custom_heading text=”Daily” use_theme_fonts=”yes”][vc_column_text]
 [/vc_column_text][/vc_column][/vc_row]
[vc_row][vc_column][vc_column_text]
Gold broke through the 1288 level this afternoon and immediately sold off again.
The rise off the 1266.50 lows can be counted as a five wave move,
but we have not threatened the 1300 level at all which would be a bullish signal.
This leaves open the possibility that wave ‘iv’ of (c) is still in force.
I have shown that as the alternate count again.
Tomorrow;
Watch for a three wave decline in wave ‘ii’ to hold above the 1267 level.
[/vc_column_text][/vc_column][/vc_row]
[/_s2If]
[_s2If current_user_can(access_s2member_ccap_crude)]
[vc_row][vc_column][vc_separator border_width=”5″][/vc_column][/vc_row][vc_row][vc_column][vc_column_text]
U.S CRUDE OIL
[/vc_column_text][/vc_column][/vc_row][vc_row][vc_column][vc_separator border_width=”5″][/vc_column][/vc_row][vc_row][vc_column width=”2/3″][vc_custom_heading text=”1 hr” use_theme_fonts=”yes”][vc_column_text] [/vc_column_text][/vc_column][vc_column width=”1/3″][vc_custom_heading text=”4 Hours” use_theme_fonts=”yes”][vc_column_text]
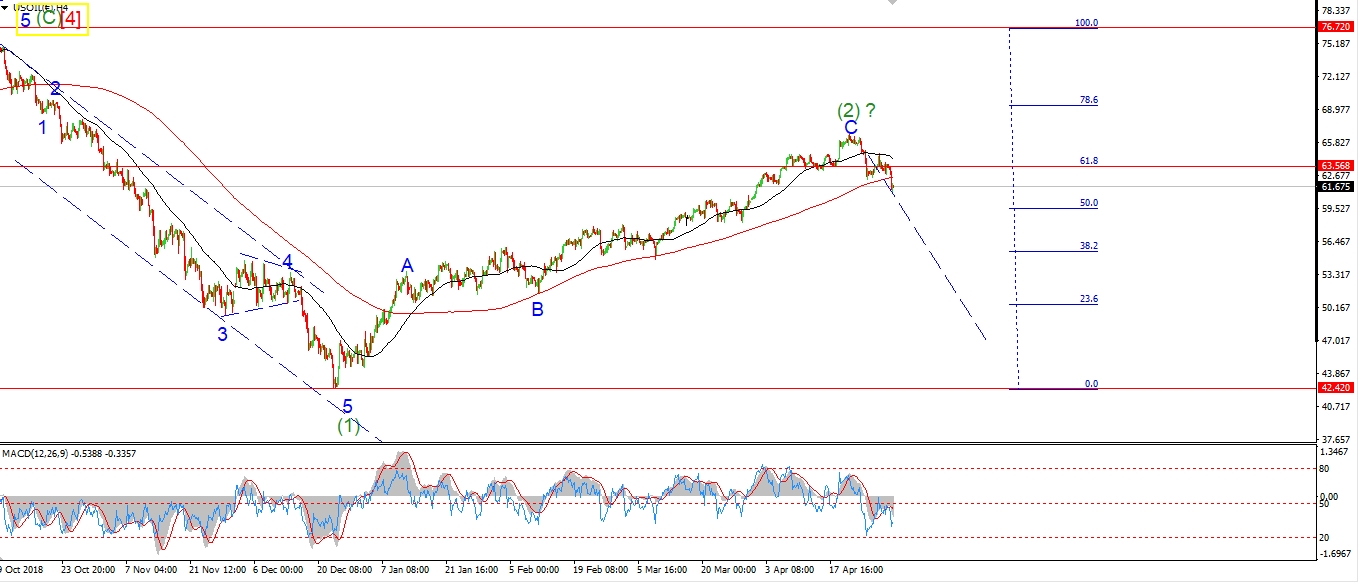 [/vc_column_text][vc_custom_heading text=”Daily” use_theme_fonts=”yes”][vc_column_text]
 [/vc_column_text][/vc_column][/vc_row]
[vc_row][vc_column][vc_column_text]
No major change to crude tonight.
The price is running higher off the low of wave ‘b’ in a possible wave ‘c’ of (ii).
so far the price has traced out a three wave rally off wave ‘b’.
If we see another flat day tomorrow,
then wave ‘b’ will be taking the form of a triangle.
This does not change the minimum target for wave ‘c’ which still lies at 62.95 at wave ‘a’.
Tomorrow;
Watch for wave ‘c’ to continue higher and complete with a break of 62.95.
At that point we will have a series of impulsive waves lower off the high in place.
And the possibility for a drop in a third wave.
[/vc_column_text][/vc_column][/vc_row]
[/_s2If]
[_s2If current_user_can(access_s2member_ccap_us10yr)]
[vc_row][vc_column][vc_separator border_width=”5″][/vc_column][/vc_row][vc_row][vc_column][vc_column_text]
US 10 yr Treasuries.
[/vc_column_text][/vc_column][/vc_row][vc_row][vc_column][vc_separator border_width=”5″][/vc_column][/vc_row][vc_row][vc_column width=”2/3″][vc_custom_heading text=”1 hr” use_theme_fonts=”yes”][vc_column_text]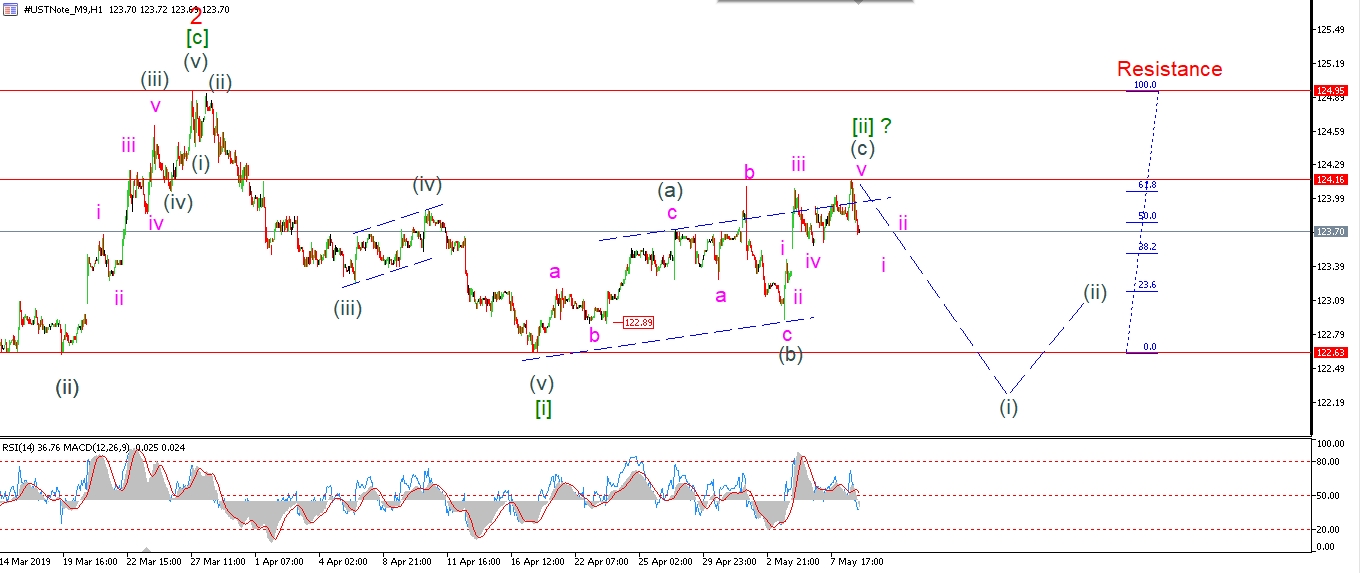 [/vc_column_text][/vc_column][vc_column width=”1/3″][vc_custom_heading text=”4 Hours” use_theme_fonts=”yes”][vc_column_text]
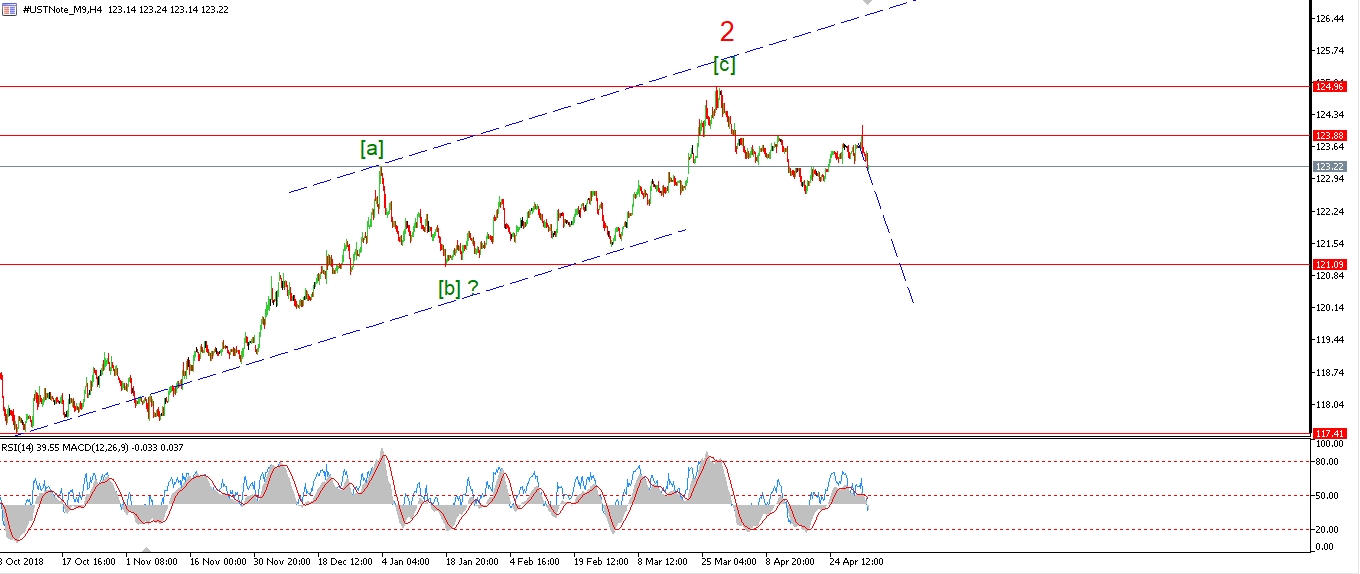 [/vc_column_text][vc_custom_heading text=”Daily” use_theme_fonts=”yes”][vc_column_text]
 [/vc_column_text][/vc_column][/vc_row]
[vc_row][vc_column][vc_column_text]
The 10YR rose to break 124.10 today in wave ‘v’ of (c).
The market topped at 124.16 and then turned immediately lower again.
Wave ‘v’ seems to be an ending diagonal,
And todays move off the high is viewed as the fist step lower into wave [iii].
Tomorrow;
We should see a lower high now form below 124.16 in wave ‘i’ ans ‘ii’.
watch for 124.16 to hold and wave (i) of [iii] to continue lower.
[/vc_column_text][/vc_column][/vc_row]
[/_s2If]
[_s2If current_user_can(access_s2member_ccap_silver)]
[vc_row][vc_column][vc_separator border_width=”5″][/vc_column][/vc_row][vc_row][vc_column][vc_column_text]
SILVER
[/vc_column_text][/vc_column][/vc_row][vc_row][vc_column][vc_separator border_width=”5″][/vc_column][/vc_row][vc_row][vc_column width=”2/3″][vc_custom_heading text=”1 hr” use_theme_fonts=”yes”][vc_column_text]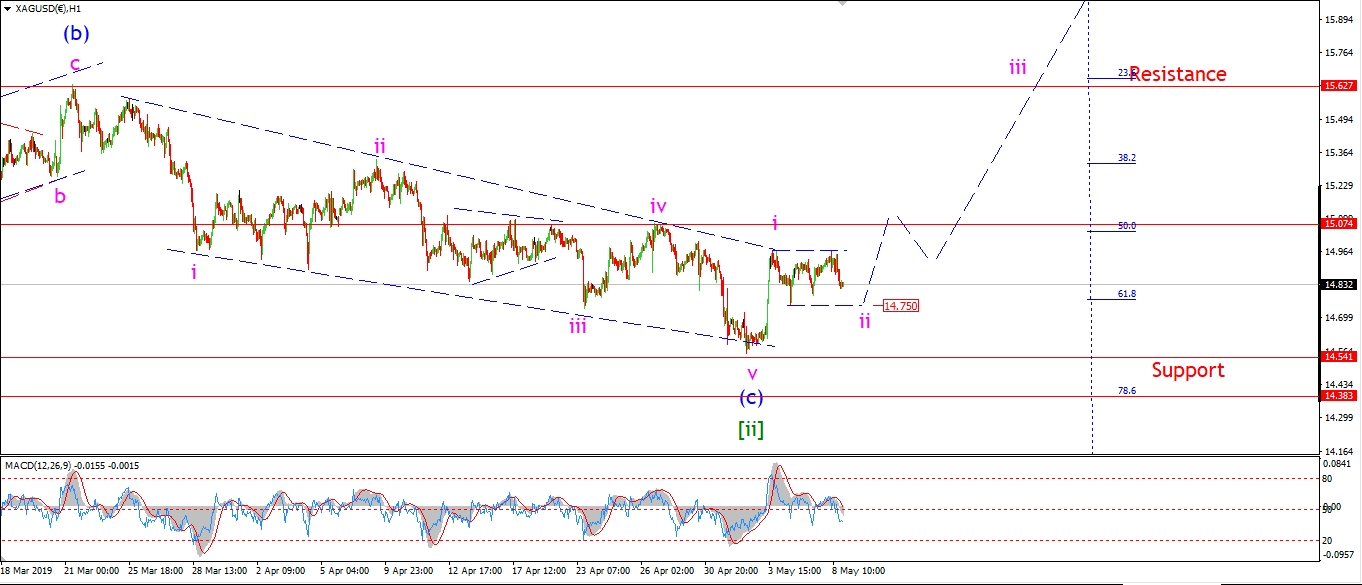 [/vc_column_text][/vc_column][vc_column width=”1/3″][vc_custom_heading text=”4 Hours” use_theme_fonts=”yes”][vc_column_text]
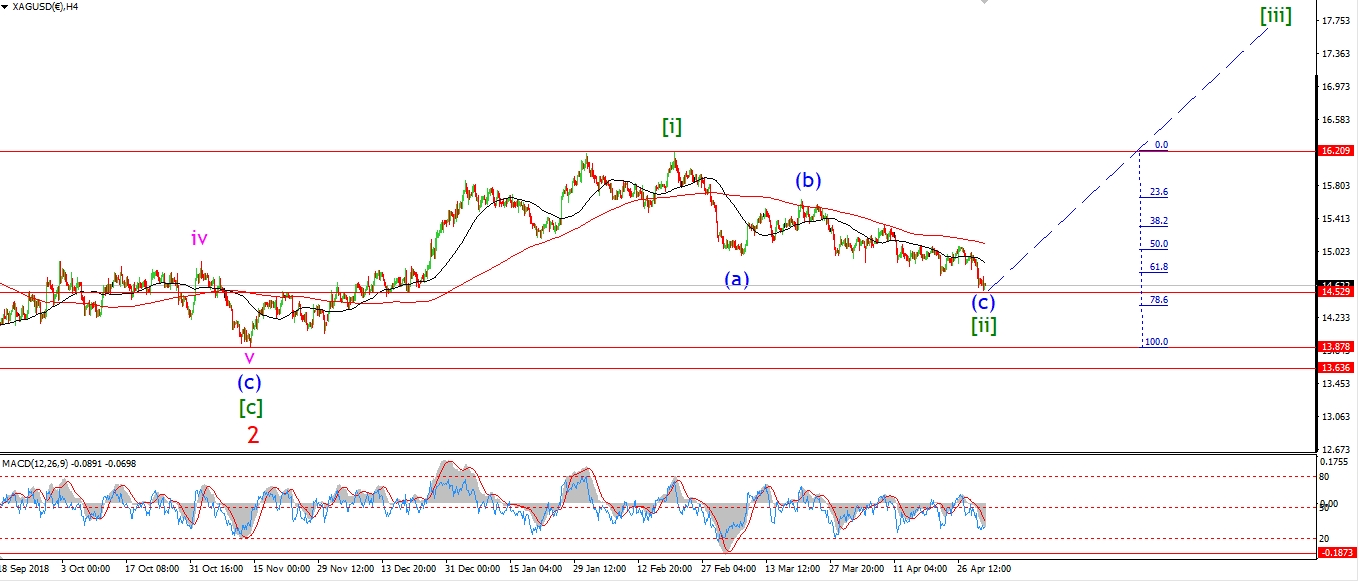 [/vc_column_text][vc_custom_heading text=”Daily” use_theme_fonts=”yes”][vc_column_text]
 [/vc_column_text][/vc_column][/vc_row]
[vc_row][vc_column][vc_column_text]
Silver has continued in a corrective ranging move today.
It is possible that wave ‘i’ completed at the recent high,
and this correction is wave ‘ii’ now ongoing.
The internal three wave move higher on Tuesday
suggests an internal ‘b’ wave in wave ‘ii’.
If we see a fall into 14.75,
and then a rally again to break above 15.07 again,
that will signal wave ‘iii’ up has begun.
And then we can look to resistance at 15.62 for confirmation that the market has turned higher in wave [iii].
Tomorrow;
Watch for wave ‘ii’ to close out at 14.75 and then turn higher in wave ‘iii’.
[/vc_column_text][/vc_column][/vc_row]
[/_s2If]
[_s2If current_user_can(access_s2member_ccap_sp500)]
[vc_row][vc_column][vc_separator border_width=”5″][/vc_column][/vc_row][vc_row][vc_column][vc_column_text]
S&P 500.
[/vc_column_text][/vc_column][/vc_row][vc_row][vc_column][vc_separator border_width=”5″][/vc_column][/vc_row][vc_row][vc_column width=”2/3″][vc_custom_heading text=”1 hr” use_theme_fonts=”yes”][vc_column_text]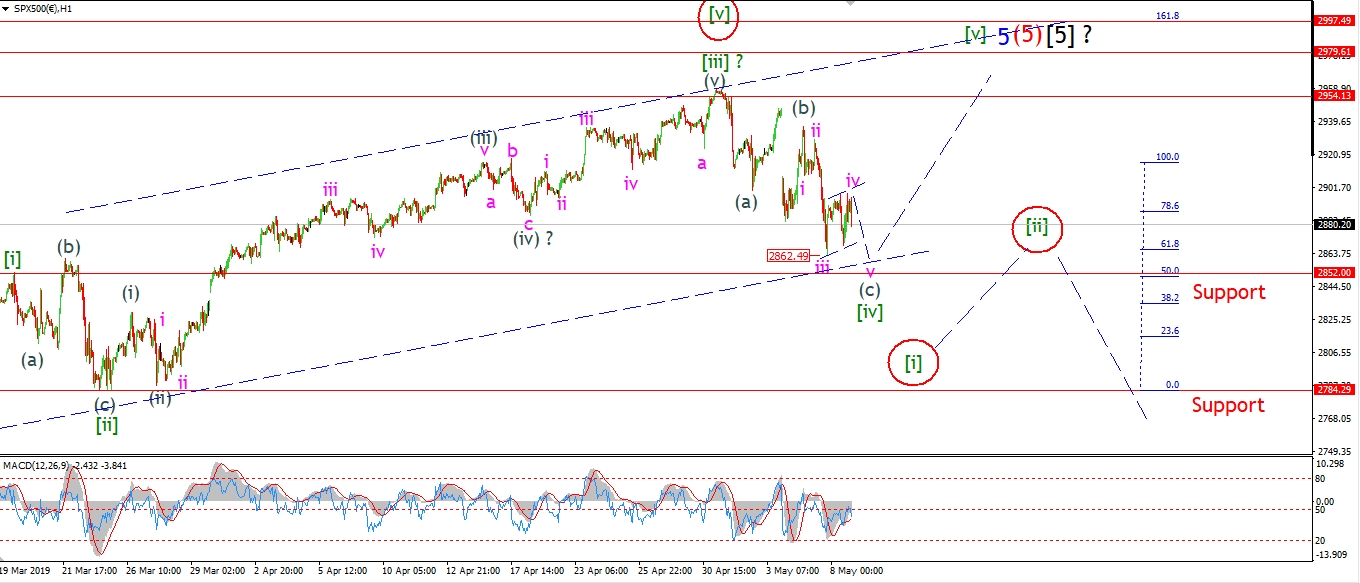 [/vc_column_text][/vc_column][vc_column width=”1/3″][vc_custom_heading text=”4 Hours” use_theme_fonts=”yes”][vc_column_text]
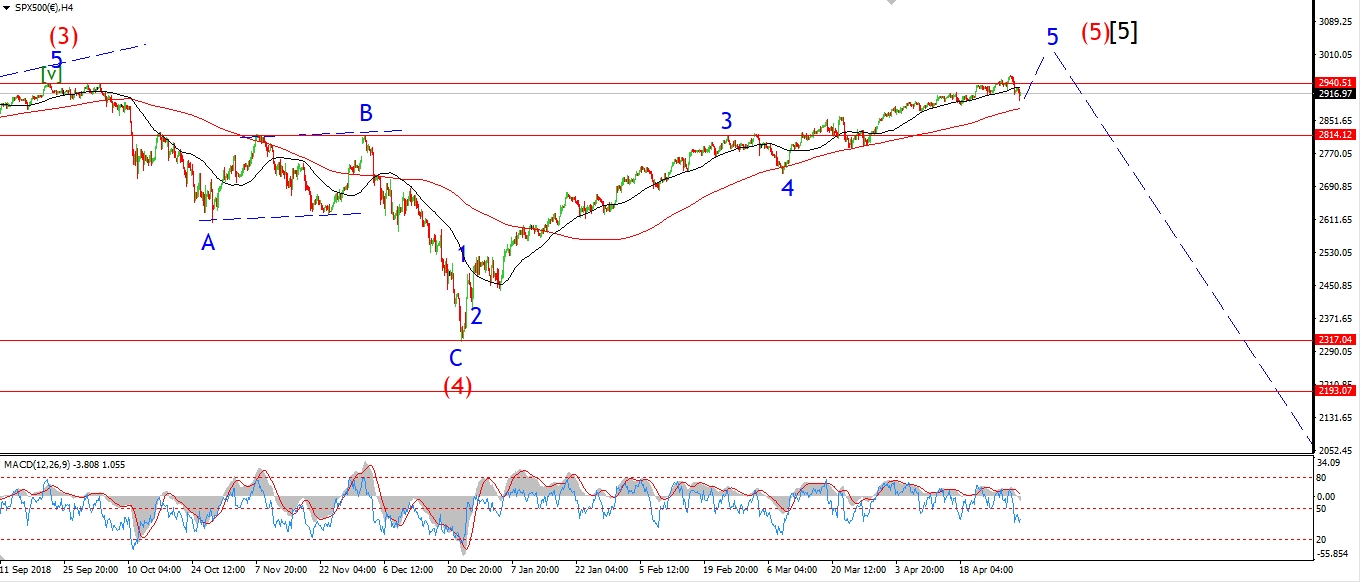 [/vc_column_text][vc_custom_heading text=”Daily” use_theme_fonts=”yes”][vc_column_text]
 [/vc_column_text][/vc_column][/vc_row]
[vc_row][vc_column][vc_column_text]
The S&P has traced out a three wave move higher over the last 24 hours.
This is labelled as wave ‘iv’ of (c), similar to the DOW.
A drop below 2862 again at wave ‘iii’ will complete five waves down in wave (c).
Although the margins are very tight in this area now.
2852 marks the high of wave [i] green.
Wave [iv] must hold above this level for the larger wave ‘5’ to count as a regular five wave pattern.
If that level breaks,
I will have to consider either an ending diagonal wave ‘5’,
or,
the idea that the market has already topped out at 2954.
This outcome is not problematic at all in my view,
as the market did make a new all time high at that level.
Unlike the DOW which is still holding below its October high,
the S&P is clear to begin a bear market now.
All that we need is a clear impulse wave lower to signal the top is in.
Tomorrow;
watch for wave ‘v’ of (c) to hold above 2852.
And then begin a final rally in wave [v] of ‘5’.
[/vc_column_text][/vc_column][/vc_row]
[/_s2If]
[vc_row][vc_column][vc_column_text]
[/vc_column_text][/vc_column][/vc_row]
[vc_row][vc_column][vc_separator border_width=”5″][/vc_column][/vc_row]