
[vc_row][vc_column][vc_separator border_width=”5″][/vc_column][/vc_row]
[vc_row][vc_column][vc_column_text]
Good evening folks.
Heres the latest COT setup for Gold.

The market is set for a rally now,
with the players at the opposite end of the spectrum now fully entrenched.
Nobody expects a rally, thats for sure.
This is the oversold backdrop to the developing bullish wave structure.
The rally is coming.
[/vc_column_text][/vc_column][/vc_row]
[_s2If current_user_can(access_s2member_ccap_eurusd)]
[vc_row][vc_column][vc_separator border_width=”5″][/vc_column][/vc_row]
[vc_row][vc_column][vc_column_text]
EURUSD
[/vc_column_text][/vc_column][/vc_row]
[vc_row][vc_column][vc_separator border_width=”5″][/vc_column][/vc_row][vc_row][vc_column width=”2/3″][vc_custom_heading text=”1 hr” use_theme_fonts=”yes”][vc_column_text]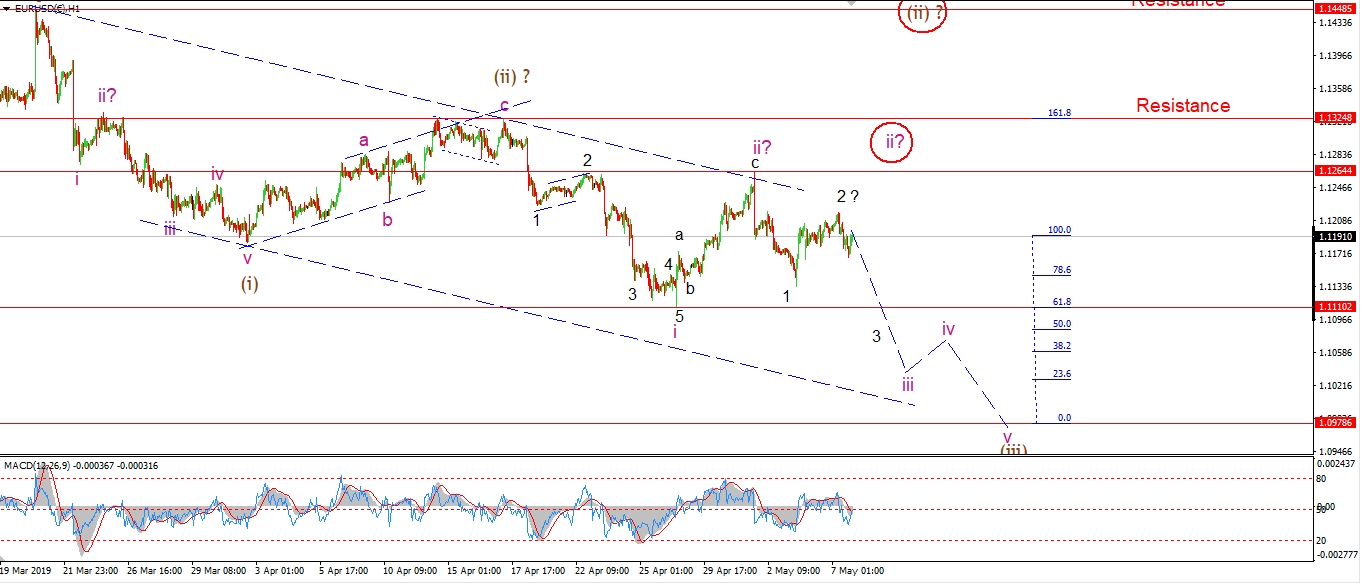 [/vc_column_text][/vc_column][vc_column width=”1/3″][vc_custom_heading text=”4 Hours” use_theme_fonts=”yes”][vc_column_text]
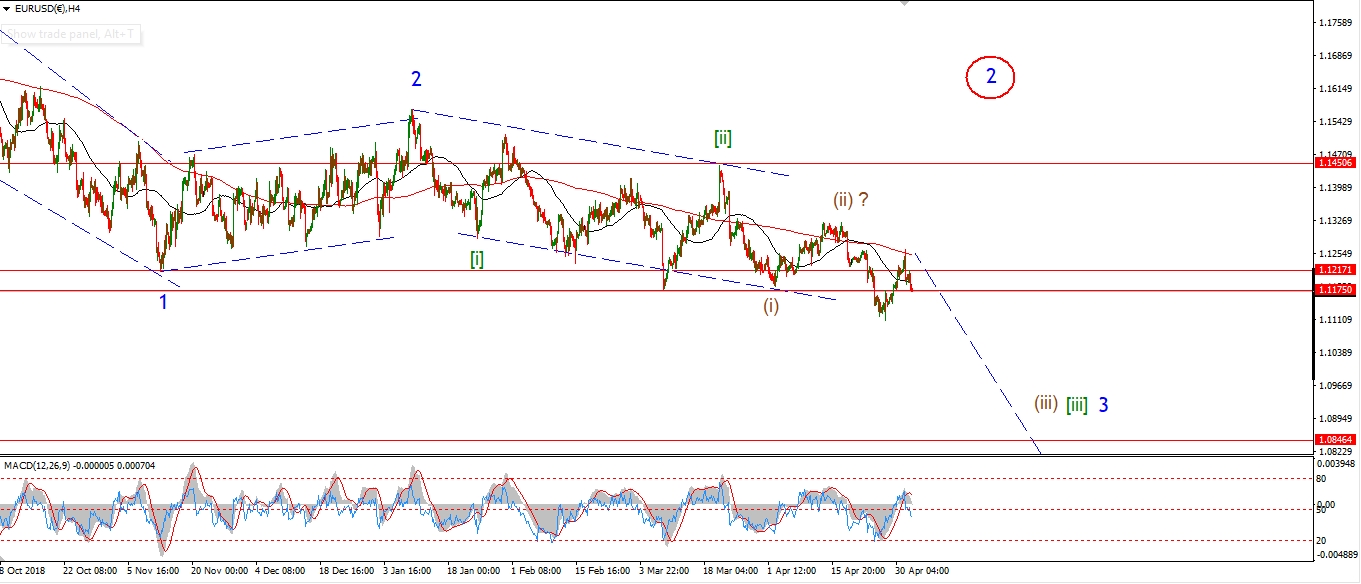 [/vc_column_text][vc_custom_heading text=”Daily” use_theme_fonts=”yes”][vc_column_text]
 [/vc_column_text][/vc_column][/vc_row]
[vc_row][vc_column][vc_column_text]
Given the moves experienced in the stock market over the last few days,
you might expect the currency markets to reflect some of that volatility.
But no, EURUSD is again very quiet.
The wave count has not changed as a result.
The price seems to be correcting sideways in a possible second wave.
Either wave ‘ii’ pink,
or wave ‘2’ of ‘iii’ pink.
both wave counts suggest that the next larger move is to the downside in a third of a third wave.
And a break of 1.1110 will confirm that view.
Tomorrow;
Watch for wave ‘2’ to black to close out and begin wave ‘3’ down.
A break of 1.1264 will trigger the alternate count.
[/vc_column_text][/vc_column][/vc_row]
[/_s2If]
[_s2If current_user_can(access_s2member_ccap_gbpusd)]
[vc_row][vc_column][vc_separator border_width=”5″][/vc_column][/vc_row][vc_row][vc_column][vc_column_text]
GBPUSD
[/vc_column_text][/vc_column][/vc_row][vc_row][vc_column][vc_separator border_width=”5″][/vc_column][/vc_row][vc_row][vc_column width=”2/3″][vc_custom_heading text=”1 hr” use_theme_fonts=”yes”][vc_column_text]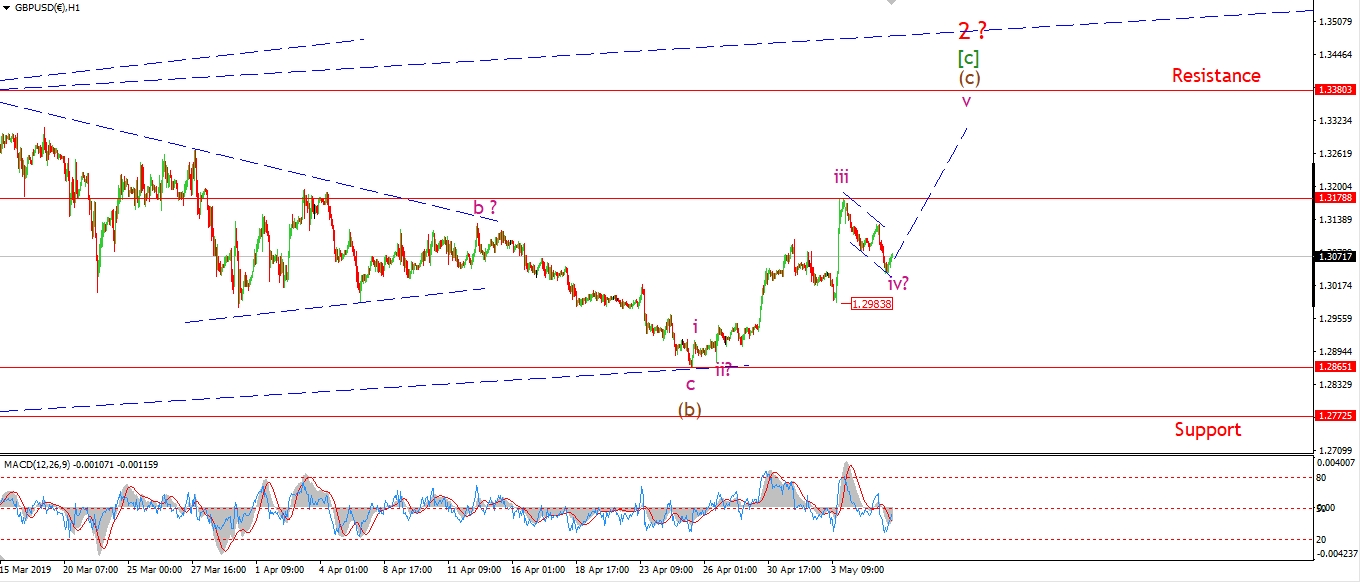 [/vc_column_text][/vc_column][vc_column width=”1/3″][vc_custom_heading text=”4 Hours” use_theme_fonts=”yes”][vc_column_text]
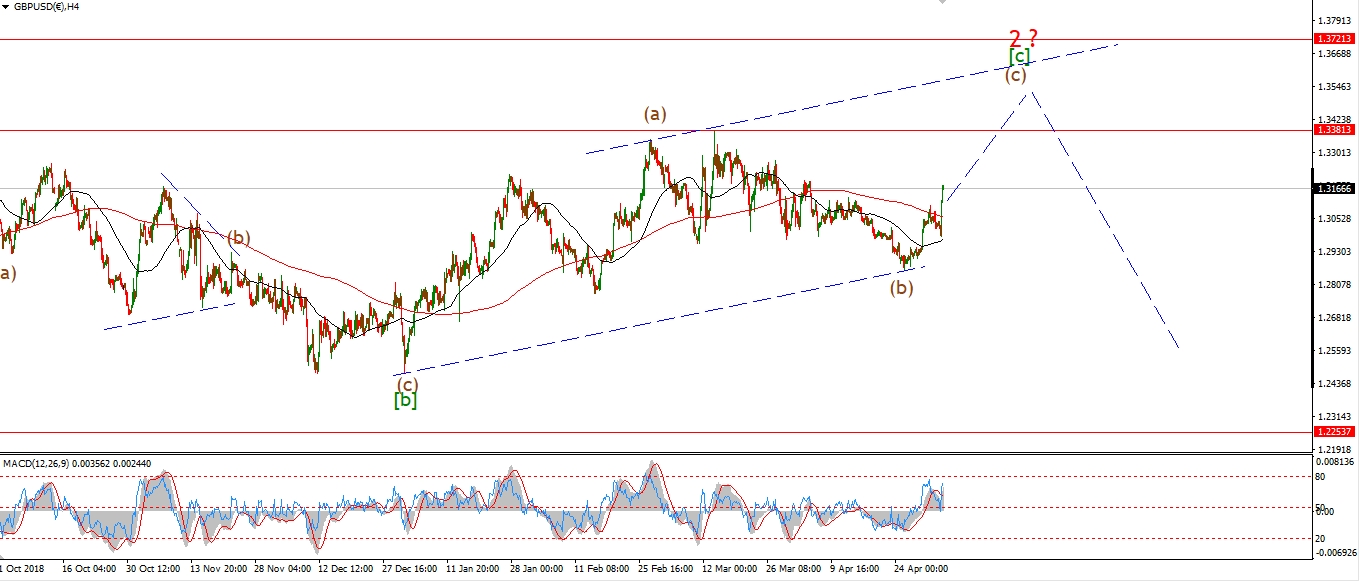 [/vc_column_text][vc_custom_heading text=”Daily” use_theme_fonts=”yes”][vc_column_text]
 [/vc_column_text][/vc_column][/vc_row]
[vc_row][vc_column][vc_column_text]
Cable has corrected in three waves off the recent wave ‘iii’ high at 1.3178.
The price has filled a small trend channel at wave ‘iv’ this evening.
If wave ‘iv’ is now complete,
then we should see a return higher for wave ‘v’ pink over the coming days.
Tomorrow;
the low at 1.2984 marks the internal fourth wave in wave ‘iii’ pink.
This level should offer support for wave ‘iv’.
Watch for wave ‘v’ to begin tomorrow with a push above 1.3178.
[/vc_column_text][/vc_column][/vc_row]
[/_s2If]
[_s2If current_user_can(access_s2member_ccap_usdjpy)]
[vc_row][vc_column][vc_separator border_width=”5″][/vc_column][/vc_row][vc_row][vc_column][vc_column_text]
USDJPY
[/vc_column_text][/vc_column][/vc_row][vc_row][vc_column][vc_separator border_width=”5″][/vc_column][/vc_row][vc_row][vc_column width=”2/3″][vc_custom_heading text=”1 hr” use_theme_fonts=”yes”][vc_column_text]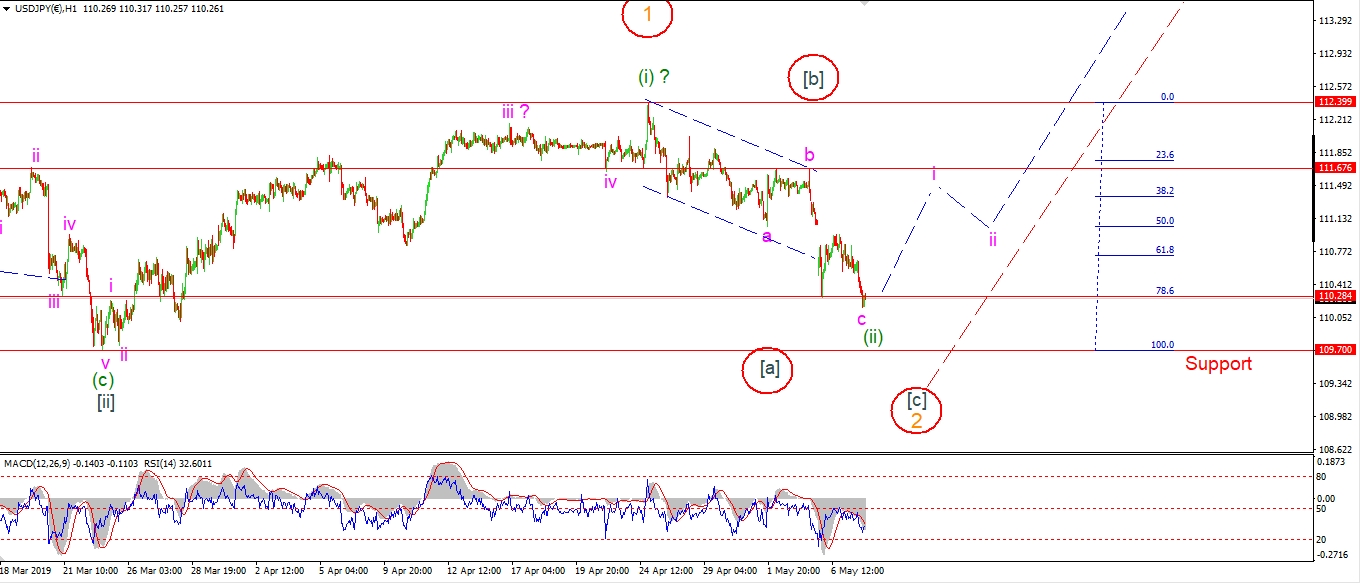 [/vc_column_text][/vc_column][vc_column width=”1/3″][vc_custom_heading text=”4 Hours” use_theme_fonts=”yes”][vc_column_text]
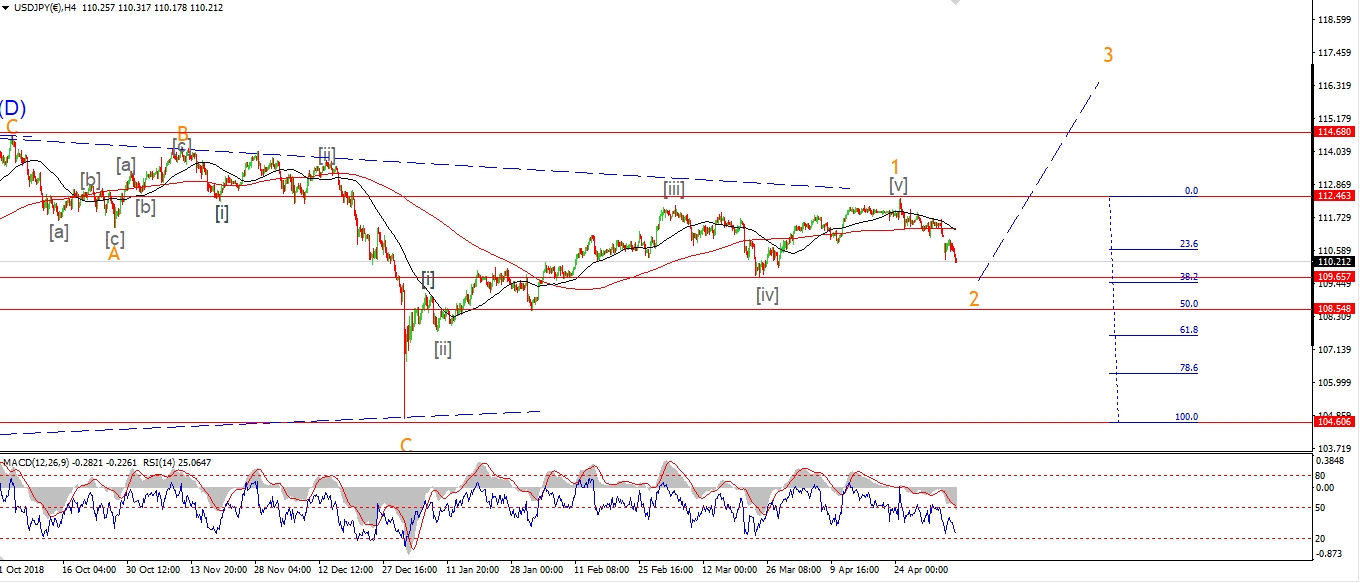 [/vc_column_text][vc_custom_heading text=”Daily” use_theme_fonts=”yes”][vc_column_text]
 [/vc_column_text][/vc_column][/vc_row]
[vc_row][vc_column][vc_column_text]
Given the continued weakness in USDJPY I am looking seriously at the alternate count this evening.
I have labelled the 4hr chart with that alternate count.
The market has created a five wave move higher off 104.60 into the recent high at 112.39.
This is labelled wave ‘1’ up.
And the correction off that high is labelled as a developing wave ‘2’.
The price is approaching the previosu fourth wave low at 109.65 now,
This level also marks the 38.2% retracement level.
Once this correction completes,
wave ‘3’ should follow to new highs in the area of 120.00.
Back to the short term count.
The action has not invalidated the short term count just yet.
Only a break of the 109.70 will do that.
The action off the high can still be viewed as a correction in wave (ii).
With a rally in wave (iii) expected.
Tomorrow;
Price must hold above 109.70.
Watch for wave (ii) to find a low above that level.
A rally back towards 111.67 should signal the beginning of wave ‘i’.
[/vc_column_text][/vc_column][/vc_row]
[/_s2If]
[_s2If current_user_can(access_s2member_ccap_dow_jones)]
[vc_row][vc_column][vc_separator border_width=”5″][/vc_column][/vc_row][vc_row][vc_column][vc_column_text]
DOW JONES INDUSTRIALS
[/vc_column_text][/vc_column][/vc_row][vc_row][vc_column][vc_separator border_width=”5″][/vc_column][/vc_row][vc_row][vc_column width=”2/3″][vc_custom_heading text=”1 hr” use_theme_fonts=”yes”][vc_column_text]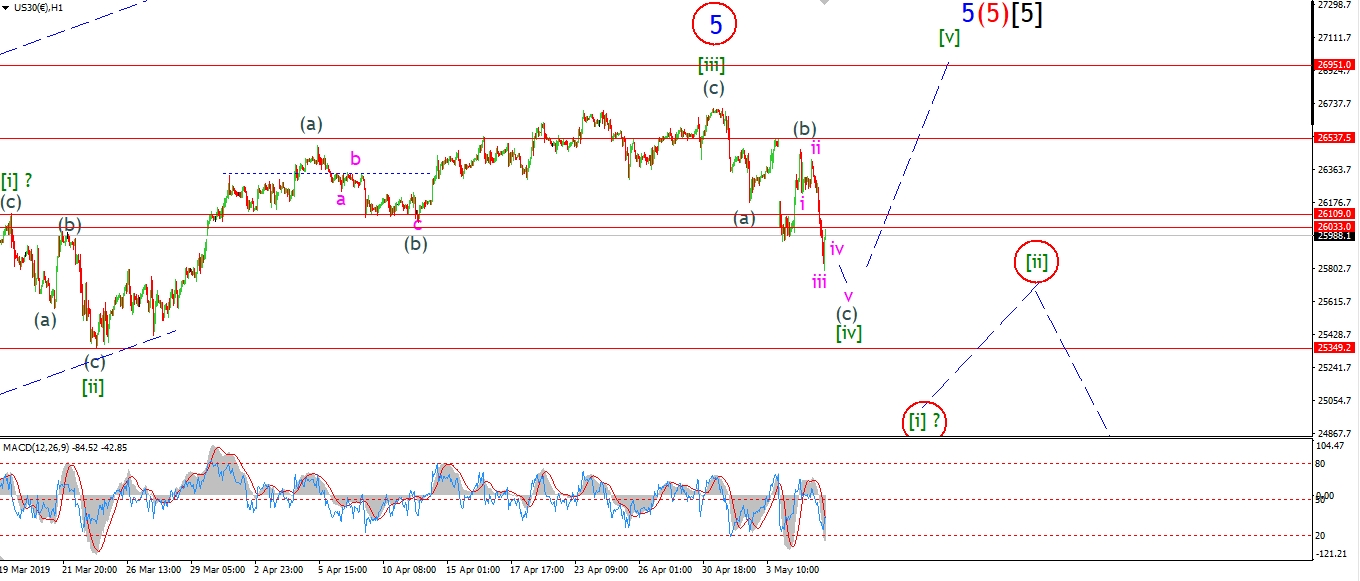 [/vc_column_text][/vc_column][vc_column width=”1/3″][vc_custom_heading text=”4 Hours” use_theme_fonts=”yes”][vc_column_text]
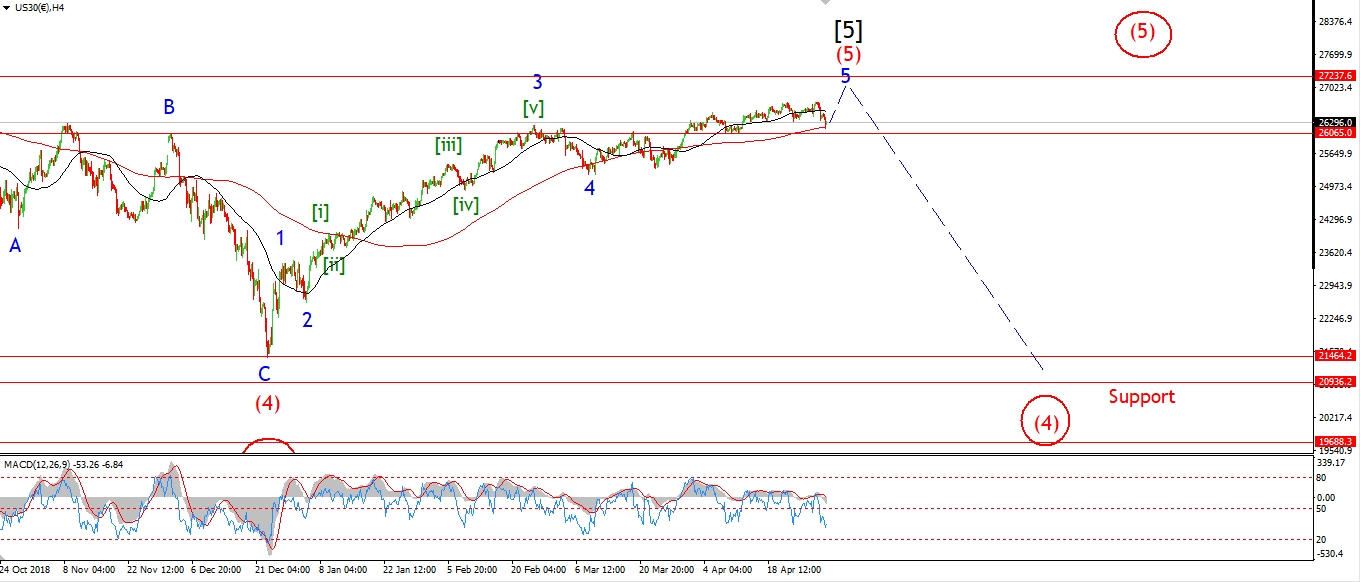 [/vc_column_text][vc_custom_heading text=”Daily” use_theme_fonts=”yes”][vc_column_text]
 [/vc_column_text][/vc_column][/vc_row]
[vc_row][vc_column][vc_column_text]
The DOW is fast running out of bullish interpretations now!
We have not hit a new all time high in the rally off the December lows like the broader averages,
So I am still open to that happening in an ending diagonal scenario as shown on the short term count.
A new high would simplify the larger wave structure,
rather that calling it a failed fifth wave.
We will just have to wait and see what the market does from here.
I have shown a bearish alternate count as a developing wave [i] down.
If the market breaks below 25349 again that will trigger the alternate count.
And we can prepare for a very large move lower again,
with a minimum target at about 21000.
Either way we look at it,
we are at the end of a massive bull market move.
One that began at least in March 2009 at wave [4] black.
But you could also argue that the market is now completing a move off the 1932 lows.
So the bearish potential is huge at this point.
Tomorrow;
A rally back above 26530 again will suggest that the new high is in play.
watch for wave (c) to complete and wave (i) of [v] to begin.
25349 is the key level now.
[/vc_column_text][/vc_column][/vc_row]
[/_s2If]
[_s2If current_user_can(access_s2member_ccap_gold)]
[vc_row][vc_column][vc_separator border_width=”5″][/vc_column][/vc_row][vc_row][vc_column][vc_column_text]
GOLD
[/vc_column_text][/vc_column][/vc_row][vc_row][vc_column][vc_separator border_width=”5″][/vc_column][/vc_row][vc_row][vc_column width=”2/3″][vc_custom_heading text=”1 hr” use_theme_fonts=”yes”][vc_column_text]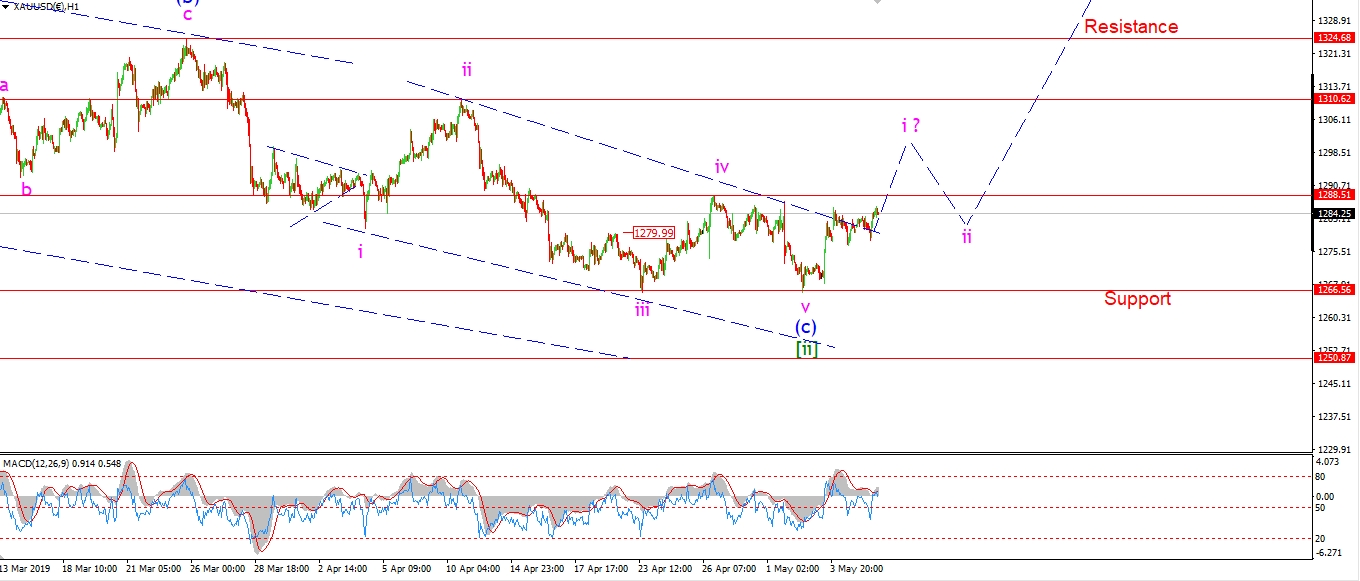 [/vc_column_text][/vc_column][vc_column width=”1/3″][vc_custom_heading text=”4 Hours” use_theme_fonts=”yes”][vc_column_text]
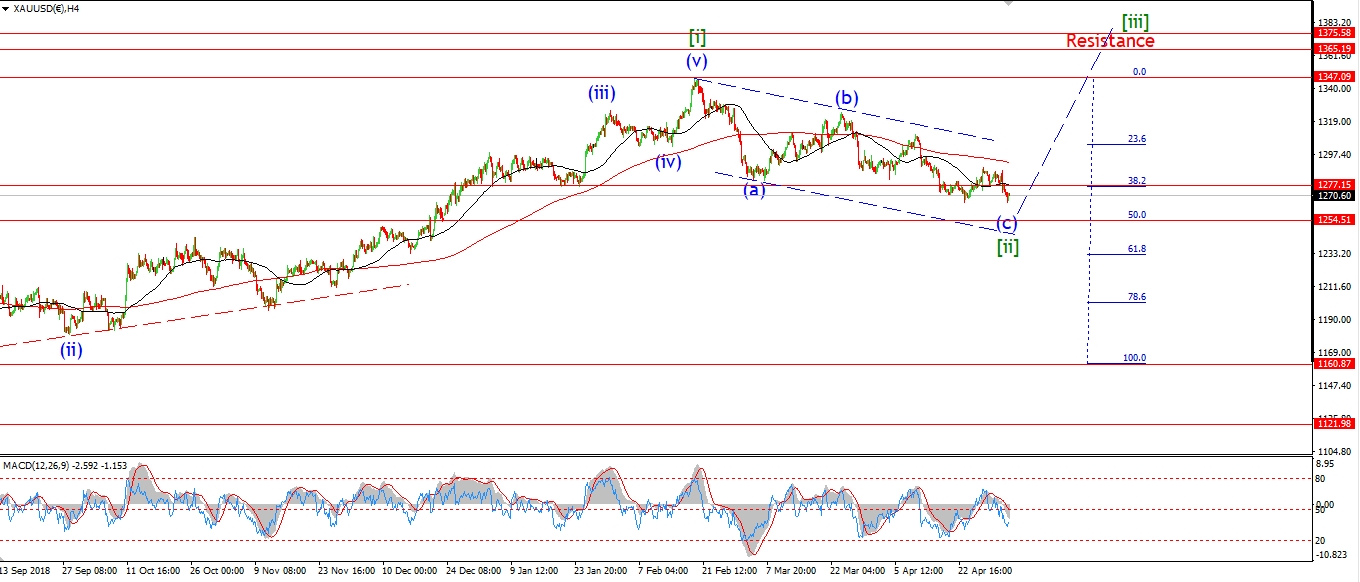 [/vc_column_text][vc_custom_heading text=”Daily” use_theme_fonts=”yes”][vc_column_text]
 [/vc_column_text][/vc_column][/vc_row]
[vc_row][vc_column][vc_column_text]
Gold is up slightly again today
as part of a five wave move higher in wave ‘i’.
I would like to see a break of 1288 at a minimum in wave ‘i’.
And a break of 1310 will signal that the turn up into wave [iii] has begun.
The recent COT data does indicate that this market is severely oversold at this point.
When the opposite sides of the market reach a similar net position,
it means the recent trend has exhausted itself.
And the price should snap back the other way.
Tomorrow;
When we get a break of those initial resistance levels in a five wave move,
and then a corrective higher low above 1256.66
that will be the bullish signal I’m looking for.
Watch for wave ‘i’ to continue higher tomorrow.
[/vc_column_text][/vc_column][/vc_row]
[/_s2If]
[_s2If current_user_can(access_s2member_ccap_crude)]
[vc_row][vc_column][vc_separator border_width=”5″][/vc_column][/vc_row][vc_row][vc_column][vc_column_text]
U.S CRUDE OIL
[/vc_column_text][/vc_column][/vc_row][vc_row][vc_column][vc_separator border_width=”5″][/vc_column][/vc_row][vc_row][vc_column width=”2/3″][vc_custom_heading text=”1 hr” use_theme_fonts=”yes”][vc_column_text]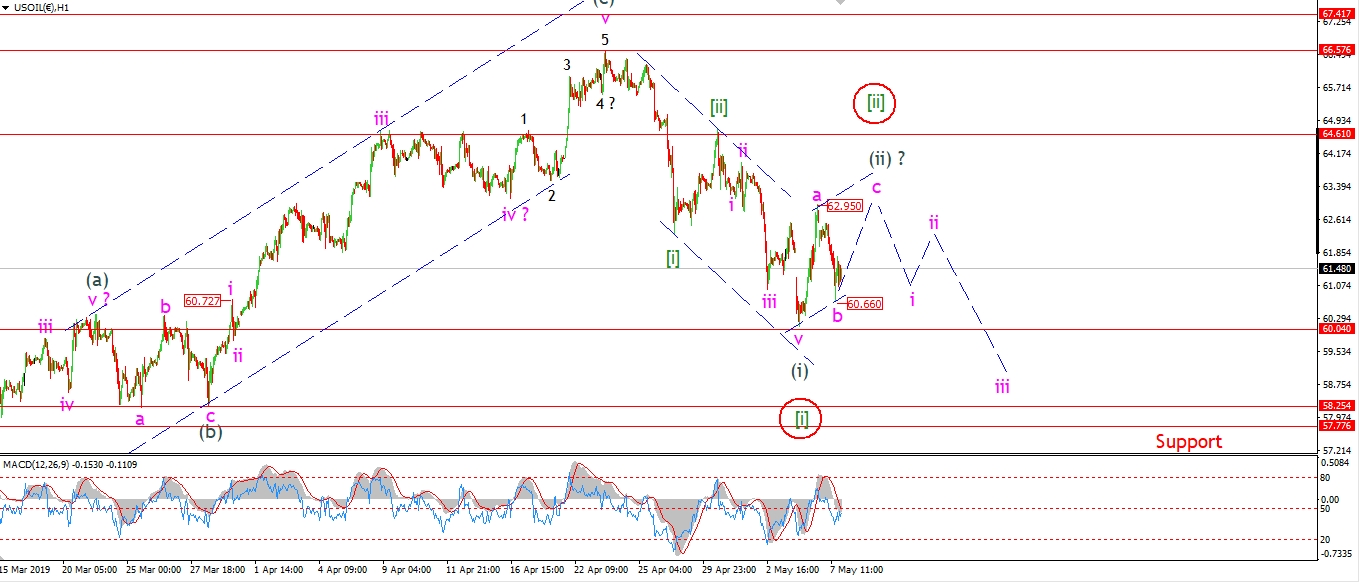 [/vc_column_text][/vc_column][vc_column width=”1/3″][vc_custom_heading text=”4 Hours” use_theme_fonts=”yes”][vc_column_text]
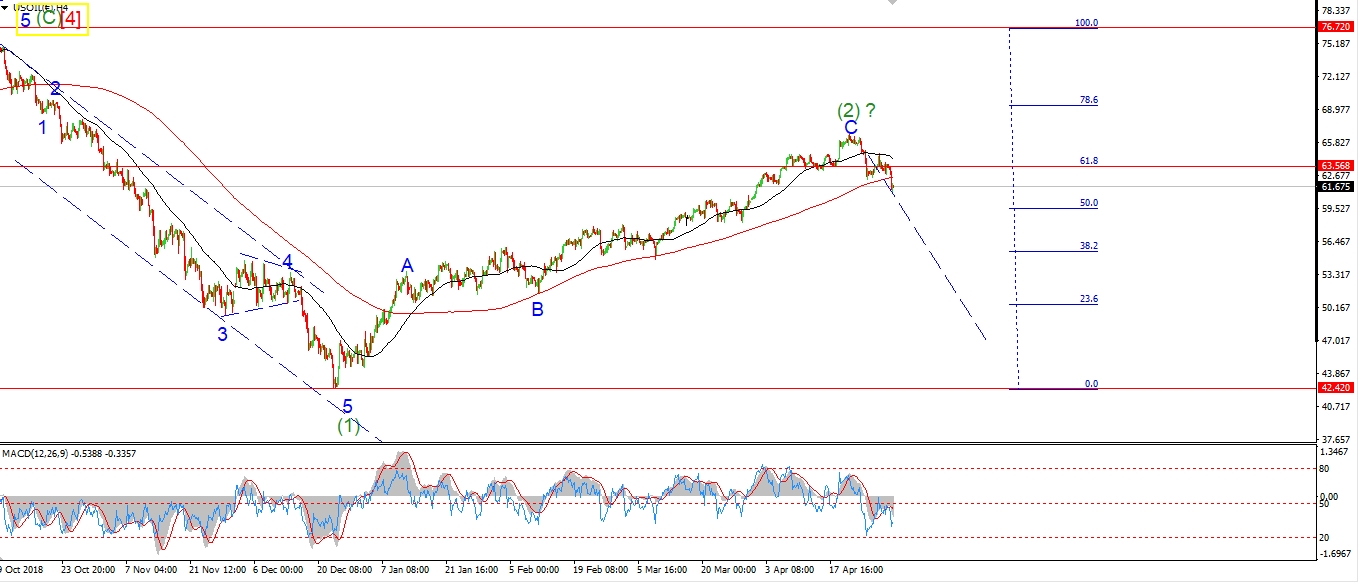 [/vc_column_text][vc_custom_heading text=”Daily” use_theme_fonts=”yes”][vc_column_text]
 [/vc_column_text][/vc_column][/vc_row]
[vc_row][vc_column][vc_column_text]
Crude has dropped today in a three wave form off the wave ‘a’ high.
This is labelled wave ‘b’ of (ii) at todays lows of 60.66.
The price has risen off the low at wave ‘b’ this evening
which indicates that wave ‘b’ is now complete.
And this should be followed by another rally in wave ‘c’ above 62.95,
to complete a three wave correction in wave (ii).
Tomorrow;
If the market continues lower to break 60.00 again,
that will signal wave (iii) has begun.
Watch for wave ‘c’ of (ii) to complete a three wave correction above 62.95.
[/vc_column_text][/vc_column][/vc_row]
[/_s2If]
[_s2If current_user_can(access_s2member_ccap_us10yr)]
[vc_row][vc_column][vc_separator border_width=”5″][/vc_column][/vc_row][vc_row][vc_column][vc_column_text]
US 10 yr Treasuries.
[/vc_column_text][/vc_column][/vc_row][vc_row][vc_column][vc_separator border_width=”5″][/vc_column][/vc_row][vc_row][vc_column width=”2/3″][vc_custom_heading text=”1 hr” use_theme_fonts=”yes”][vc_column_text]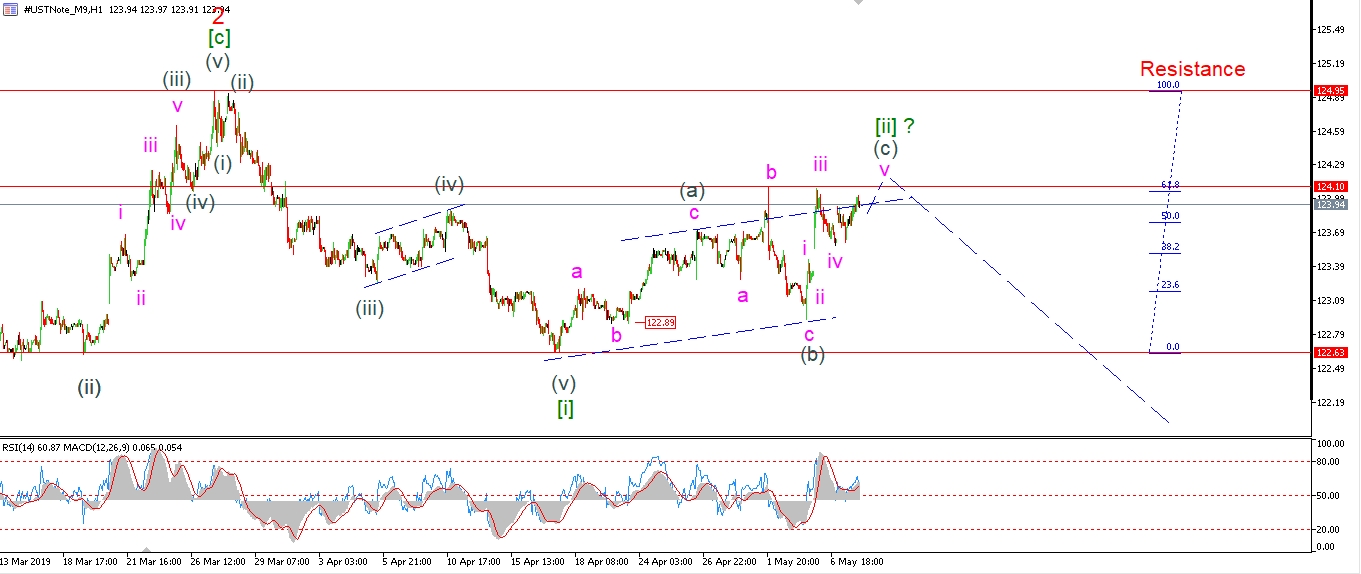 [/vc_column_text][/vc_column][vc_column width=”1/3″][vc_custom_heading text=”4 Hours” use_theme_fonts=”yes”][vc_column_text]
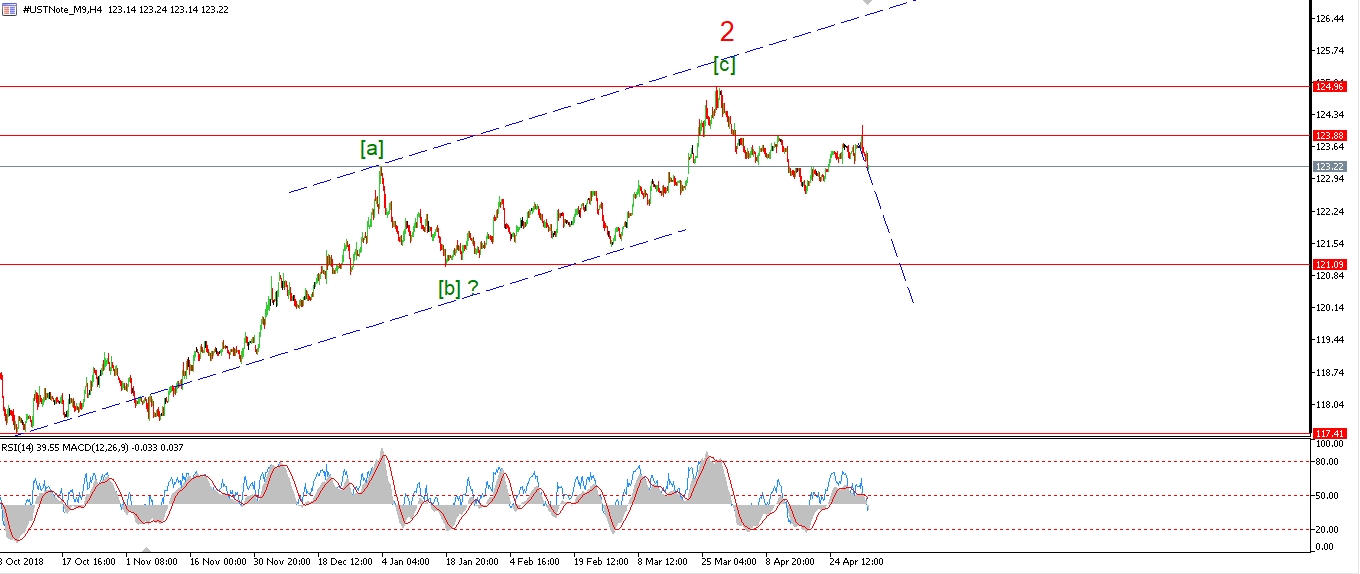 [/vc_column_text][vc_custom_heading text=”Daily” use_theme_fonts=”yes”][vc_column_text]
 [/vc_column_text][/vc_column][/vc_row]
[vc_row][vc_column][vc_column_text]
Wave [ii] is coming to an end now
and I think the price is moving through the last few minor waves in wave (c) to complete the correction.
Wave (c) has not yet broken to a new high above 124.10.
Although that should happen in wave ‘v’ of (c).
The 10YR should then return lower again to begin wave [iii] by the end of this week.
Wave [iii] of ‘3’ down should push the price back down below 120.00 again.
Tomorrow;
Watch for a final high in wave (c) of [ii] with a break of 124.10.
[/vc_column_text][/vc_column][/vc_row]
[/_s2If]
[_s2If current_user_can(access_s2member_ccap_silver)]
[vc_row][vc_column][vc_separator border_width=”5″][/vc_column][/vc_row][vc_row][vc_column][vc_column_text]
SILVER
[/vc_column_text][/vc_column][/vc_row][vc_row][vc_column][vc_separator border_width=”5″][/vc_column][/vc_row][vc_row][vc_column width=”2/3″][vc_custom_heading text=”1 hr” use_theme_fonts=”yes”][vc_column_text]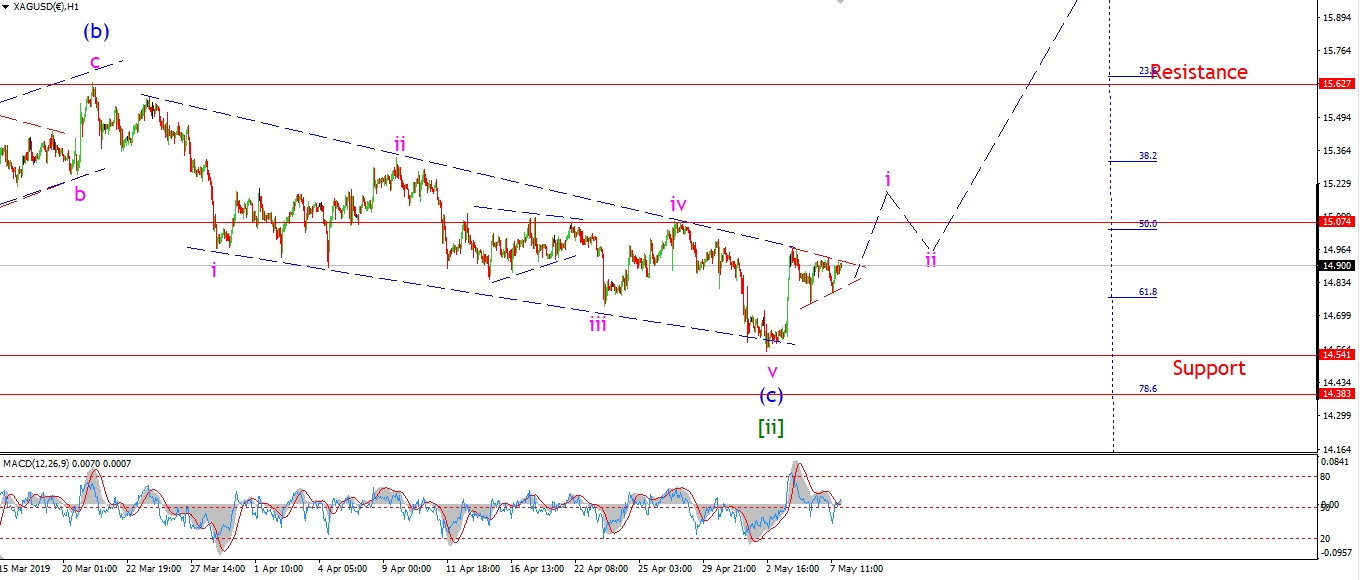 [/vc_column_text][/vc_column][vc_column width=”1/3″][vc_custom_heading text=”4 Hours” use_theme_fonts=”yes”][vc_column_text]
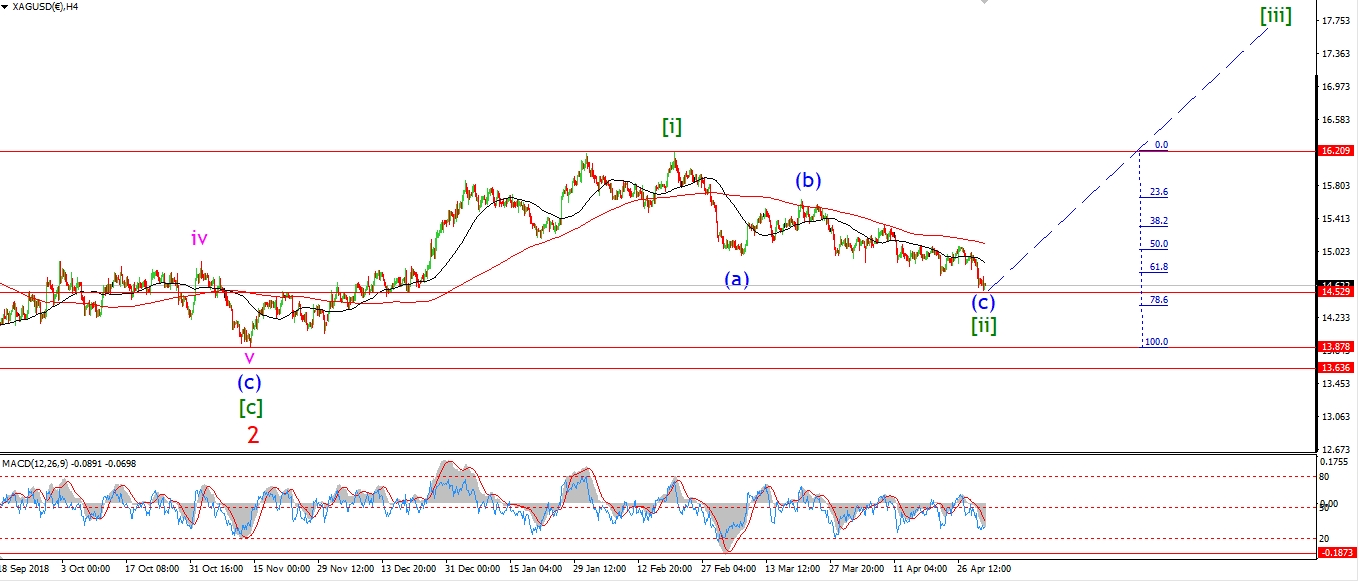 [/vc_column_text][vc_custom_heading text=”Daily” use_theme_fonts=”yes”][vc_column_text]
 [/vc_column_text][/vc_column][/vc_row]
[vc_row][vc_column][vc_column_text]
Silver is correcting in a possible fourth wave triangle this evening.
The price range is tightening around 14.85,
one more higher low will complete a triangle
and then a final move higher above 15.07 will complete wave ‘i’ pink.
wave ‘ii’ should create a larger higher low and set us up for a rally to begin wave (i) of [iii].
Tomorrow;
Price should hold above 14.60 from now on even as wave ‘ii’ completes.
Watch for this triangle to complete with a push above 15.07 again.
[/vc_column_text][/vc_column][/vc_row]
[/_s2If]
[_s2If current_user_can(access_s2member_ccap_sp500)]
[vc_row][vc_column][vc_separator border_width=”5″][/vc_column][/vc_row][vc_row][vc_column][vc_column_text]
S&P 500.
[/vc_column_text][/vc_column][/vc_row][vc_row][vc_column][vc_separator border_width=”5″][/vc_column][/vc_row][vc_row][vc_column width=”2/3″][vc_custom_heading text=”1 hr” use_theme_fonts=”yes”][vc_column_text]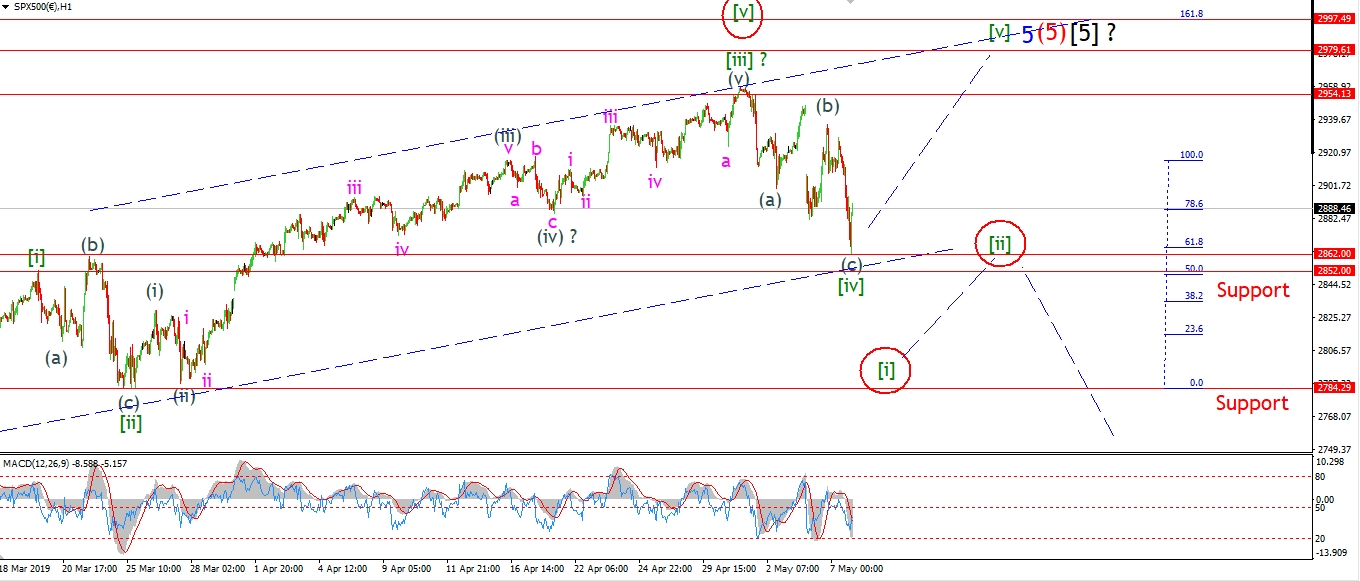 [/vc_column_text][/vc_column][vc_column width=”1/3″][vc_custom_heading text=”4 Hours” use_theme_fonts=”yes”][vc_column_text]
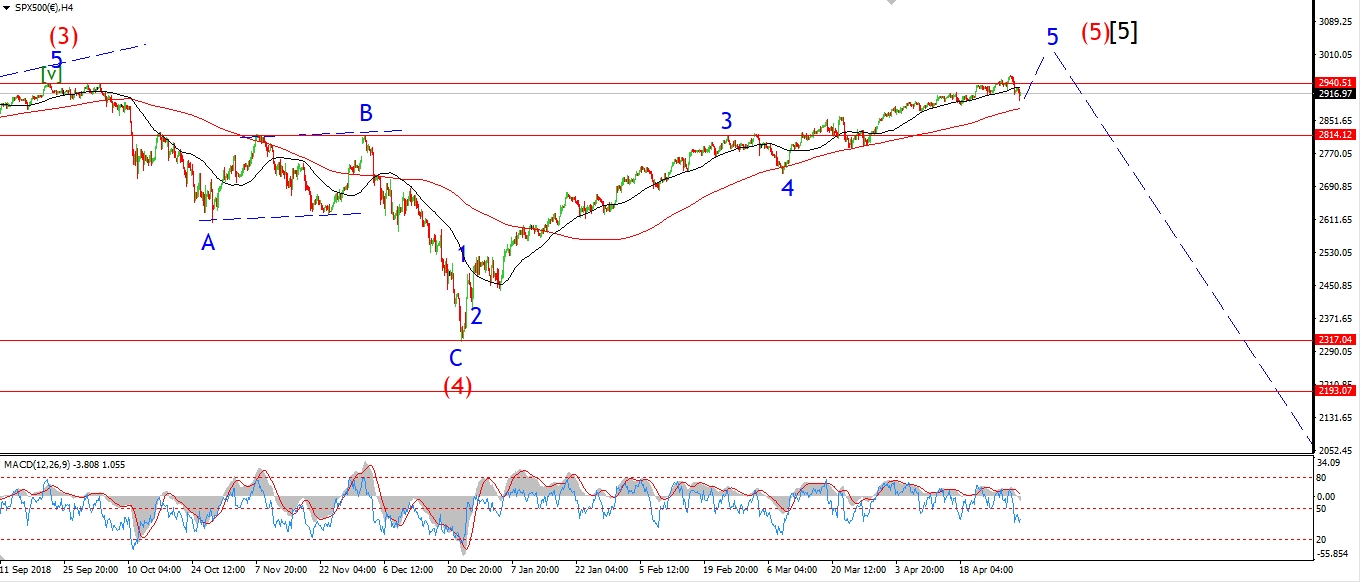 [/vc_column_text][vc_custom_heading text=”Daily” use_theme_fonts=”yes”][vc_column_text]
 [/vc_column_text][/vc_column][/vc_row]
[vc_row][vc_column][vc_column_text]
The S&P took a significant hit also today
and this calls into question the idea of a rally in wave [v] to a new high.
So far we have a three wave decline off the highs.
So this decline still counts as a correction, but I am open to this developing into a full five waves lower.
As we close this evening, the market is rallying again.
Now up 25 points off the lows.
The market hit a low at 2862 today,
so we got close to triggering the alternate count at 2852.
For now the idea of a new high in wave [v] is still in play
without having an overlap between waves [i] and [iv] in an ending diagonal.
So lets see if we get a five wave rally off the lows to begin wave [v].
Tomorrow;
Watch for 2862 to hold and wave [v] begin.
A break of 2937 will confirm that wave [v] has begun.
[/vc_column_text][/vc_column][/vc_row]
[/_s2If]
[vc_row][vc_column][vc_column_text]
[/vc_column_text][/vc_column][/vc_row]
[vc_row][vc_column][vc_separator border_width=”5″][/vc_column][/vc_row]