
[vc_row][vc_column][vc_separator border_width=”5″][/vc_column][/vc_row]
[vc_row][vc_column][vc_column_text]
Good evening.
I always urge that you take a look at John Hussmans monthly blog post when it comes out,
so here it is:
Why a 60-65% Market Loss Would Be Run-Of-The-Mill
and again he simply knocks it out of the park.
I think his approach to full cycle analysis meshes well with Elliott in the sense that valuation is not a zero sum game.
Everything is connected to the larger cycle across history.
Todays hyper valued markets are not independent of future market valuation,
but they are infact intrinsically connected together in the cycle.
An overvalued cycle top today, ensures an undervalued cycle bottom in the future.
The trick is to know where you are in the cycle.
And boy are we in a scary place right now!
[/vc_column_text][/vc_column][/vc_row]
[_s2If current_user_can(access_s2member_ccap_eurusd)]
[vc_row][vc_column][vc_separator border_width=”5″][/vc_column][/vc_row]
[vc_row][vc_column][vc_column_text]
EURUSD
[/vc_column_text][/vc_column][/vc_row]
[vc_row][vc_column][vc_separator border_width=”5″][/vc_column][/vc_row][vc_row][vc_column width=”2/3″][vc_custom_heading text=”1 hr” use_theme_fonts=”yes”][vc_column_text]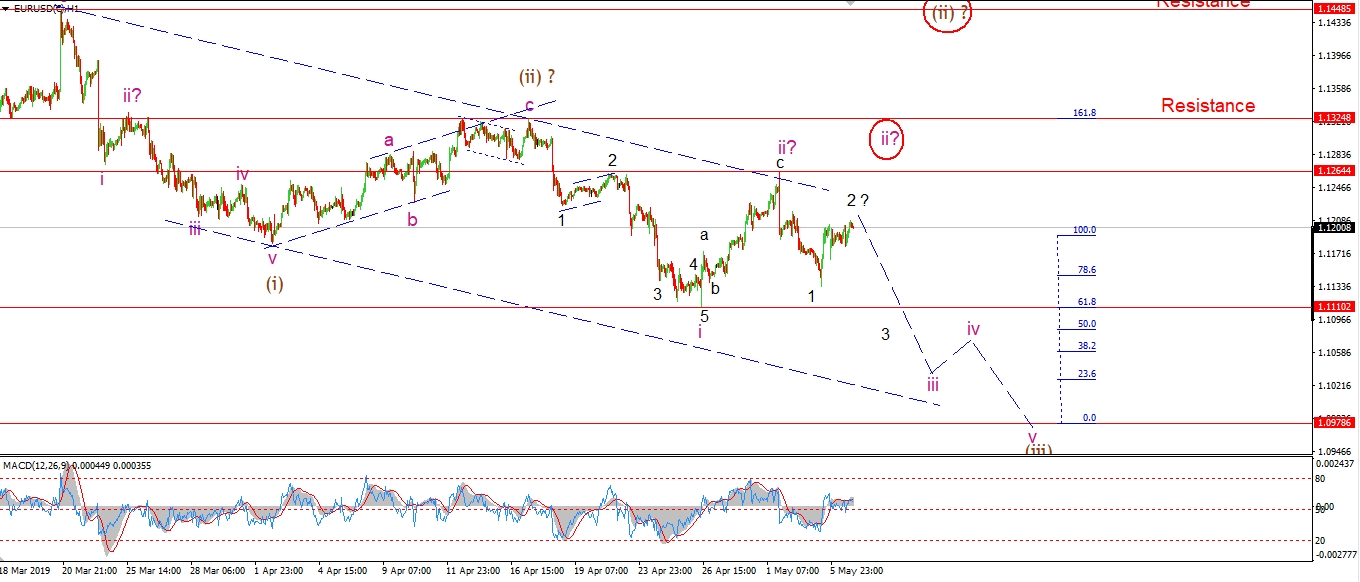 [/vc_column_text][/vc_column][vc_column width=”1/3″][vc_custom_heading text=”4 Hours” use_theme_fonts=”yes”][vc_column_text]
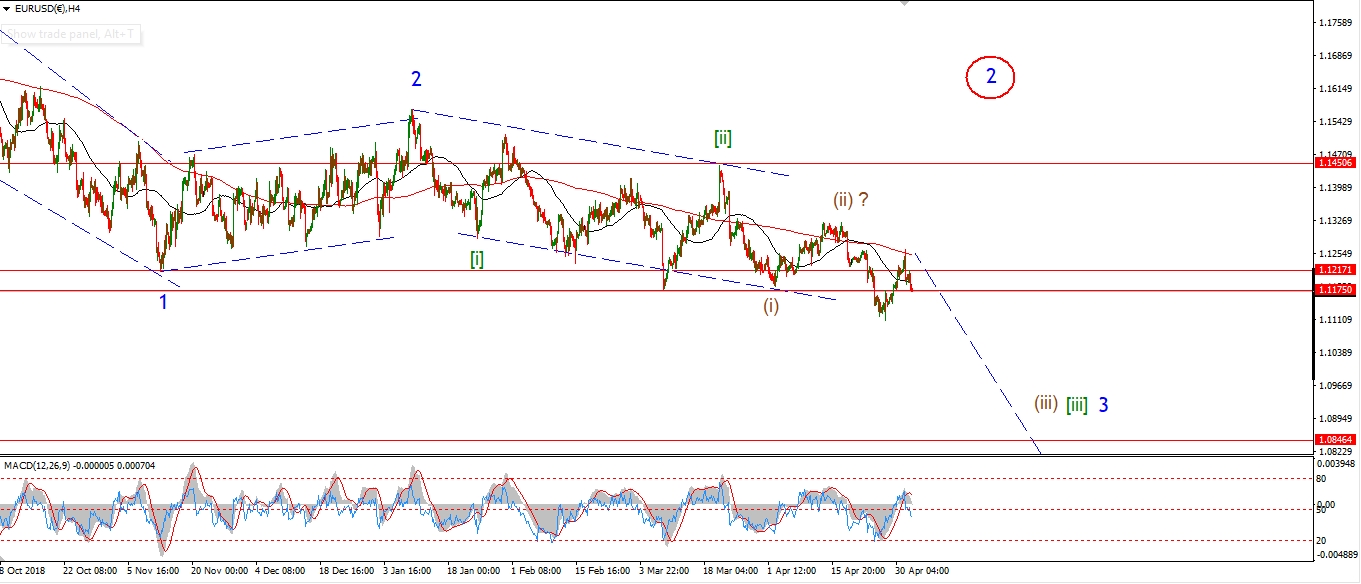 [/vc_column_text][vc_custom_heading text=”Daily” use_theme_fonts=”yes”][vc_column_text]
 [/vc_column_text][/vc_column][/vc_row]
[vc_row][vc_column][vc_column_text]
So far EURUSD is hanging below the 1.1264 level at wave ‘ii’ pink.
The rise into todays high is still labelled wave ‘2’ of ‘iii’.
and this suggests that wave ‘3’ of ‘iii’ is setup to begin.
A break of 1.1110 will confirm this count.
The alternate count showing an ongoing wave ‘ii’ pink is still valid also,
A break of 1.1264 will confirm that count,
but price must hold below 1.1324 in that scenario.
Tomorrow;
watch for wave ‘2’ to complete below 1.1264, and then begin a decline in wave ‘3’.
[/vc_column_text][/vc_column][/vc_row]
[/_s2If]
[_s2If current_user_can(access_s2member_ccap_gbpusd)]
[vc_row][vc_column][vc_separator border_width=”5″][/vc_column][/vc_row][vc_row][vc_column][vc_column_text]
GBPUSD
[/vc_column_text][/vc_column][/vc_row][vc_row][vc_column][vc_separator border_width=”5″][/vc_column][/vc_row][vc_row][vc_column width=”2/3″][vc_custom_heading text=”1 hr” use_theme_fonts=”yes”][vc_column_text]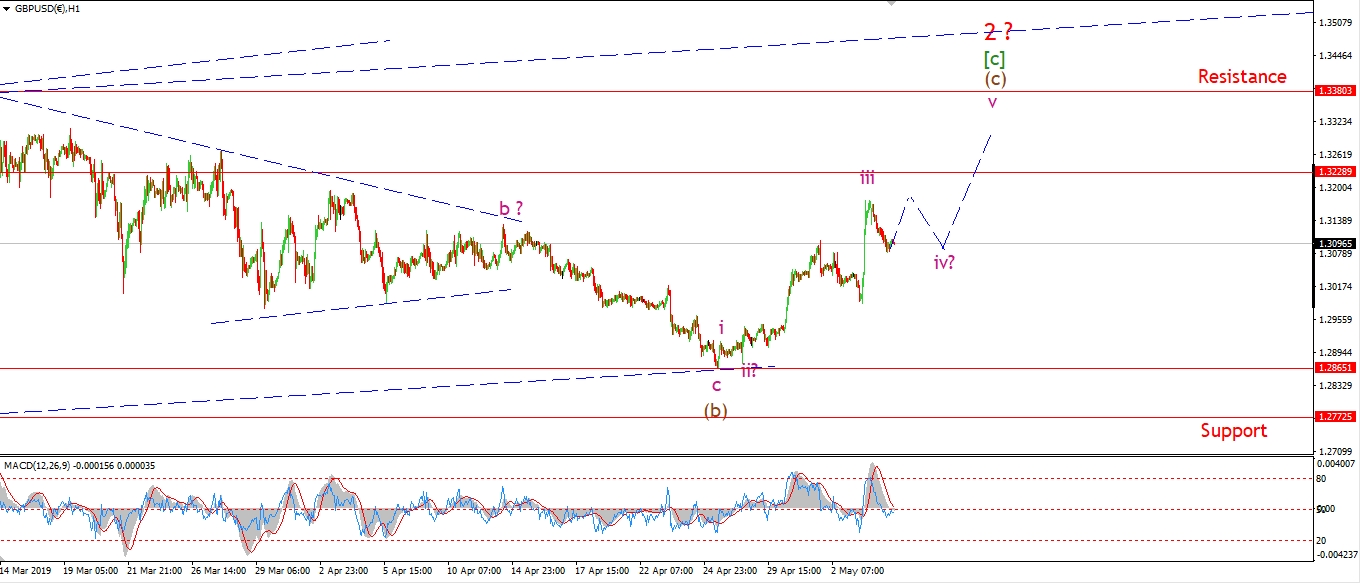 [/vc_column_text][/vc_column][vc_column width=”1/3″][vc_custom_heading text=”4 Hours” use_theme_fonts=”yes”][vc_column_text]
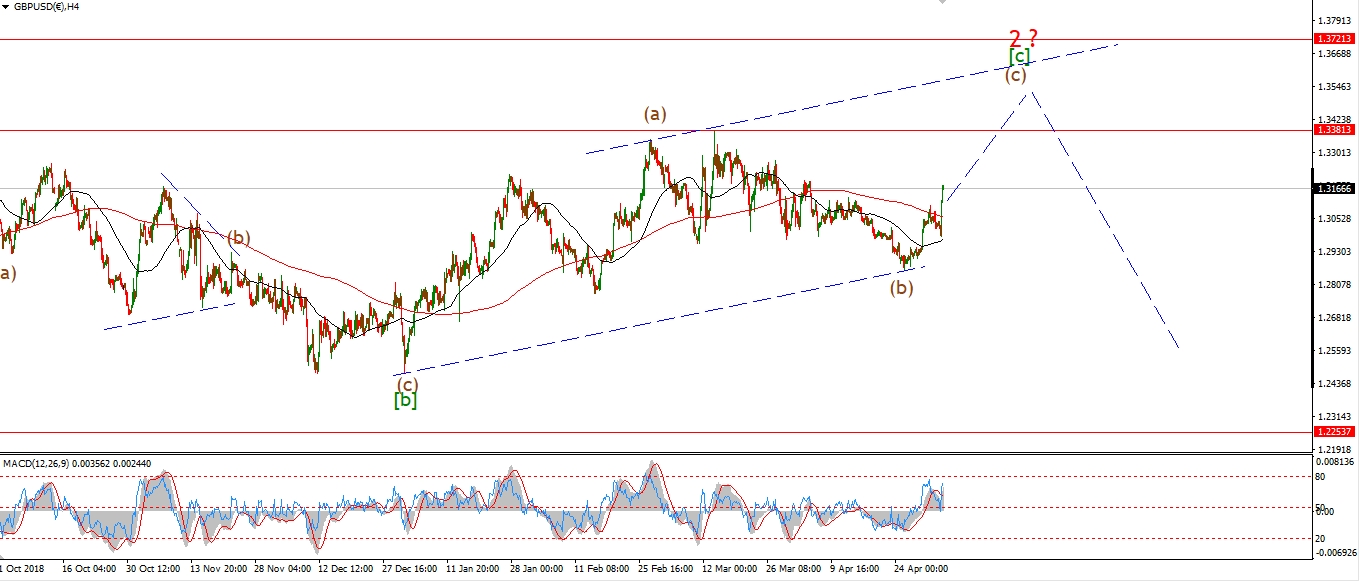 [/vc_column_text][vc_custom_heading text=”Daily” use_theme_fonts=”yes”][vc_column_text]
 [/vc_column_text][/vc_column][/vc_row]
[vc_row][vc_column][vc_column_text]
Cable has drifted off Fridays highs today,
in what should be the beginning of wave ‘iv’ pink as shown on the short term chart.
The new wave count calls for a five wave move up to resistance at about 1.3380.
This will complete a five wave move in wave (c).
That move should close out the larger wave ‘2’,
and create the setup for a turn down into wave ‘3’.
Tomorrow;
Wave ‘iv’ is not complete just yet.
Watch for a three wave pattern in wave ‘iv’ over the next day or so,
followed by a rally in wave ‘v’ of (c).
[/vc_column_text][/vc_column][/vc_row]
[/_s2If]
[_s2If current_user_can(access_s2member_ccap_usdjpy)]
[vc_row][vc_column][vc_separator border_width=”5″][/vc_column][/vc_row][vc_row][vc_column][vc_column_text]
USDJPY
[/vc_column_text][/vc_column][/vc_row][vc_row][vc_column][vc_separator border_width=”5″][/vc_column][/vc_row][vc_row][vc_column width=”2/3″][vc_custom_heading text=”1 hr” use_theme_fonts=”yes”][vc_column_text] [/vc_column_text][/vc_column][vc_column width=”1/3″][vc_custom_heading text=”4 Hours” use_theme_fonts=”yes”][vc_column_text]
 [/vc_column_text][vc_custom_heading text=”Daily” use_theme_fonts=”yes”][vc_column_text]
 [/vc_column_text][/vc_column][/vc_row]
[vc_row][vc_column][vc_column_text]
USDJPY got slammed this morning after the president decided it was a good idea to tweet about trade again.
I do wonder sometimes,
but I suppose he never claimed to be a statesman!
Price reached the 78.6% retracement level at 110.28,
and then rebounded off the lows again.
So we should see an end to wave (ii) now.
over the coming days I will be looking for a new 5 wave rally to indicate that wave (iii) up is beginning.
Tomorrow;
Watch for a push back above 111.67 in wave ‘i’ of (iii).
[/vc_column_text][/vc_column][/vc_row]
[/_s2If]
[_s2If current_user_can(access_s2member_ccap_dow_jones)]
[vc_row][vc_column][vc_separator border_width=”5″][/vc_column][/vc_row][vc_row][vc_column][vc_column_text]
DOW JONES INDUSTRIALS
[/vc_column_text][/vc_column][/vc_row][vc_row][vc_column][vc_separator border_width=”5″][/vc_column][/vc_row][vc_row][vc_column width=”2/3″][vc_custom_heading text=”1 hr” use_theme_fonts=”yes”][vc_column_text]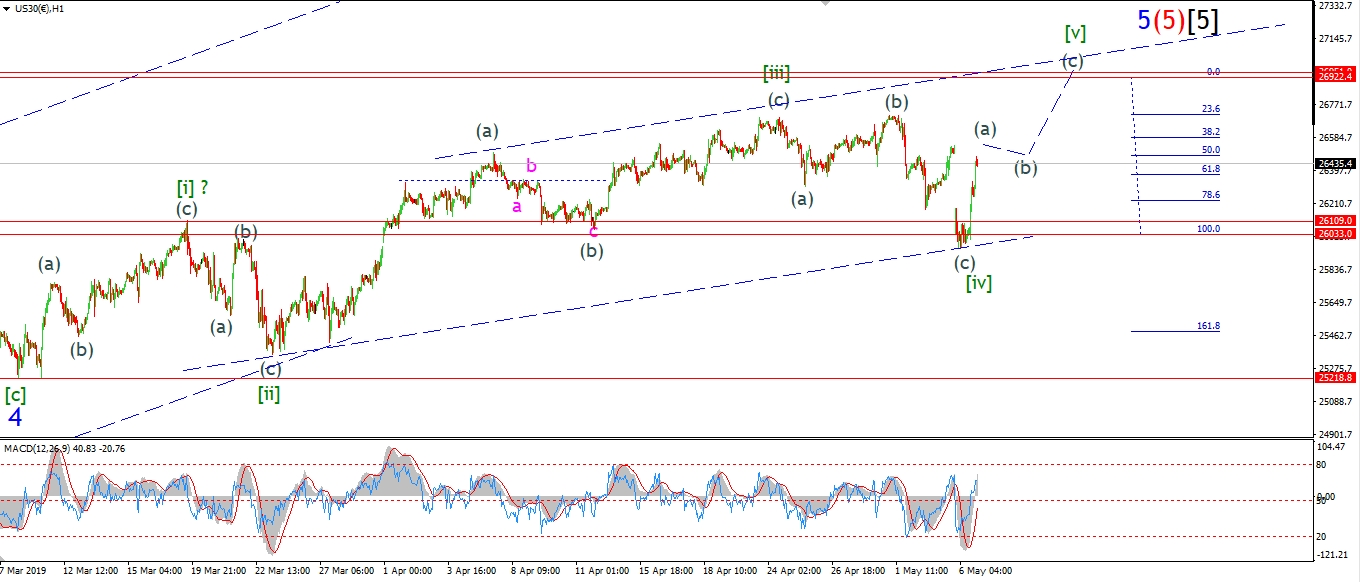 [/vc_column_text][/vc_column][vc_column width=”1/3″][vc_custom_heading text=”4 Hours” use_theme_fonts=”yes”][vc_column_text]
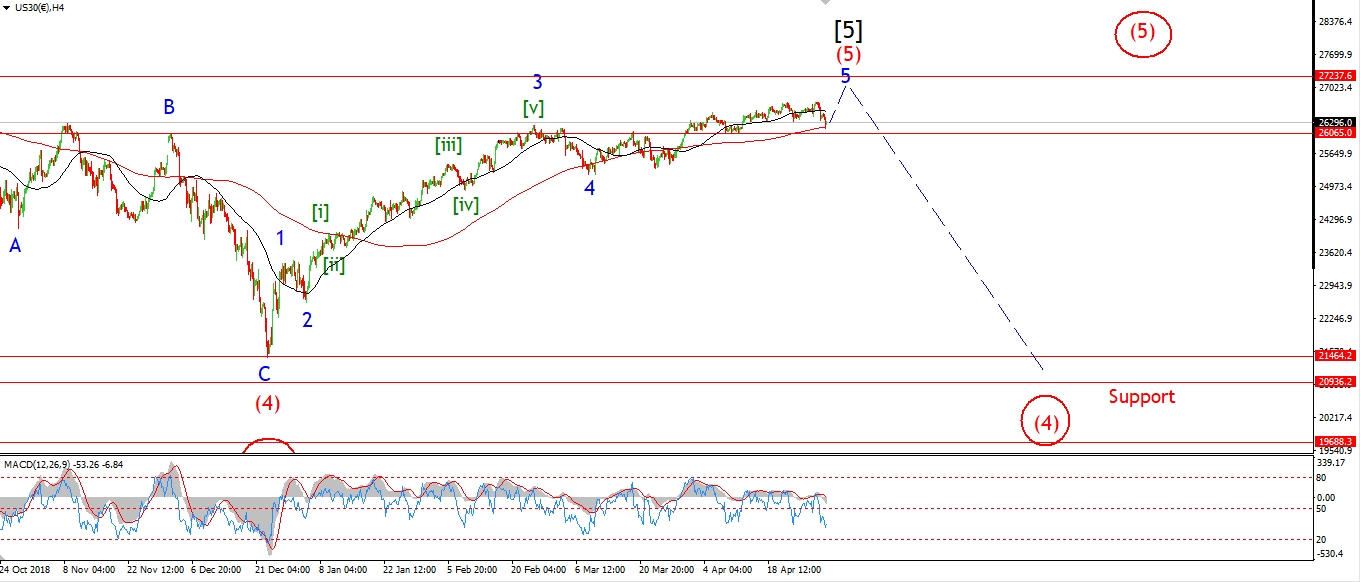 [/vc_column_text][vc_custom_heading text=”Daily” use_theme_fonts=”yes”][vc_column_text]
 [/vc_column_text][/vc_column][/vc_row]
[vc_row][vc_column][vc_column_text]
Stocks were hit hard also this morning.
The Dow opened 500 points lower to extend the correction in wave [iv] green.
The low of the session reached 26033,
this overlapped the previous wave [i] high at 26109.
So now we have a dilemma!
The only way the market reaches a new high to complete wave ‘5’,
is if the price is tracing out an ending diagonal now.
this pattern would allow for an overlap of wave [i] and [iv].
And still reach a new high in wave [v] above 26951.
Wave [v] would reach equality with wave [i] at 26922,
so we would need to see a break of that upper trend channel in a three wave form to complete this pattern.
Tomorrow;
Watch for wave [v] to continue higher in a three wave structure
and possible complete at a new high this week.
[/vc_column_text][/vc_column][/vc_row]
[/_s2If]
[_s2If current_user_can(access_s2member_ccap_gold)]
[vc_row][vc_column][vc_separator border_width=”5″][/vc_column][/vc_row][vc_row][vc_column][vc_column_text]
GOLD
[/vc_column_text][/vc_column][/vc_row][vc_row][vc_column][vc_separator border_width=”5″][/vc_column][/vc_row][vc_row][vc_column width=”2/3″][vc_custom_heading text=”1 hr” use_theme_fonts=”yes”][vc_column_text] [/vc_column_text][/vc_column][vc_column width=”1/3″][vc_custom_heading text=”4 Hours” use_theme_fonts=”yes”][vc_column_text]
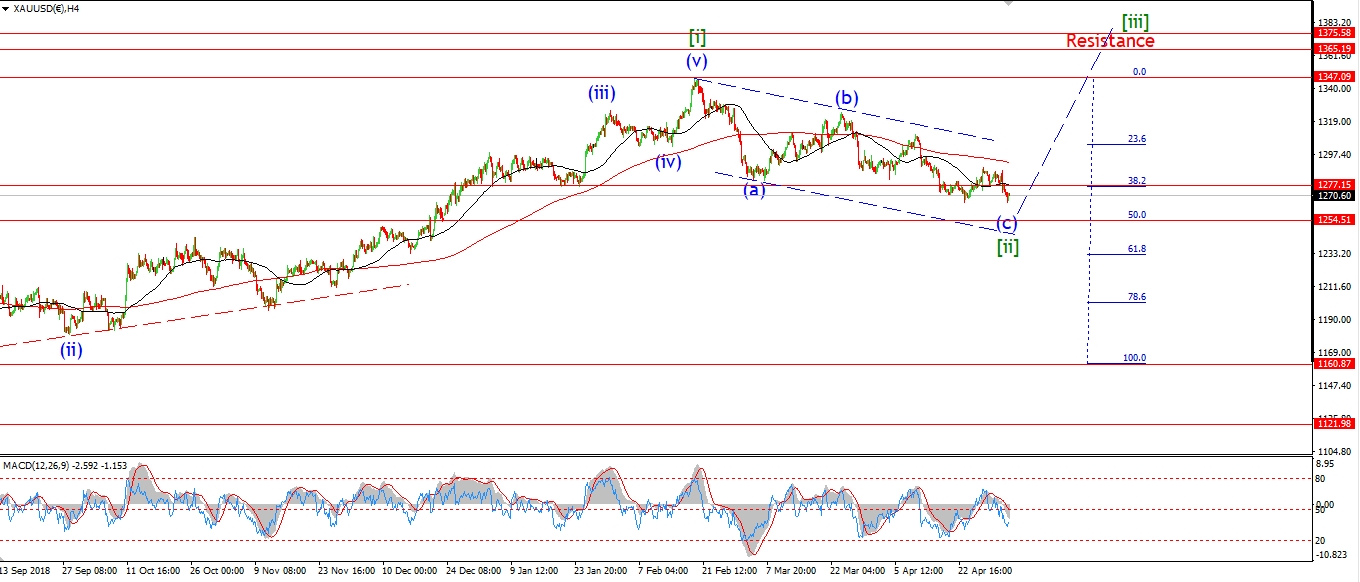 [/vc_column_text][vc_custom_heading text=”Daily” use_theme_fonts=”yes”][vc_column_text]
 [/vc_column_text][/vc_column][/vc_row]
[vc_row][vc_column][vc_column_text]
Gold is pretty flat today in a possible corrective form,
this would be a small fourth wave within a new five wave move higher off the recent low.
If we see a push back towards 1300 again this week in a clear five wave form,
that will be a good sign that the market is shifting to the upside again.
The recent COT data suggests an overwhelmingly bearish sentiment in gold at the moment.
So that setup alone should allow the market to rally.
We will see if this develops impulsively into a five wave structure or not.
Tomorrow;
Watch for 1266.56 to hold and wave ‘i’ to continue higher.
[/vc_column_text][/vc_column][/vc_row]
[/_s2If]
[_s2If current_user_can(access_s2member_ccap_crude)]
[vc_row][vc_column][vc_separator border_width=”5″][/vc_column][/vc_row][vc_row][vc_column][vc_column_text]
U.S CRUDE OIL
[/vc_column_text][/vc_column][/vc_row][vc_row][vc_column][vc_separator border_width=”5″][/vc_column][/vc_row][vc_row][vc_column width=”2/3″][vc_custom_heading text=”1 hr” use_theme_fonts=”yes”][vc_column_text]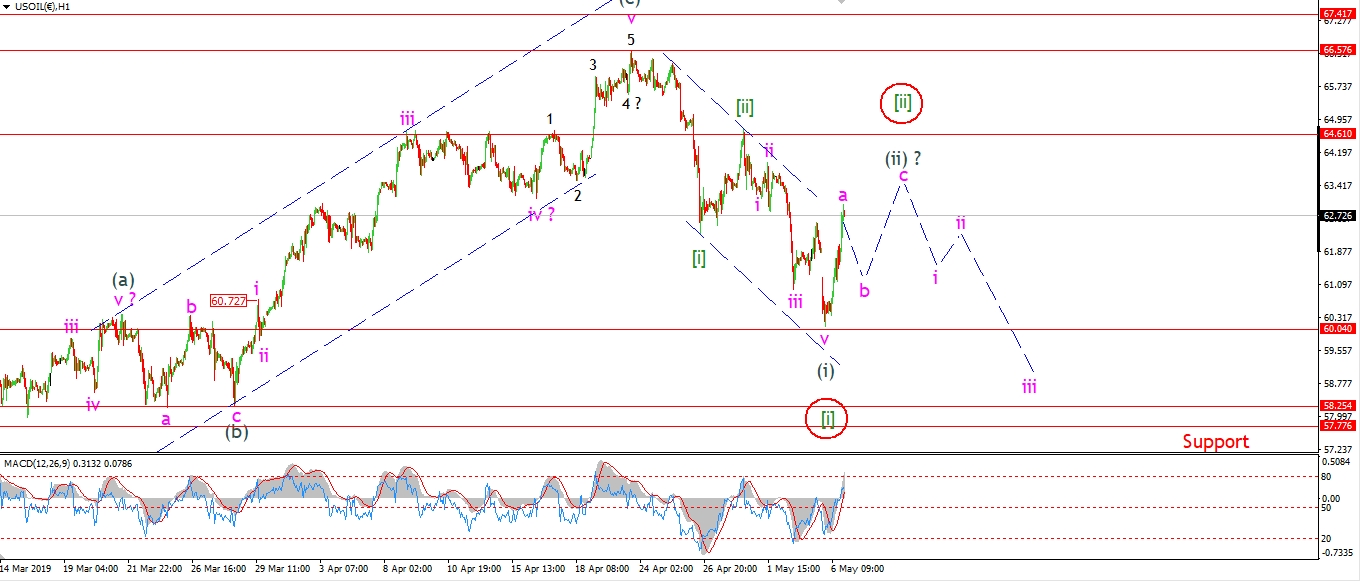 [/vc_column_text][/vc_column][vc_column width=”1/3″][vc_custom_heading text=”4 Hours” use_theme_fonts=”yes”][vc_column_text]
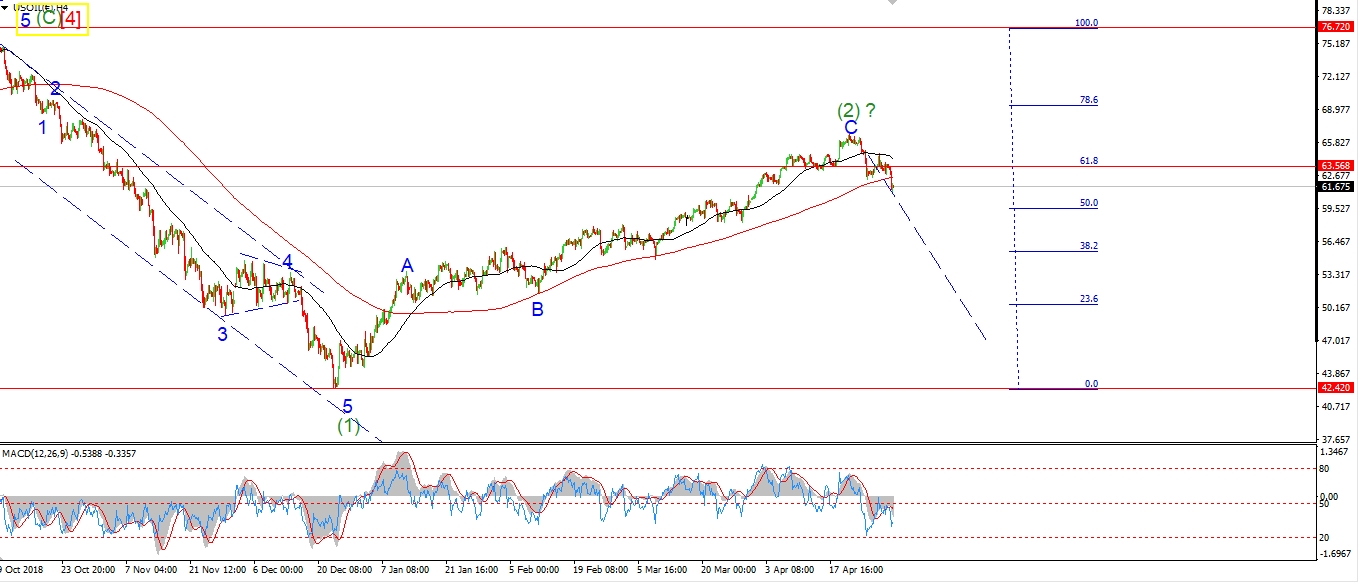 [/vc_column_text][vc_custom_heading text=”Daily” use_theme_fonts=”yes”][vc_column_text]
 [/vc_column_text][/vc_column][/vc_row]
[vc_row][vc_column][vc_column_text]
Crude gaped lower overnight,
this completes a five wave move lower off last weeks high.
The market has rebounded strongly off that low at 60.04 up 285 points at the close.
The strong rally suggests a slightly different wave count.
So I have moved up the main count by one degree,
and changed the alternate count also.
Both wave count view todays rally as part of a second wave rally.
The price should trace out a three wave rally in wave (ii) or wave [ii] over the coning days.
And then we should head lower again in a third wave.
Tomorrow;
watch for wave ‘a’ of (ii) to complete and wave ‘b’ to carry the price lower.
Wave ‘b’ should complete above 60.04 tomorrow.
[/vc_column_text][/vc_column][/vc_row]
[/_s2If]
[_s2If current_user_can(access_s2member_ccap_us10yr)]
[vc_row][vc_column][vc_separator border_width=”5″][/vc_column][/vc_row][vc_row][vc_column][vc_column_text]
US 10 yr Treasuries.
[/vc_column_text][/vc_column][/vc_row][vc_row][vc_column][vc_separator border_width=”5″][/vc_column][/vc_row][vc_row][vc_column width=”2/3″][vc_custom_heading text=”1 hr” use_theme_fonts=”yes”][vc_column_text]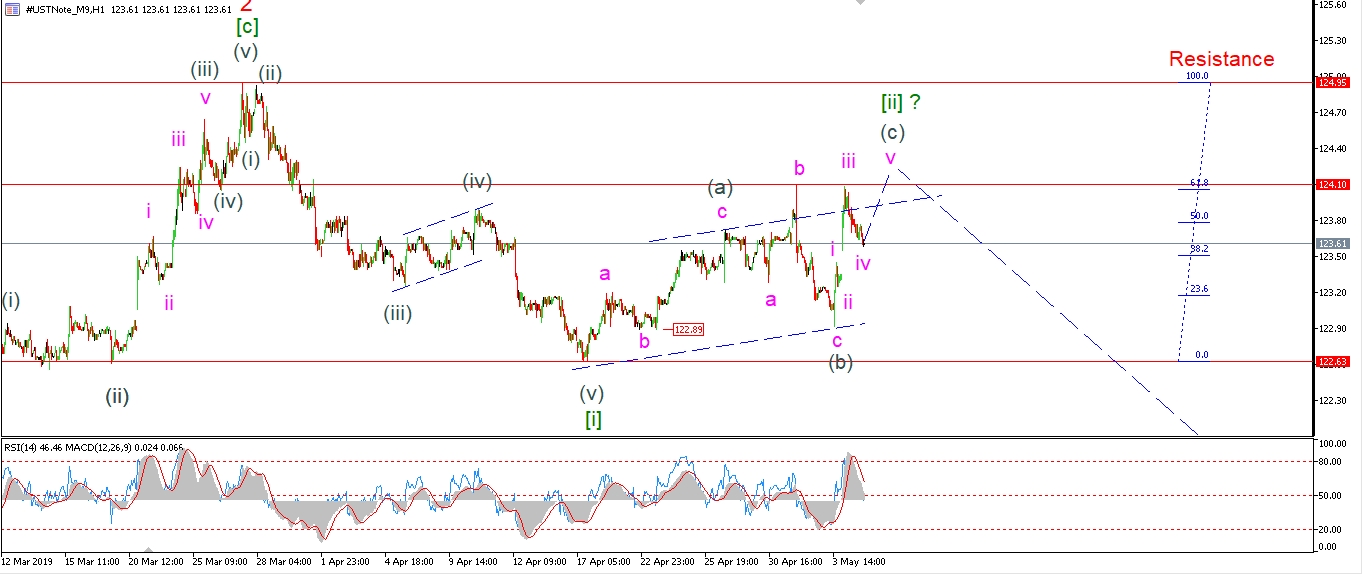 [/vc_column_text][/vc_column][vc_column width=”1/3″][vc_custom_heading text=”4 Hours” use_theme_fonts=”yes”][vc_column_text]
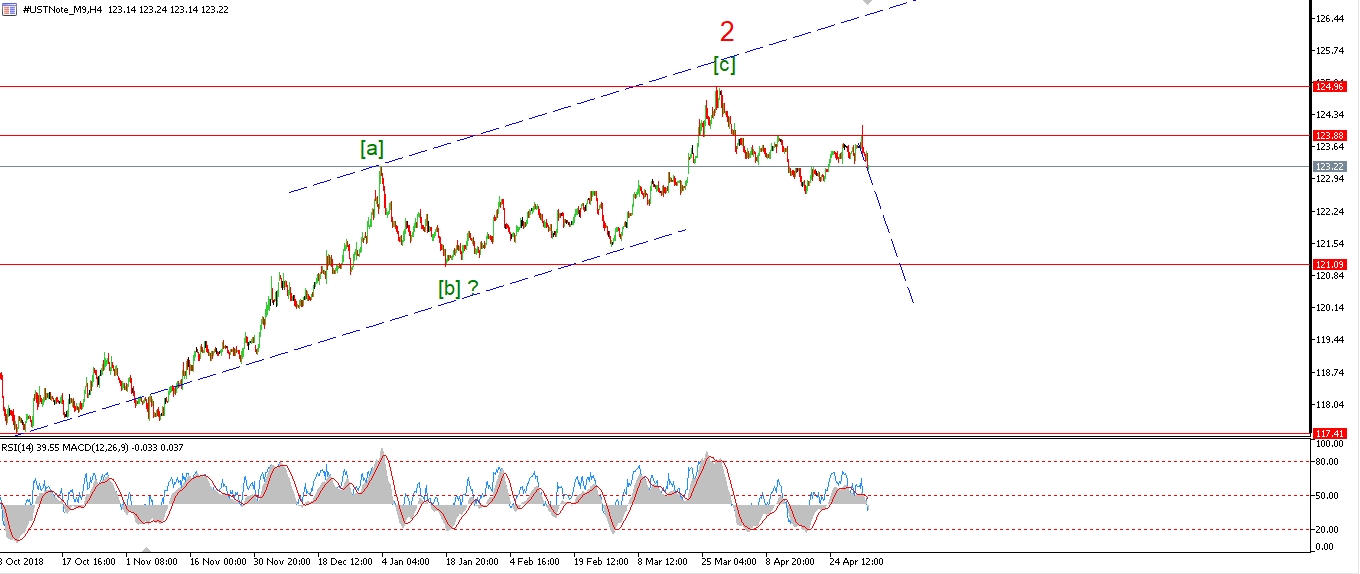 [/vc_column_text][vc_custom_heading text=”Daily” use_theme_fonts=”yes”][vc_column_text]
 [/vc_column_text][/vc_column][/vc_row]
[vc_row][vc_column][vc_column_text]
The market jitters this morning sent the 10YR higher which ruled out the short term pattern shown last week.
I still think this is a second wave correction.
It has all the hallmarks of a correction in terms of action and internal wave count.
So this new wave count labels this rally as wave (c) of [ii].
This count is one degree higher than last weeks,
and wave [ii] is viewed as a complex flat.
A 3,3,5 structure as per usual,
but an expanded flat in wave (b).
Wave (c) should complete in five waves as normal and then turn lower into wave [iii].
Tomorrow;
Watch for wave ‘v’ of (c) to make a slight new high and above 124.10.
We should see wave [iii] down begin this week.
[/vc_column_text][/vc_column][/vc_row]
[/_s2If]
[_s2If current_user_can(access_s2member_ccap_silver)]
[vc_row][vc_column][vc_separator border_width=”5″][/vc_column][/vc_row][vc_row][vc_column][vc_column_text]
SILVER
[/vc_column_text][/vc_column][/vc_row][vc_row][vc_column][vc_separator border_width=”5″][/vc_column][/vc_row][vc_row][vc_column width=”2/3″][vc_custom_heading text=”1 hr” use_theme_fonts=”yes”][vc_column_text]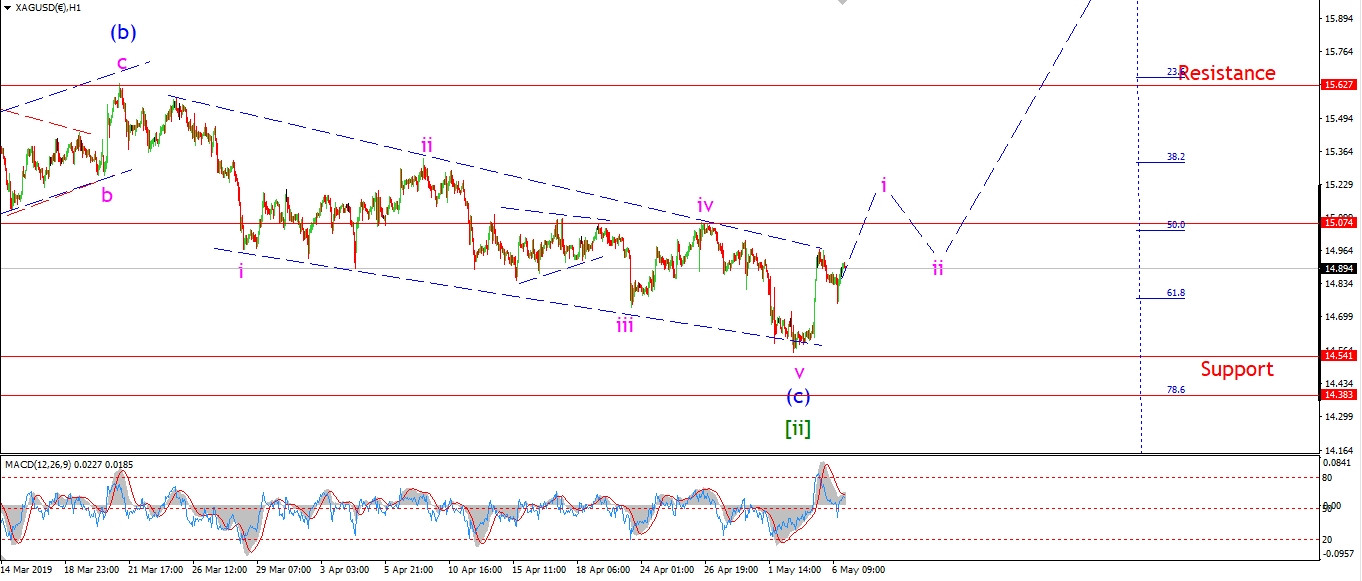 [/vc_column_text][/vc_column][vc_column width=”1/3″][vc_custom_heading text=”4 Hours” use_theme_fonts=”yes”][vc_column_text]
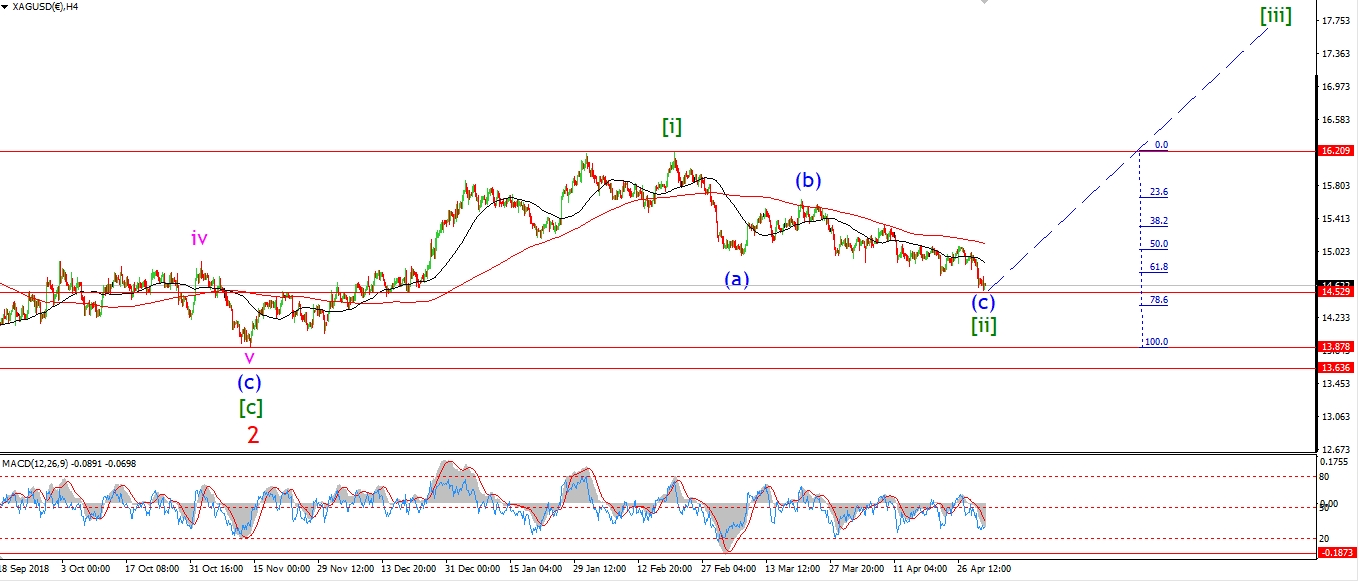 [/vc_column_text][vc_custom_heading text=”Daily” use_theme_fonts=”yes”][vc_column_text]
 [/vc_column_text][/vc_column][/vc_row]
[vc_row][vc_column][vc_column_text]
Silver is gaining again as we reach the close this evening.
This is a vote in favor of the bullish setup in wave ‘i’.
todays decline is viewed as a fourth wave correction within wave ‘i’.
With wave ‘i’ pink expected to break above 1507 in five waves this week.
Tomorrow;
Watch for wave price to hold above 14.54 and continue above 15.00 again to complete wave ‘i’.
[/vc_column_text][/vc_column][/vc_row]
[/_s2If]
[_s2If current_user_can(access_s2member_ccap_sp500)]
[vc_row][vc_column][vc_separator border_width=”5″][/vc_column][/vc_row][vc_row][vc_column][vc_column_text]
S&P 500.
[/vc_column_text][/vc_column][/vc_row][vc_row][vc_column][vc_separator border_width=”5″][/vc_column][/vc_row][vc_row][vc_column width=”2/3″][vc_custom_heading text=”1 hr” use_theme_fonts=”yes”][vc_column_text]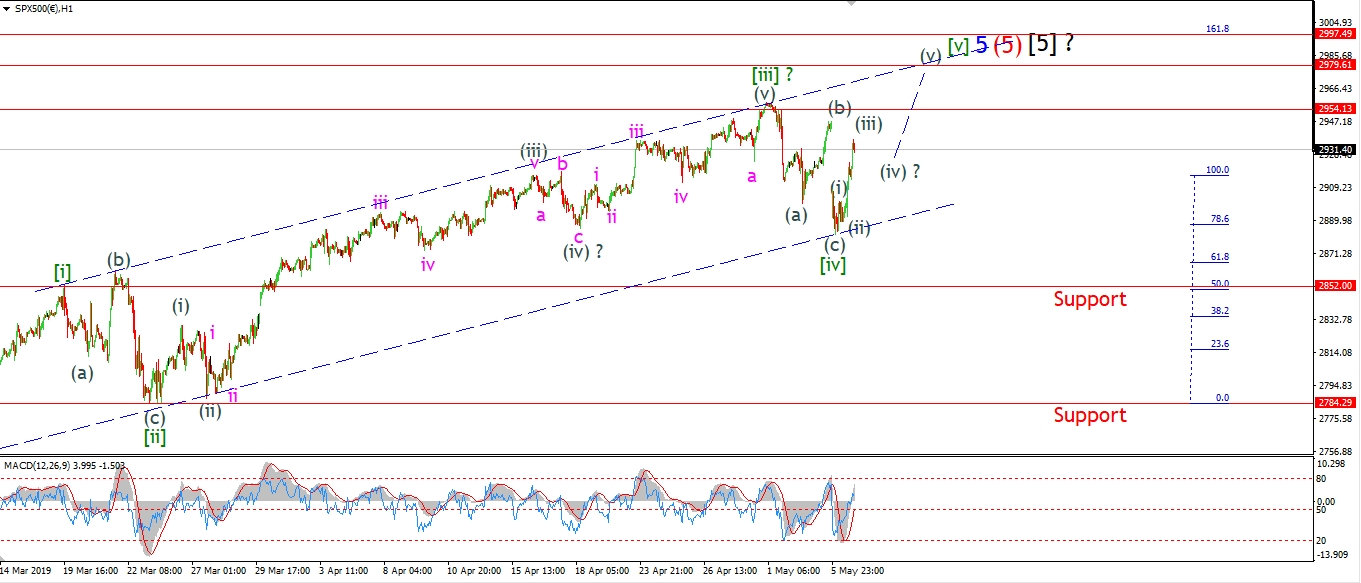 [/vc_column_text][/vc_column][vc_column width=”1/3″][vc_custom_heading text=”4 Hours” use_theme_fonts=”yes”][vc_column_text]
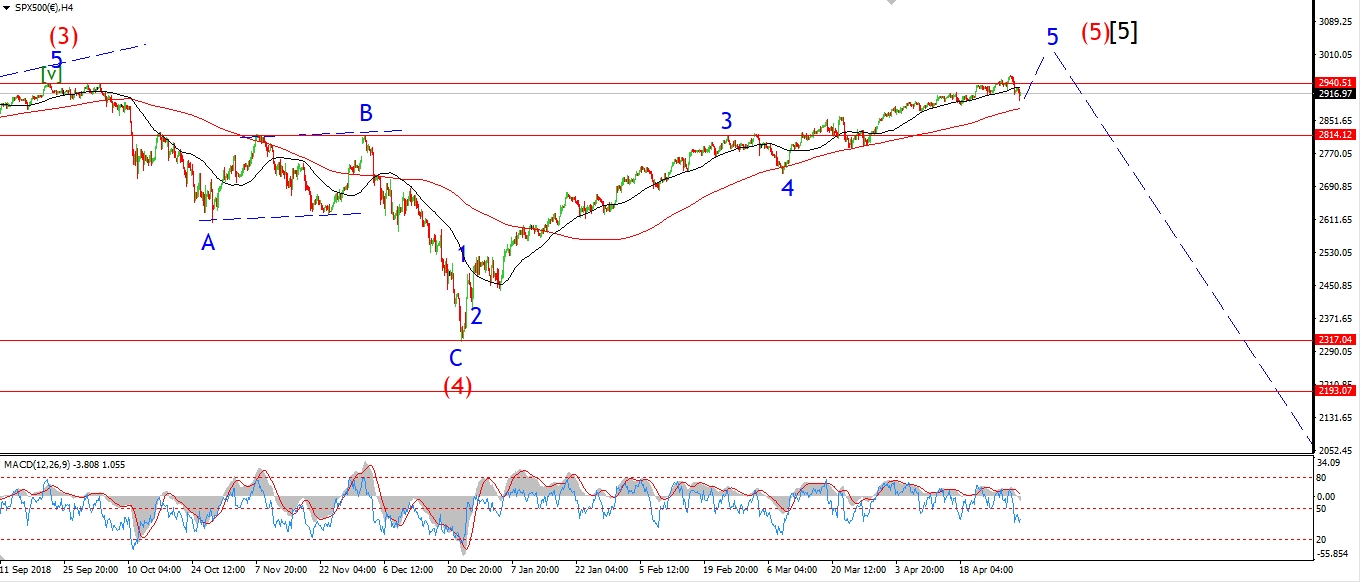 [/vc_column_text][vc_custom_heading text=”Daily” use_theme_fonts=”yes”][vc_column_text]
 [/vc_column_text][/vc_column][/vc_row]
[vc_row][vc_column][vc_column_text]
Despite a large gap lower this morning in the S&P,
the move did not invalidate the current wave count as it did in the DOW.
The price held well above the 2852 level at wave [i].
And overall then declines of late still look to be in three waves.
So I am sticking with the idea that this is a correction in wave [iv] of ‘5’.
The market has roared back again today and has regained most of the early loss.
I am now viewing this a wave [v] green well underway.
The rally should push to a new high again over the coming days.
the trend channel suggests a high for wave [v] in the area of 2980.
Although the 3000 level may just be too much to resist now.
Tomorrow;
Watch for a five wave pattern to trace out in wave [v],
with wave (iii) of [v] now reaching a close.
The end of this run is closer than most believe right now.
[/vc_column_text][/vc_column][/vc_row]
[/_s2If]
[vc_row][vc_column][vc_column_text]
[/vc_column_text][/vc_column][/vc_row]
[vc_row][vc_column][vc_separator border_width=”5″][/vc_column][/vc_row]