
Good evening to one and all.
The Lord’s Blessing’s to you all again tonight.
That was an interesting day for sure.
And some of todays action has really put a spear in a few wave counts.
Gold and silver and USDJPY have taken a hit today.
And I will admit,
I was wrong about some of these short term counts that I have been working with.
I was wrong about some of the assumptions I made.
And I was wrong about the expected outcomes.
So,
where do we go from here.
Well I think you might be interested to see below.
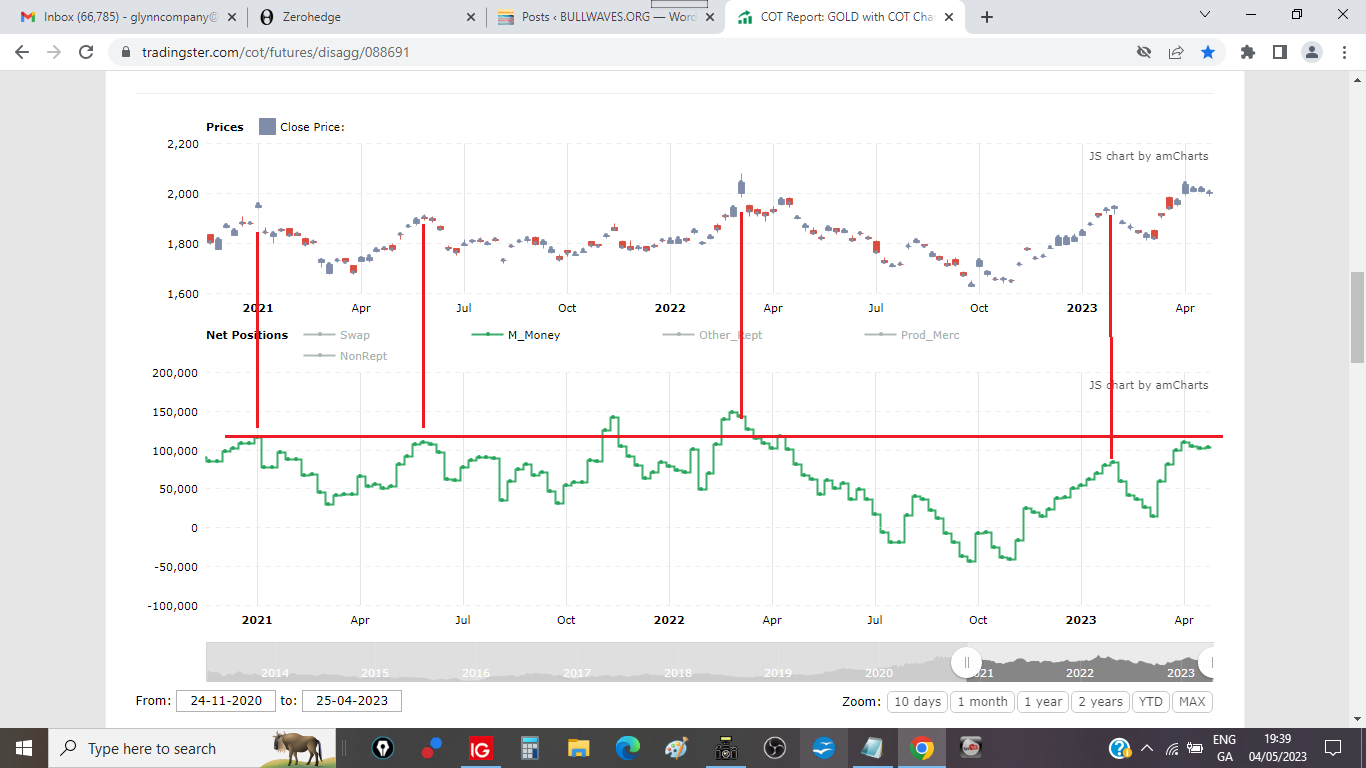
Firstly take a look at the Commitments of traders report for gold from last week.
It seems the market is fully bought in on the idea that gold solves all problems,
inflation, deflation, credit crunch, no matter what,
just buy gold.
And here we are at all time highs again just like before with a lopsided market and the announcement of the biggest Gold miner merger of all time today.
Seems like nothing can go wrong eh.
Here we go.
https://twitter.com/bullwavesreal
EURUSD.
EURUSD 1hr.
EURUSD 4hr.

EURUSD daily.
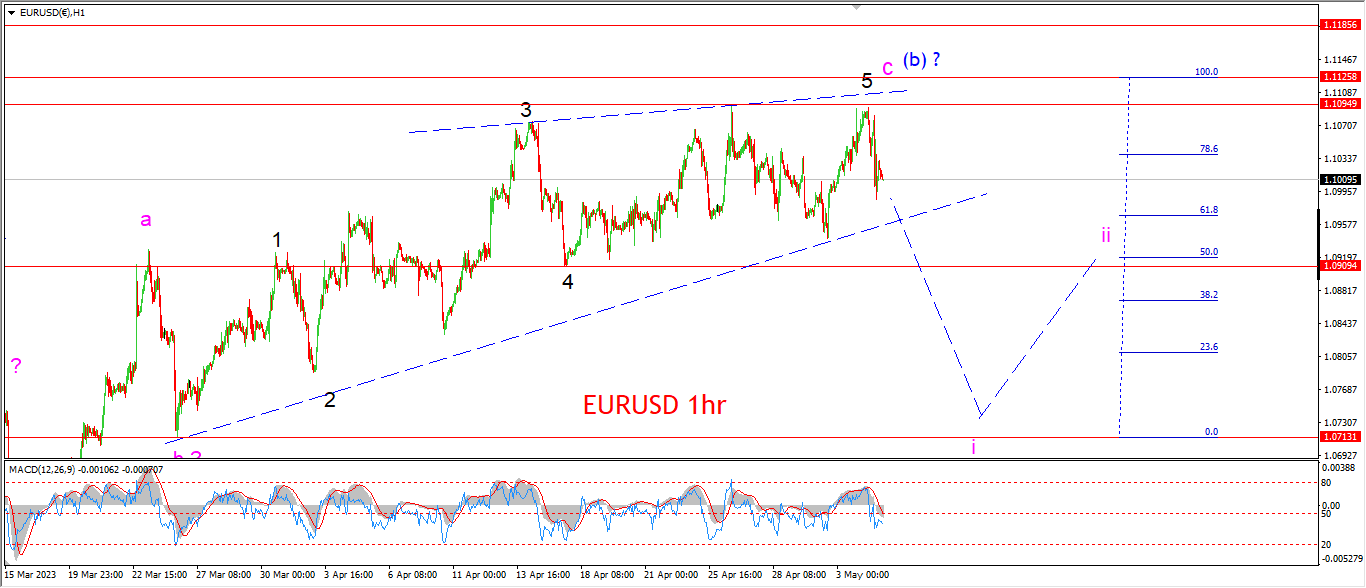
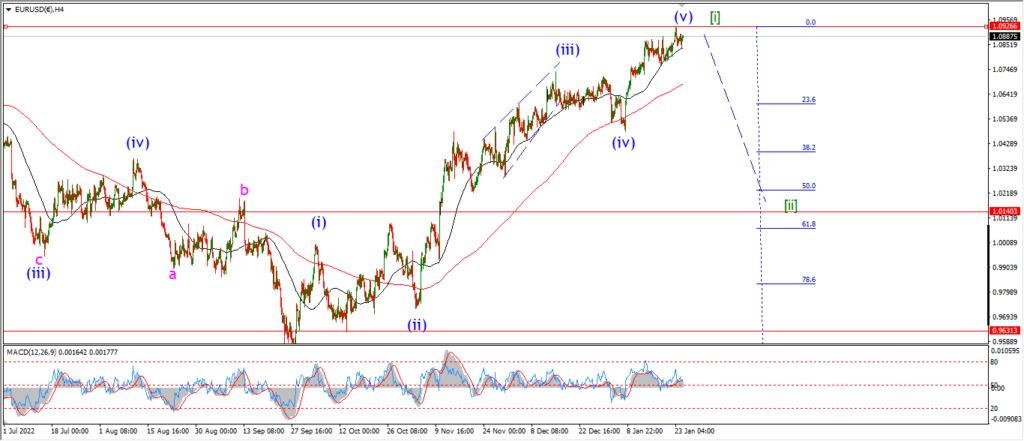
We got a pretty unconvincing drop off the top today.
That action has not confirmed the wave count for a wave (b) top yet.
But that is on the cards of we see a follow through to the downside tomorrow.
Wave ‘i’ of (c) should fall back below 1.0800 to confirm wave (c) is underway.
Tomorrow;
Watch for a break of 1.09 to favor the main wave count.
If the price holds within the wedge formation again,
that will signal wave ‘c’ is still unfolding.
GBPUSD
GBPUSD 1hr.
GBPUSD 4hr.

GBPUSD daily.
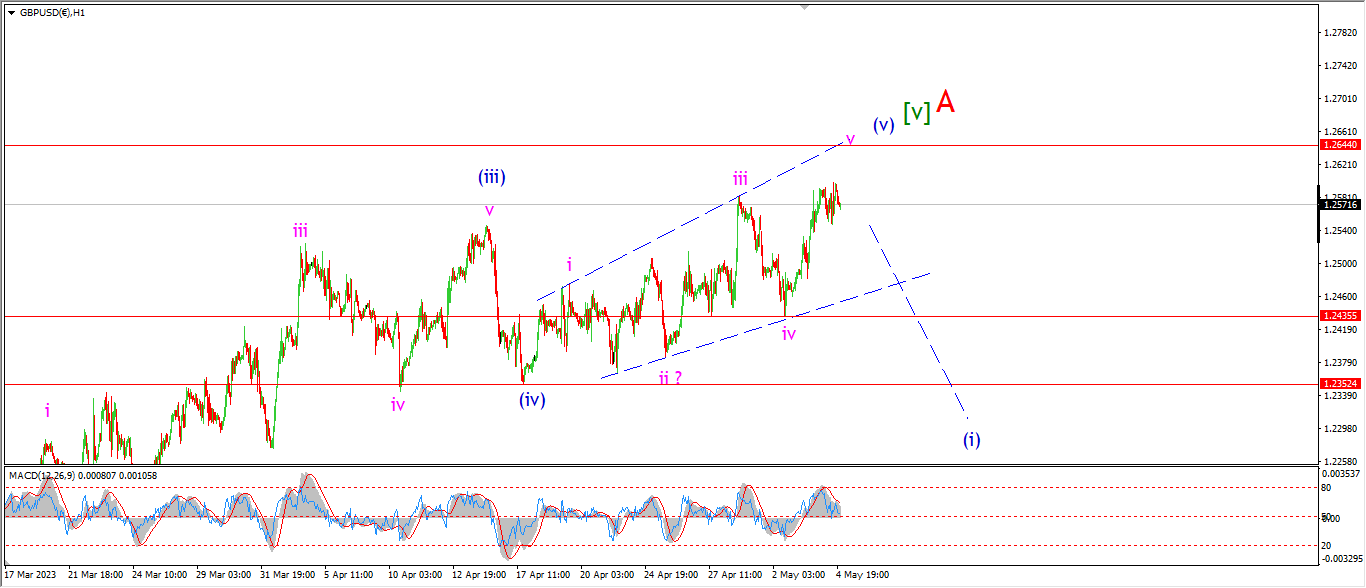
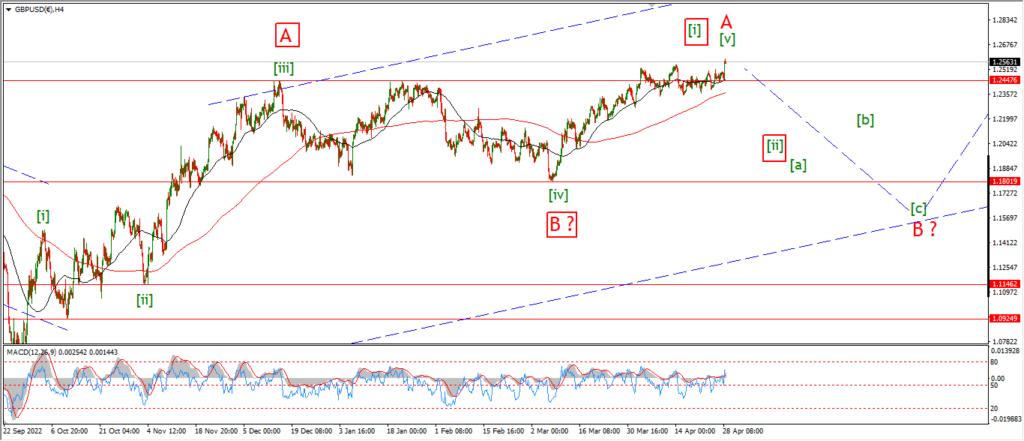
Cable traded flat today and because of that it seems that wave (v) is still holding on.
The expanding wedge pattern for wave (v) explains the action quite well here.
And if the price tracks the top of the wedge for wave ‘v’ pink,
that means wave (v) will top out near 1.2650 to complete.
Tomorrow;
Watch for wave ‘v’ to show signs of a top with a push above 1.26.
only a break below the wedge at 1.2350 again will confirm the top of wave [v] again.
USDJPY.
USDJPY 1hr.
USDJPY 4hr.

USDJPY daily.
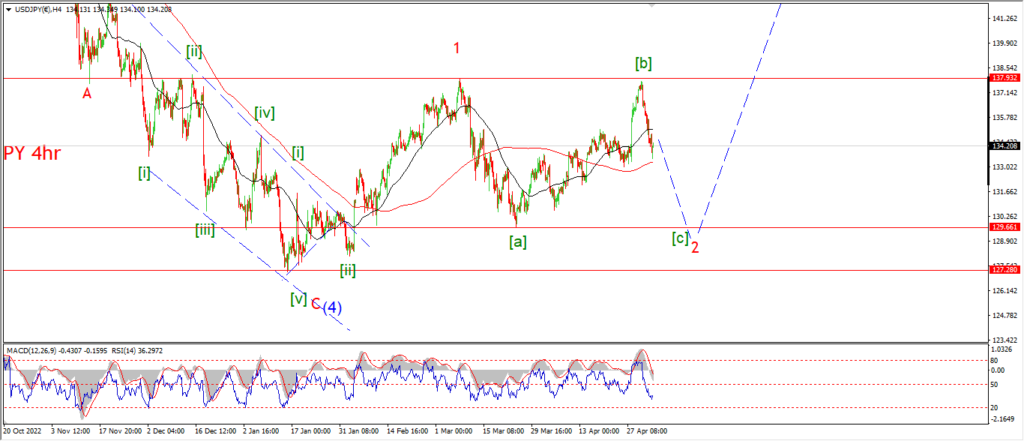
Take a look at the 4hr chart to start with tonight.
The sharp decline this week has gone a long way to triggering the alternate count here.
And because of that more impulsive decline this week I have switched to the alternate count for wave ‘2’ red.
If this interpretation is correct here,
then wave [c] of ‘2’ will fall back into 1.2960 to complete a flat correction wave ‘2’.
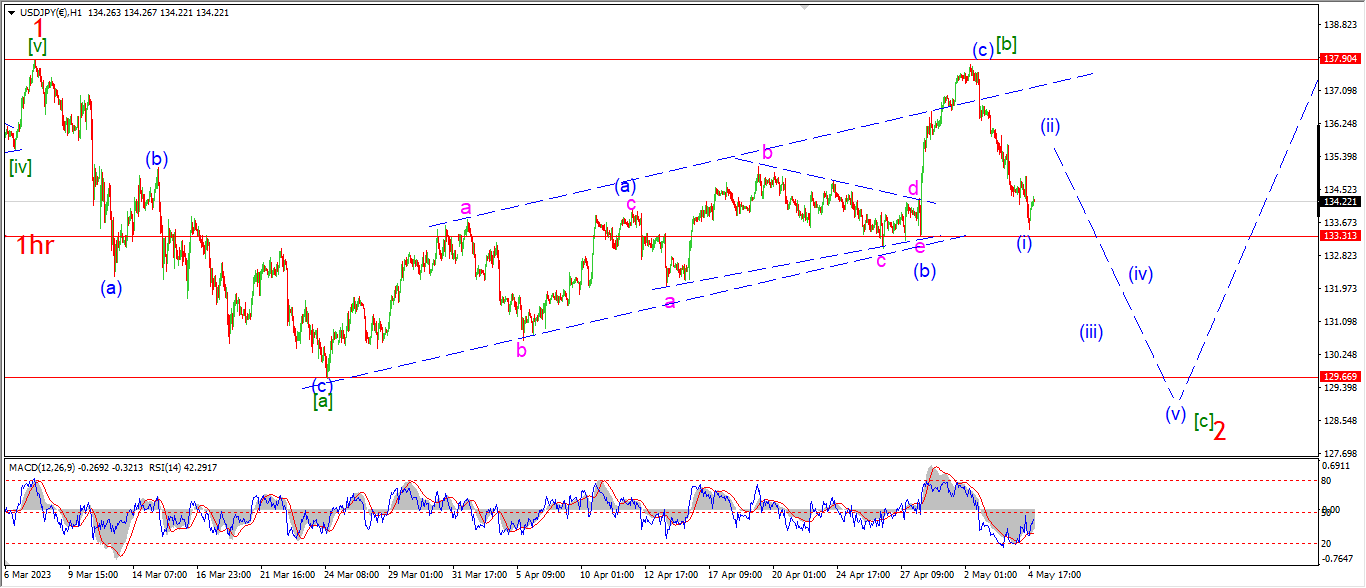
On the hourly chart you can see the break down of wave [b] is a little tricky but it does fit a three wave pattern if we view wave (b) of [b] as a triangle.
And now we have seen the market top out and reverse in an impulsive fashion this week.
I have labelled this weeks decline as wave (i) of [c].
And wave [c] will trace out five waves to break 129.60 over the coming week to complete wave [c] and ‘2’.
Tomorrow;
watch for wave (i) and (ii) to form a lower high over the coming few days trade.
Wave (iii) of [c] should then continue lower in five waves as shown.
DOW JONES.
DOW 1hr.
DOW 4hr
DOW daily.
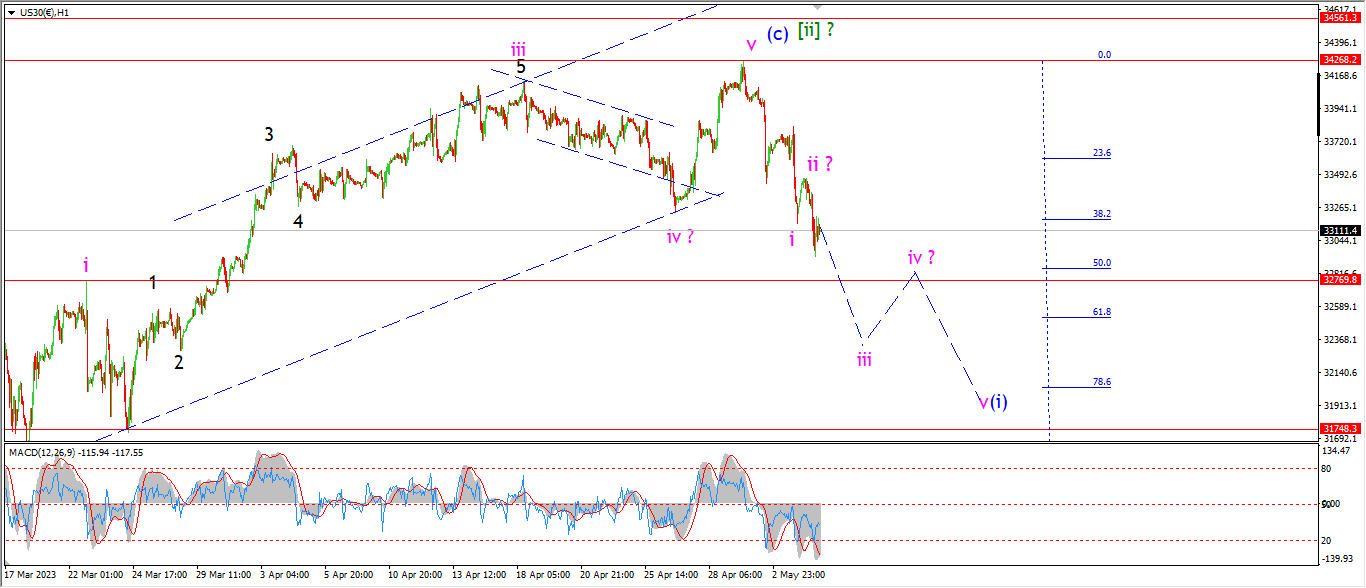
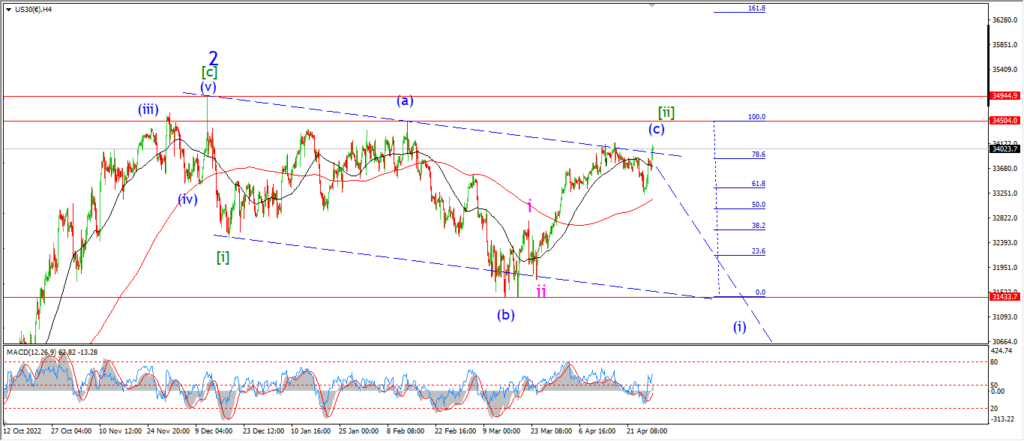
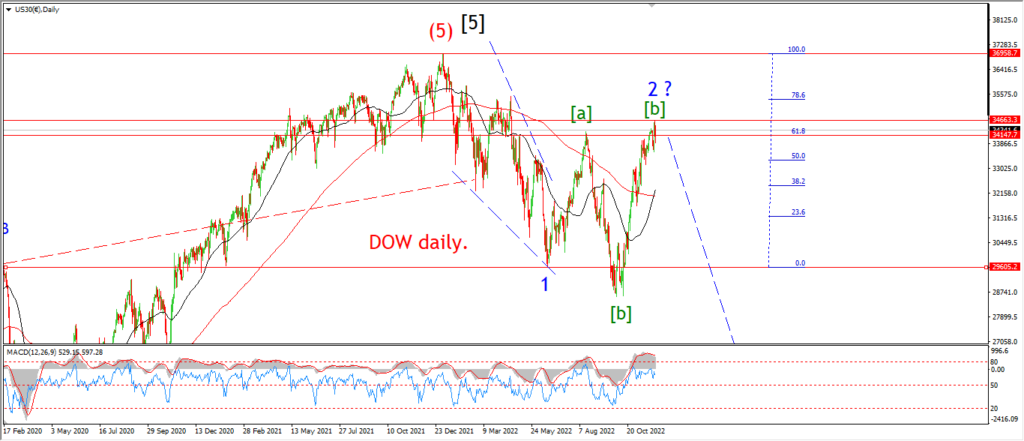
The market took another hit today which is getting us closer to a possible bearish pattern off the top again.
At the very least,
this weeks decline is developing in a more impulsive manner than last weeks attempt which ended up being a three wave decline overall.
The market has now broken the previous wave ‘iv’ low.
But so far the wave ‘i’ high is holding at 32760.
So that level marks the next support in the previous pattern.
And each support that breaks is one step closer to that all important five waves down in wave (i).
Tomorrow;
It is hard to know if wave ‘i’ and ‘ii’ are already complete,
or if todays lows marks the complete wave ‘i’.
I am leading with the idea that wave ‘ii’ is already complete and wave ‘iii’ is now underway this evening.
If the market continues lower to break 32760 tomorrow,
that will favor the wave ‘iii’ idea.
There is more work to do here before I can get a little more confident with this bearish pattern.
GOLD
GOLD 1hr.
GOLD 4hr.

GOLD daily.
Ok,
don’t kill me for changing my mind on gold today.
I know some people are getting really impatient with my take on this market lately.
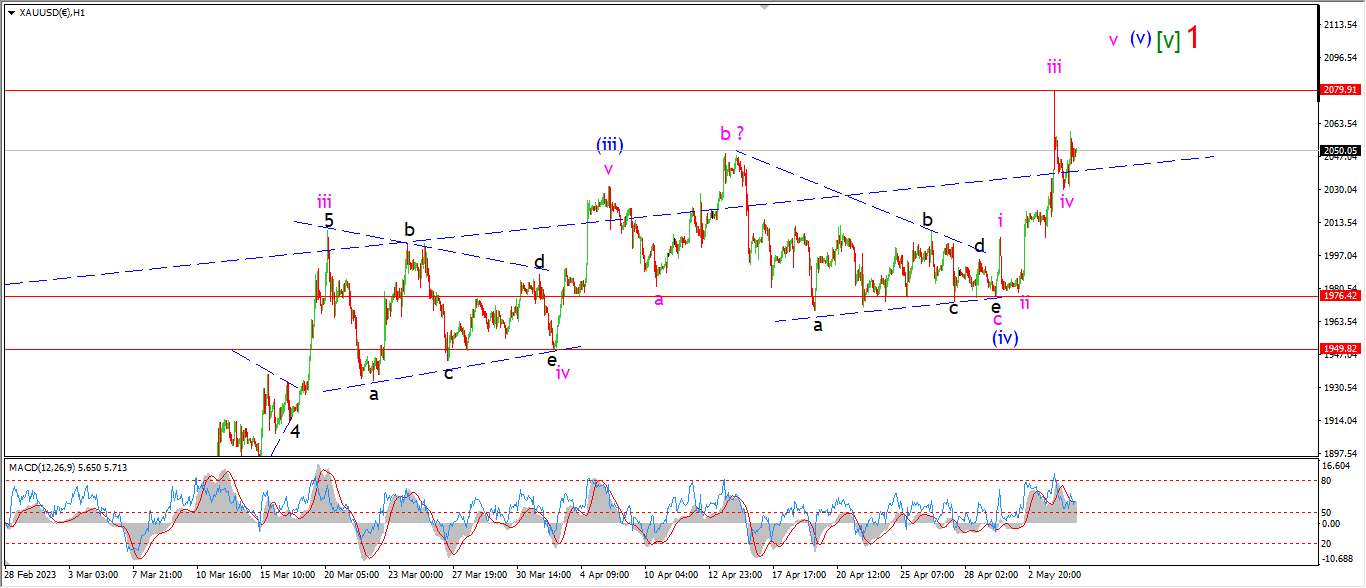
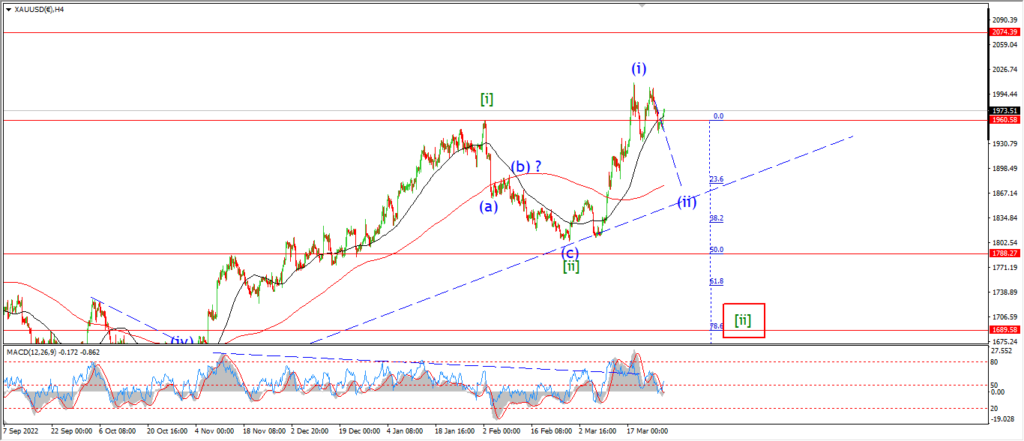
The price did push out to a new high today which has invalidated my previous count.
I am now moving the whole count up by one degree into this top.
And now I am gently suggesting that wave ‘1’ of (5) is now pretty much done.
On the daily chart the top of wave ‘1’ has retraced all of the wave ‘C’ decline from last year.
On the 4hr chart you can see the progression of wave [v] of ‘1’ into the latest highs.
And on the hourly chart you can see the progression from wave (iii) (iv) and (v) to complete this new high.
In my defense,
the pattern that has developed over the last 2 months has been frightfully complex.
the internal pattern of wave (iv) topped it all off with a triple combination expanded flat.
In this case the final wave ‘c’ of (iv) traced out a triangle.
Well,
it’s a mute point now because I got that one wrong!
Tomorrow;
The series of triangles that occurred over the last few weeks has only reinforced the idea that this pattern is very mature.
Triangles happen in a fourth wave position in an impulse wave.
So we can see that two triangles in succession tells us that an extended pattern is close to completing.
I have jumped the gun too much in gold lately.
So I will wait for the market to make a decision here!
I will say that 1950 is a pretty important support level now.
CRUDE OIL.
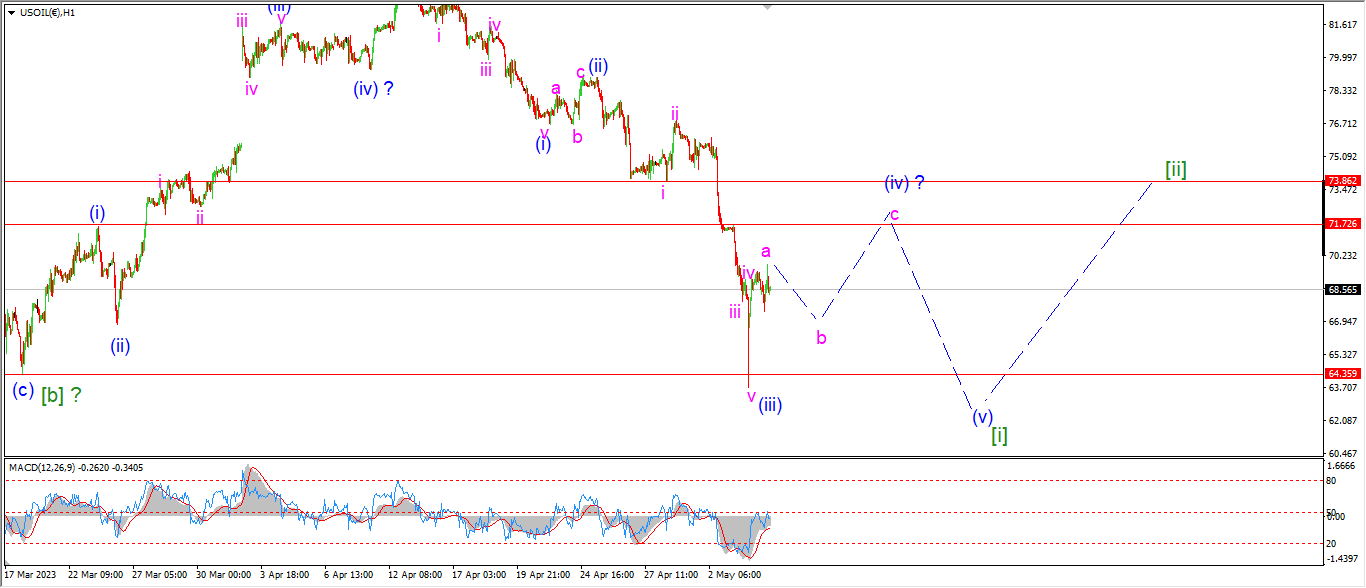
CRUDE OIL 1hr.
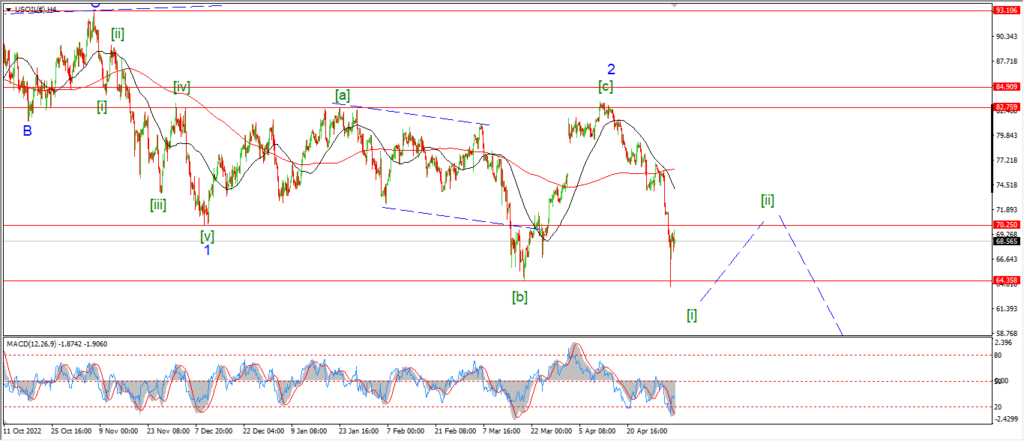
CRUDE OIL 4hr.
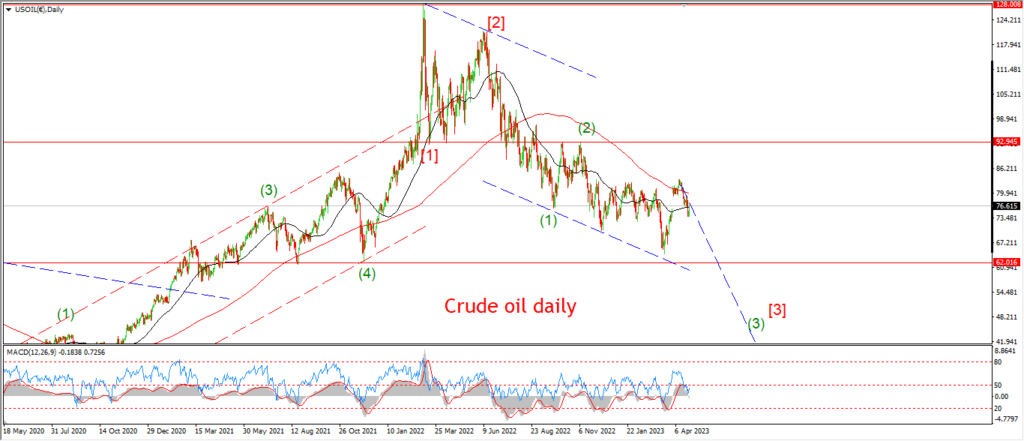
CRUDE OIL daily.
Crude has had quite a week of successive declines in this third wave pattern.
But I think we can say that wave (iii) of [i] has now hit a low at todays session low.
the extent of this decline has surprised even me to be honest.
As wave (iii) of [i] has retraced the full rally in wave [c] of ‘2’.
That’s an almost 25% decline in crude in a little under three weeks off that wave ‘2’ top.
I can only imagine what OPEC is thinking after that,
and it ain’t good vibes, that’s for sure!
Tomorrow;
The bounce off todays lows suggest wave (iv) is now underway.
so watch for three waves up to form in the next few sessions.
This pattern suggests wave (iv) will complete by midweek next week and then back down into wave (v) later next week.
S&P 500.
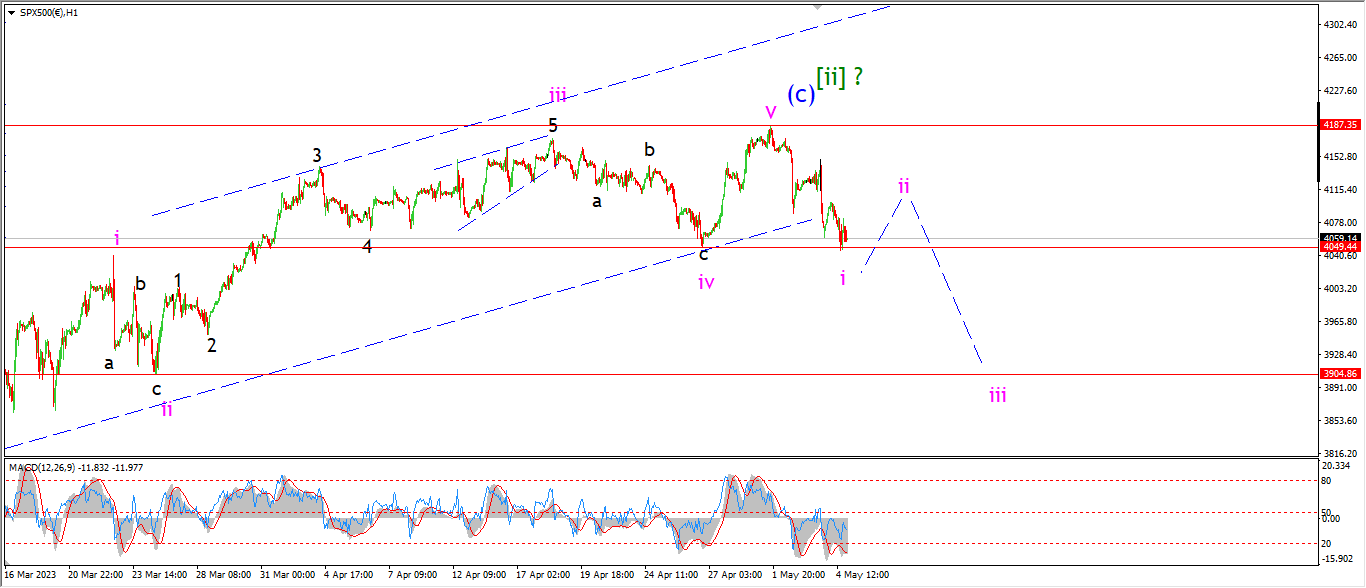
S&P 500 1hr
S&P 500 4hr
S&P 500 daily.
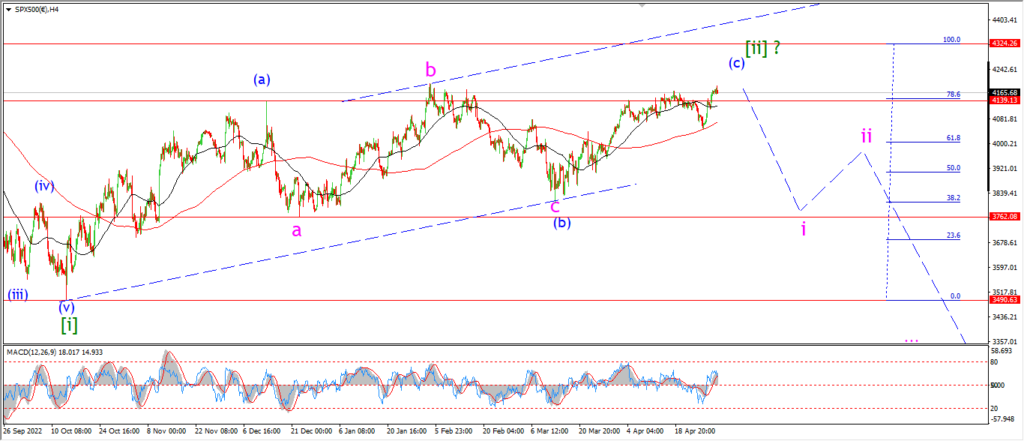
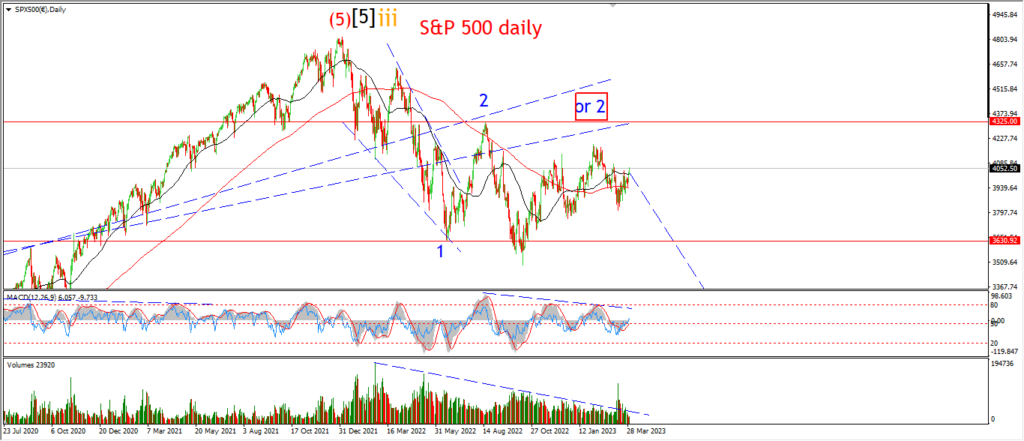
The S&P has retraced all of the rally into wave ‘v’ at todays lows.
I am calling wave ‘i’ of (i) complete at the session lows but the pattern is not ideal here.
We will know more tomorrow on the setup for wave ‘ii’.
If the market retraces higher back above 4100 again,
that will signal wave ‘ii’ is underway.
Tomorrow;
Its another possible reversal pattern in the making here,
and as usual it is too early to tell for sure that the top is in for wave [ii] green.
I am just going to have to wait and see if wave ‘ii’ forms that lower high to signal the reversal pattern is in play again.
SILVER.
SILVER 1hr
SILVER 4hr.
SILVER daily.
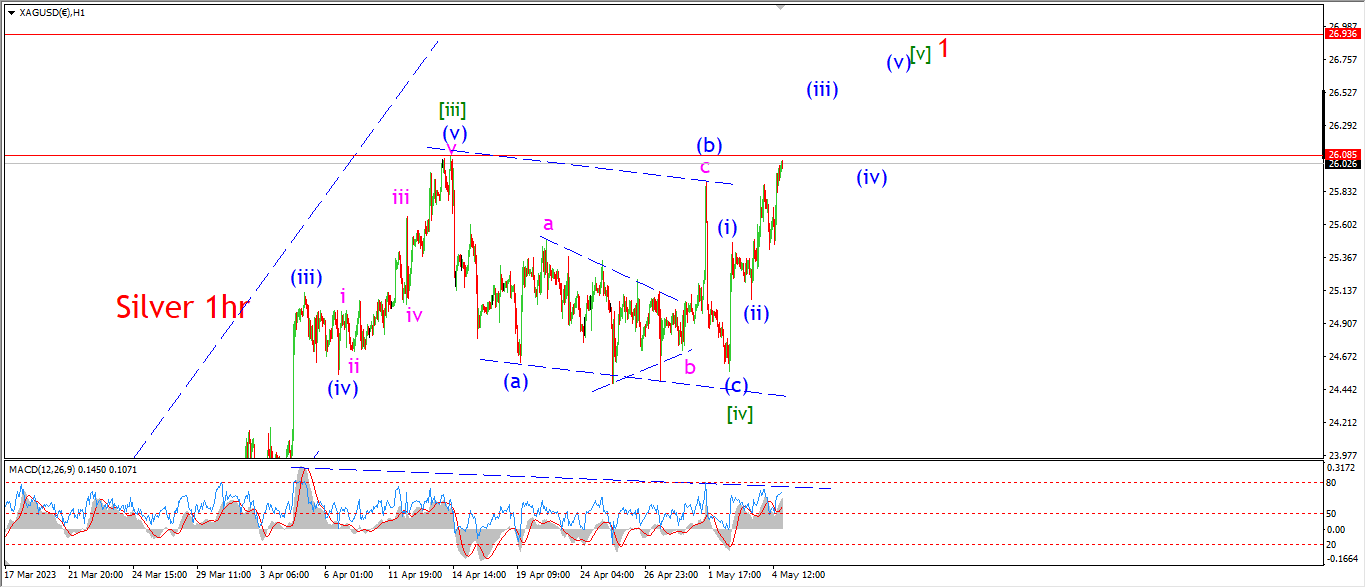
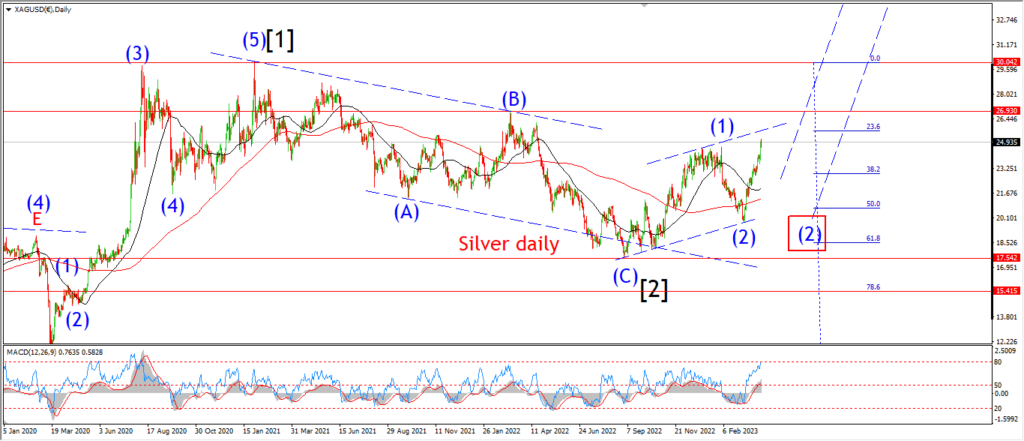
Silver has thrown me off today also.
The previous count showed a series of 1,2, patterns higher.
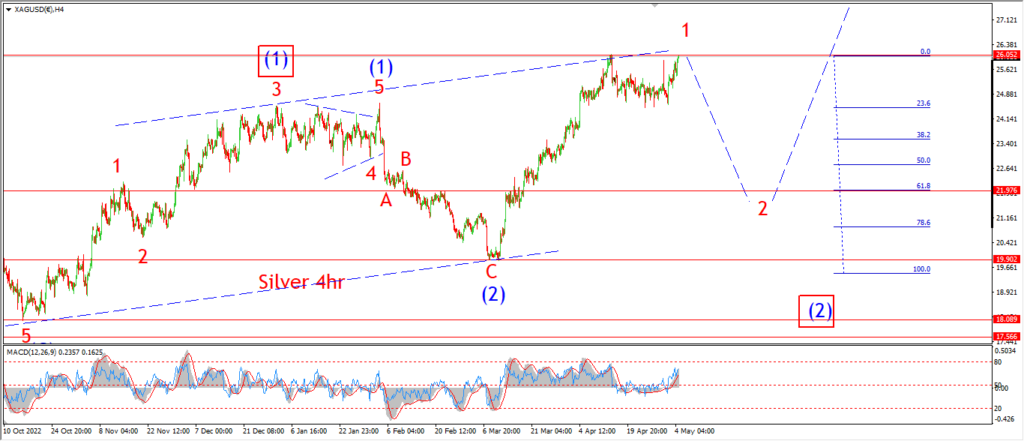
Now I am counting the whole rally into todays highs as wave ‘1’ red.
The internal wave count was off,
but I do think this overall idea which suggests a top is coming is correct.
I do believe we are at a top for a wave ‘1’ rally.
And there is a significant decline coming into wave ‘2’.
So the larger degree wave count is set in wave ‘1’.
I am just going to have to wait for this second wave to begin now.
Tomorrow;
This weeks action has been a real head-scratcher with a series of whipsaw moves all over the place.
I am showing wave [iv] and [v] on the hourly chart.
So its a matter of counting down the sub waves until the pattern is filled and a top forms.
BITCOIN
BITCOIN 1hr.

BITCOIN 4hr.
BITCOIN daily.
….
FTSE 100.
FTSE 100 1hr.
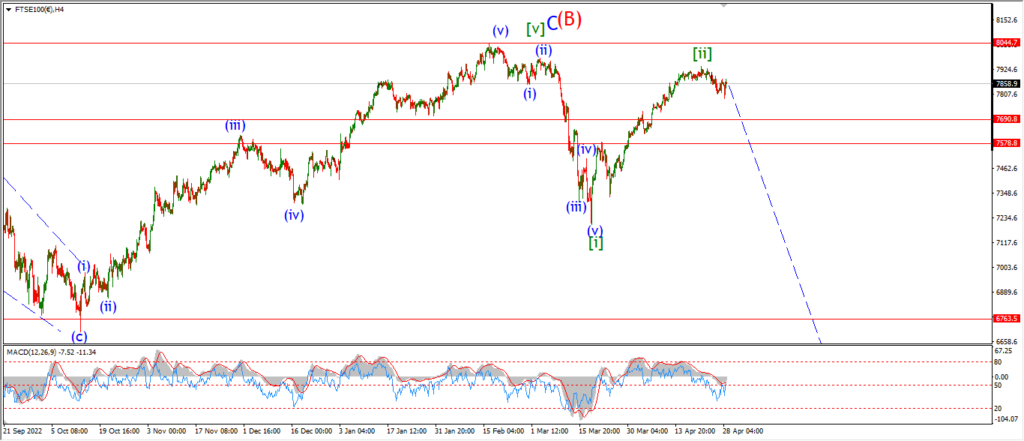
FTSE 100 4hr.

FTSE 100 daily.
….
DAX.
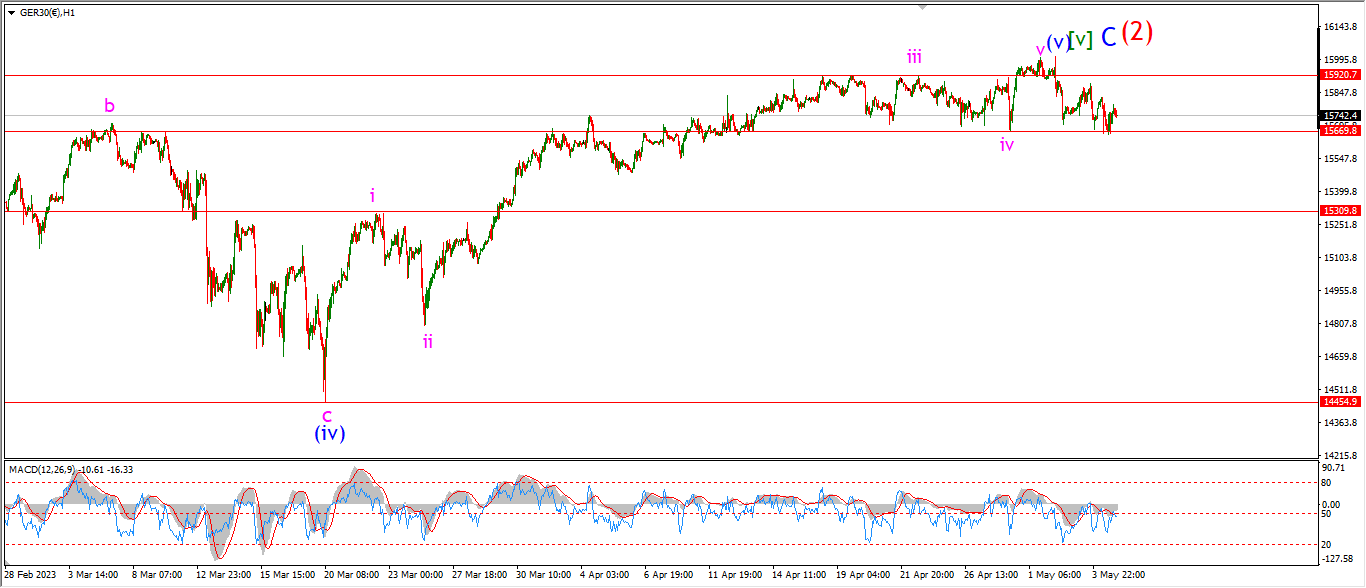
DAX 1hr
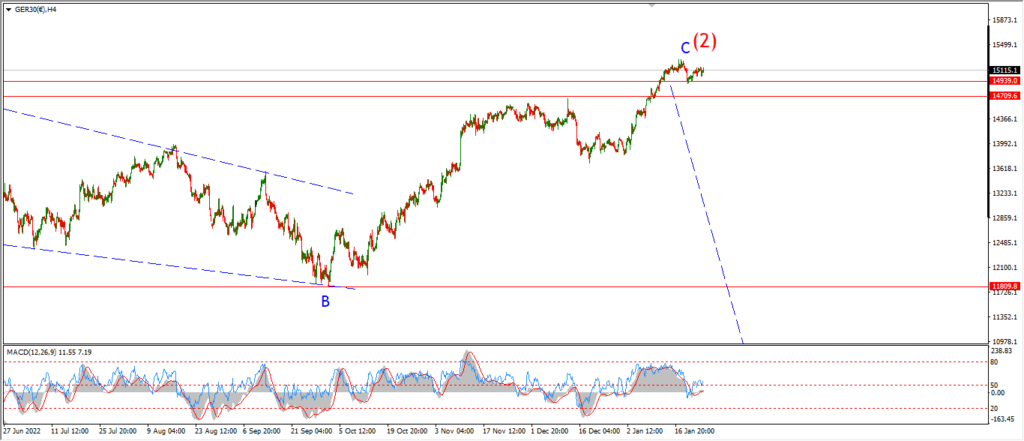
DAX 4hr

DAX daily.
….
NASDAQ 100.
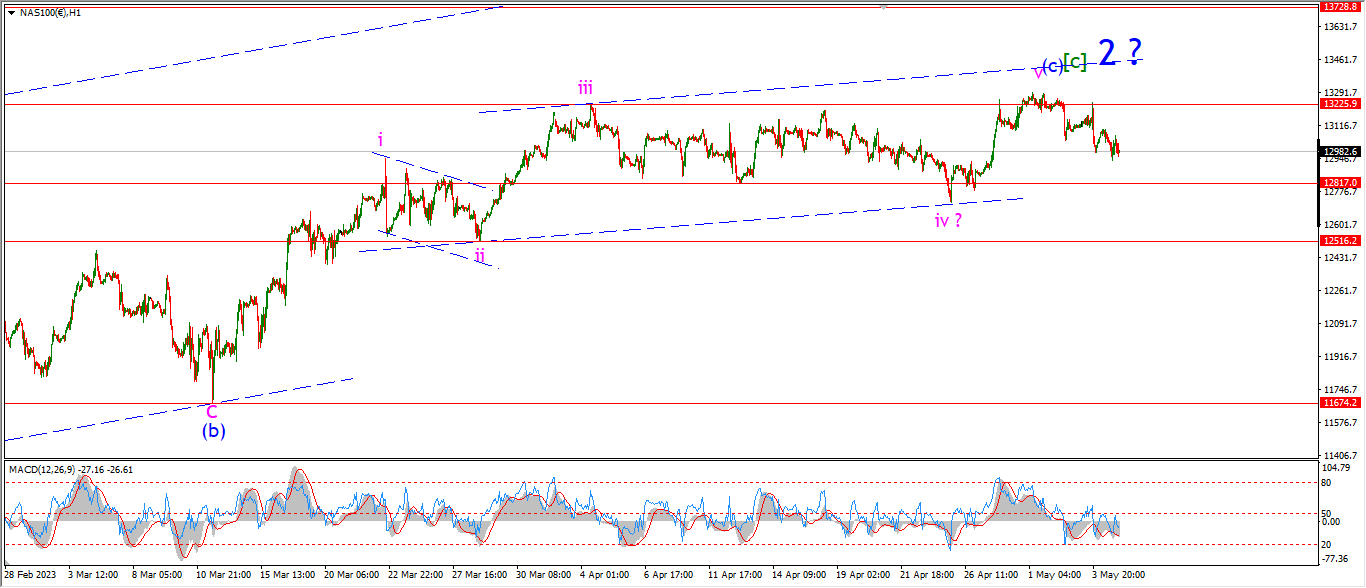
NASDAQ 1hr
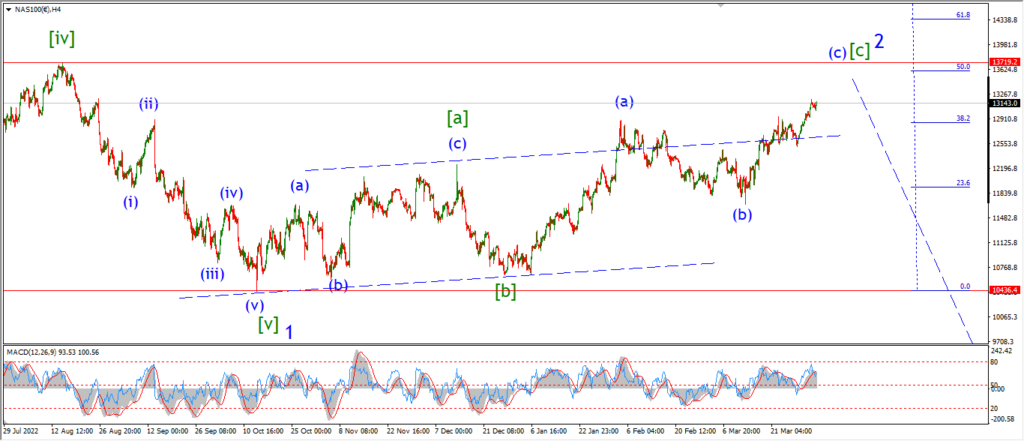
NASDAQ 4hr.

NASDAQ daily.
….