
Good evening to one and all.
The Lord’s Blessing’s to you all again tonight.
I’m back!
I can’t walk,
I got a foot the size of a melon,
and a pocket full of pill’s,
but I am back none the less!
It turns out a got an infection in my foot that has made it way up my leg.
I’m on a double dose of antibiotics,
and I have avoided hospitalization, maybe.
We will see how the next few days go,
if the pills get the infection under control then I am home and dry!
If not,
then I gotta go into hospital,
I hope and pray that can be avoided!
On with the show.
https://twitter.com/bullwavesreal
EURUSD.
EURUSD 1hr.
EURUSD 4hr.

EURUSD daily.
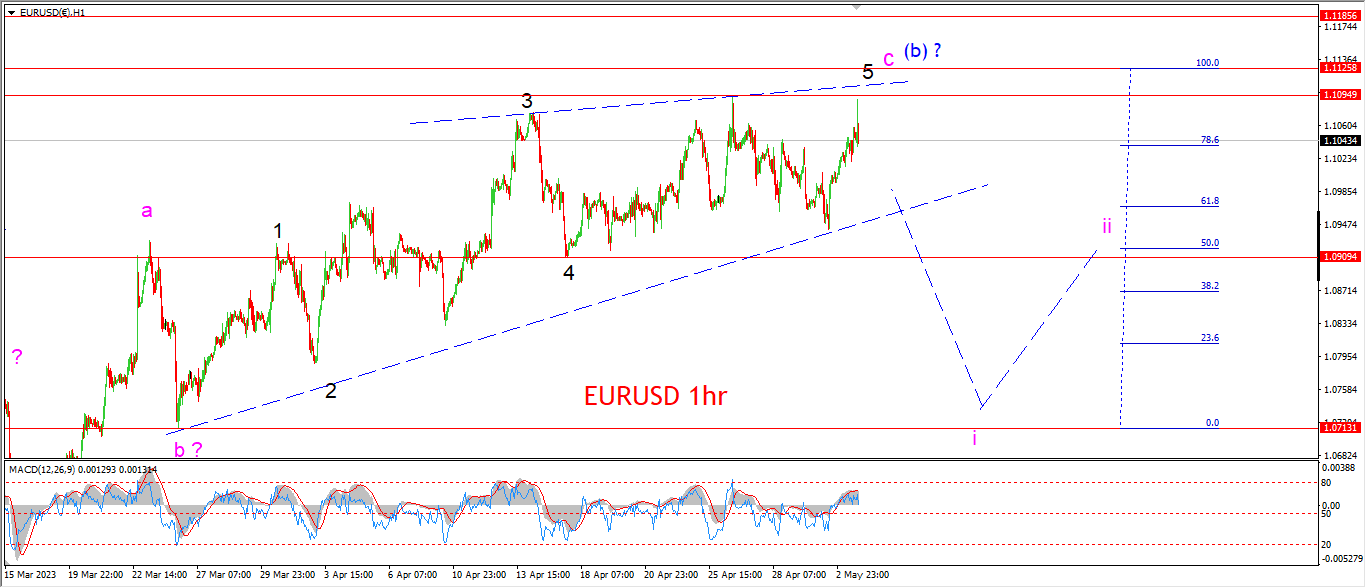
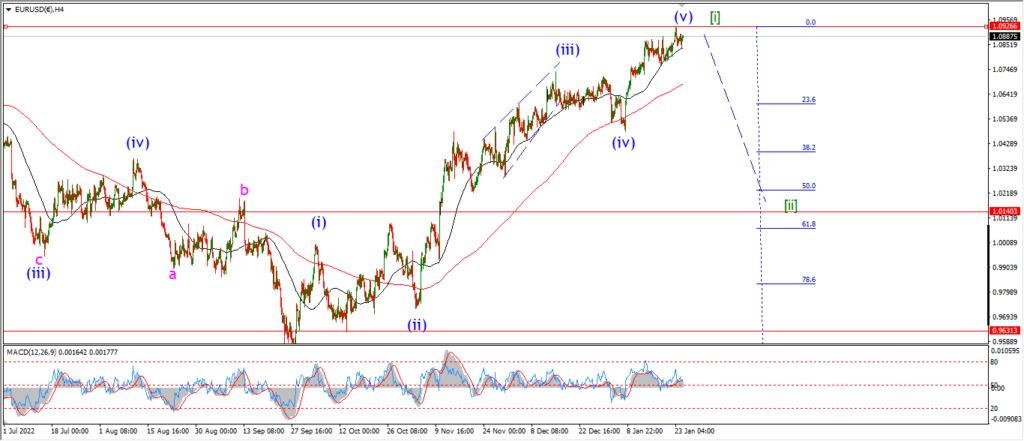
The action in EURUSD has reverted to that rising wedge pattern in wave ‘c’ of (b) again.
This wedge in wave ‘c’ has now taken 6 weeks of our lives from us!
And just like you might expect in a (b) wave,
the internal pattern has been very un-predictable,
especially in wave ‘c’ of (b).
It seems wave ‘c’ of (b) will now reach equality with wave ‘a’,
so that gives a target at 1.1125 to complete this three wave rally.
Tomorrow;
Overall wave ‘5’ of ‘c’ has taken much longer than usual.
so I really can’t see much more time left to complete the pattern.
Watch for wave ‘5’ of ‘c’ to hit 1.1125 and then I will look for that reversal into wave ‘i’ of (c) to begin again.
GBPUSD
GBPUSD 1hr.
GBPUSD 4hr.

GBPUSD daily.
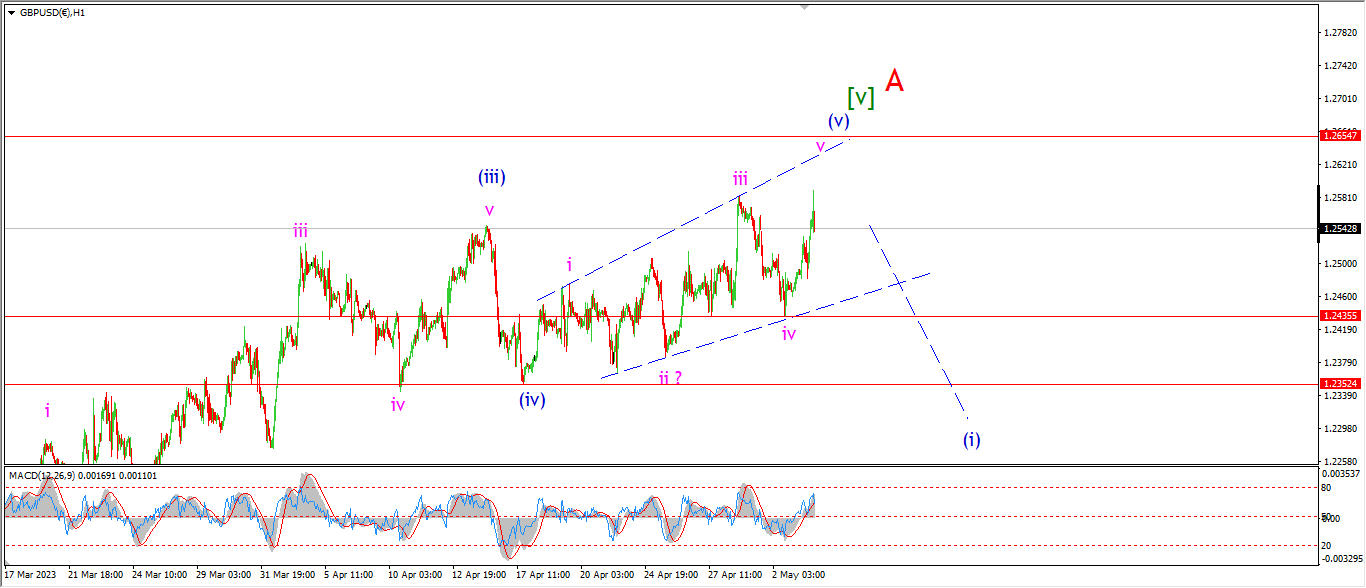
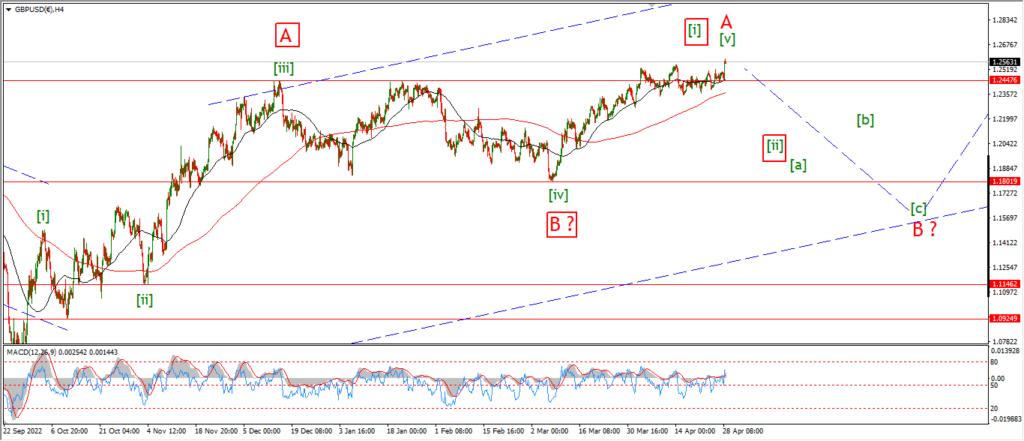
Cable has broken out of Mondays pattern also tonight.
The price made a very small new high this evening and now I have switched to a new wave count for wave (v) blue.
the price action over the last month has been so choppy and overlapping that I am finding it hard to nail down the correct wave pattern.
Tonight I am looking at a possible expanding triangle wave (v) blue.
Wave ‘v’ of (v) has pipped above the wave ‘iii’ high already,
so technically this pattern can complete here also.
This pattern can only be caled complete with a drop beck below the wave (iv) low at 12350.
But I will also keep and eye on that wave ‘iv’ low at 1.2435 as a signal level.
Tomorrow;
Watch for wave (v) to complete this triangle pattern scenario by Friday.
Once the price falls below 1.2435 again that will be the initial signal wave (v) is complete.
USDJPY.
USDJPY 1hr.
USDJPY 4hr.

USDJPY daily.
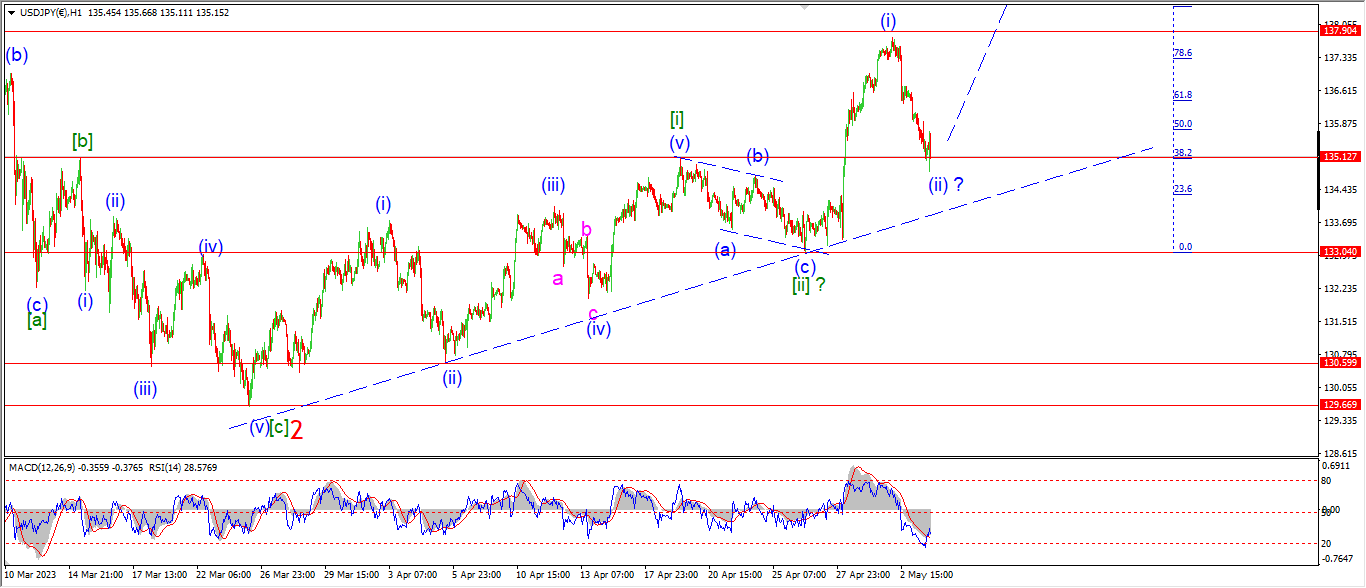
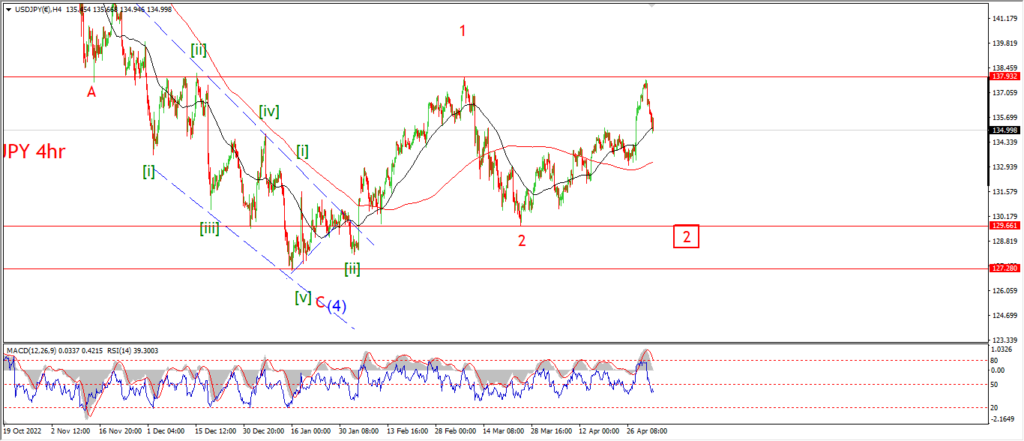
USDJPY is another market where the short term count got invalidated today.
All is not lost though.
I am now looking at another possible bullish setup for wave [iii] of ‘3’ this evening.
With a rising wedge wave [i] and [ii] completing last week.
Wave [iii] began with that sharp rally into the recent high at wave (i).
And now the decline today is labelled wave (ii) of [iii].
This pater will be easy to confirm over the next few sessions.
Wave (iii) of [iii] requires a large rally to hit the 140.00 area in five waves.
And the low at wave [ii] must hold at 133.04.
If that doesn’t happen,
then I will be forced to look again at the alternate count for wave ‘2’ red as seen on the 4hr chart.
Tomorrow;
Watch for wave (ii) to hold above 133.04 at the very low end.
Wave ‘i’ of (iii) should rally towards 137.00 if this count is correct.
DOW JONES.
DOW 1hr.
DOW 4hr
DOW daily.
I am writing this evening as the Powell is giving his press conference after the statement.
I tried to watch the presser,
but I find it so utterly detached from the reality of normal life that it starts to turn my stomach after about 20 minutes.
The Fed knows exactly what they are doing,
they are tightening the screws around a glass bottle.
they know they are beginning to crack this thing now so they have slowed down the screwing!
But they are actually aiming to break the back of this credit cycle.
Its only a matter of time now.
M2 has already gone negative now.
so monetary deflation is here.
and inflation has turned the corner off the top of the cycle.
The stock market, housing market and employment markets are the next to crack.
And that is the aim of this game!
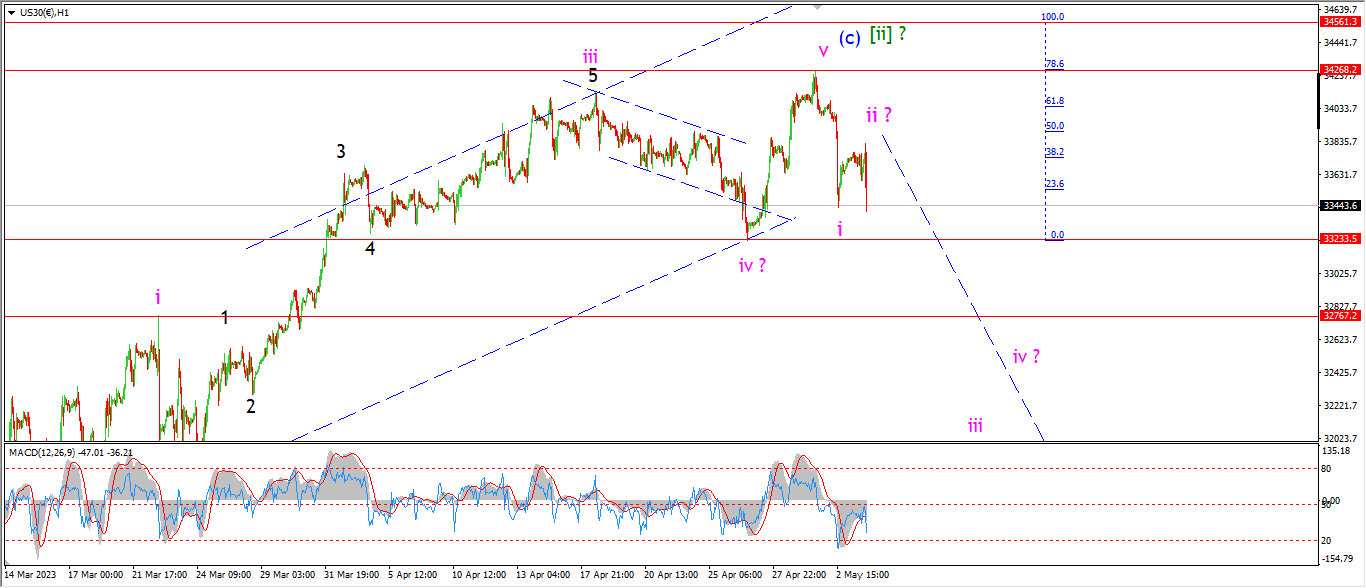
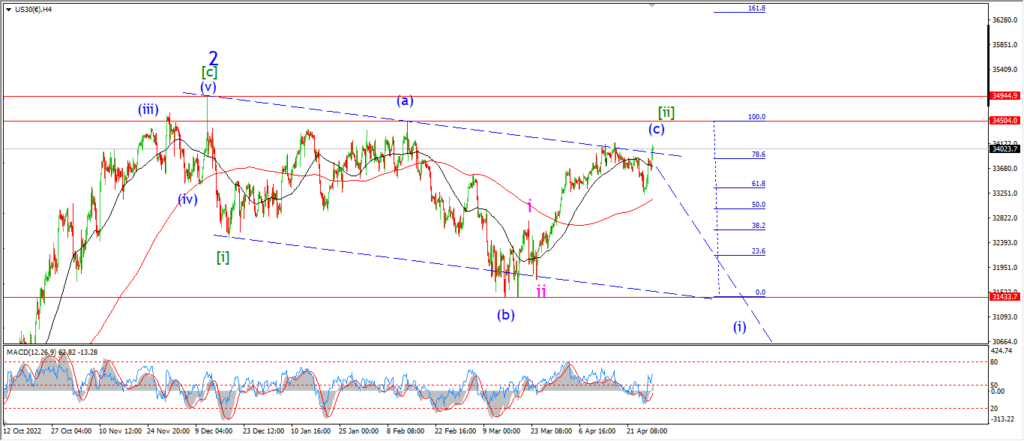
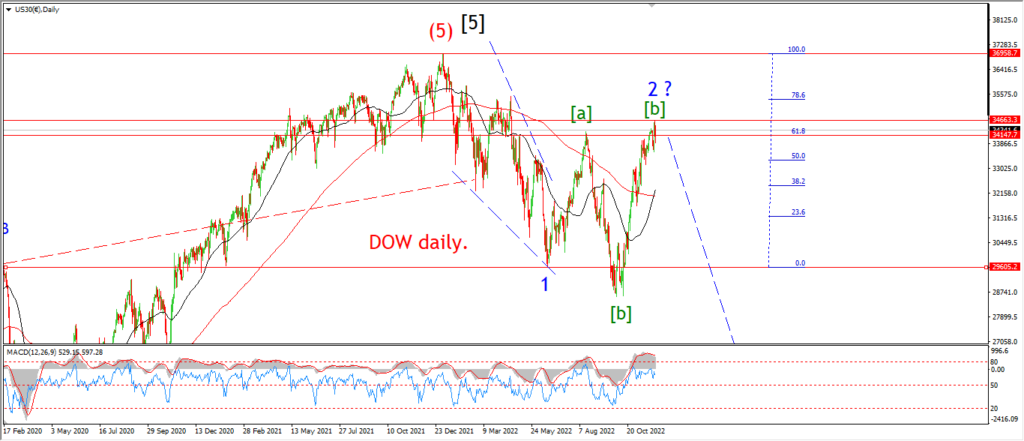
I am looking at the action this week so far and again the pattern is hinting at a reversal in the making off the top of wave [ii].
The wave ‘iv’ low marks the initial support level to watch here.
A break of wave 33230 again will signal wave ‘iii’ of (i) is underway.
There are two more days left to trade this week,
so the possibility of an impulsive reversal is back on the table again by Friday evening.
Tomorrow;
Watch for wave ‘ii’ to complete this lower high.
And wave ‘iii’ of (i) should then fall back below 33230 again.
The wave ‘i’ high at 32760 is again the next support to watch.
GOLD
GOLD 1hr.
GOLD 4hr.

GOLD daily.
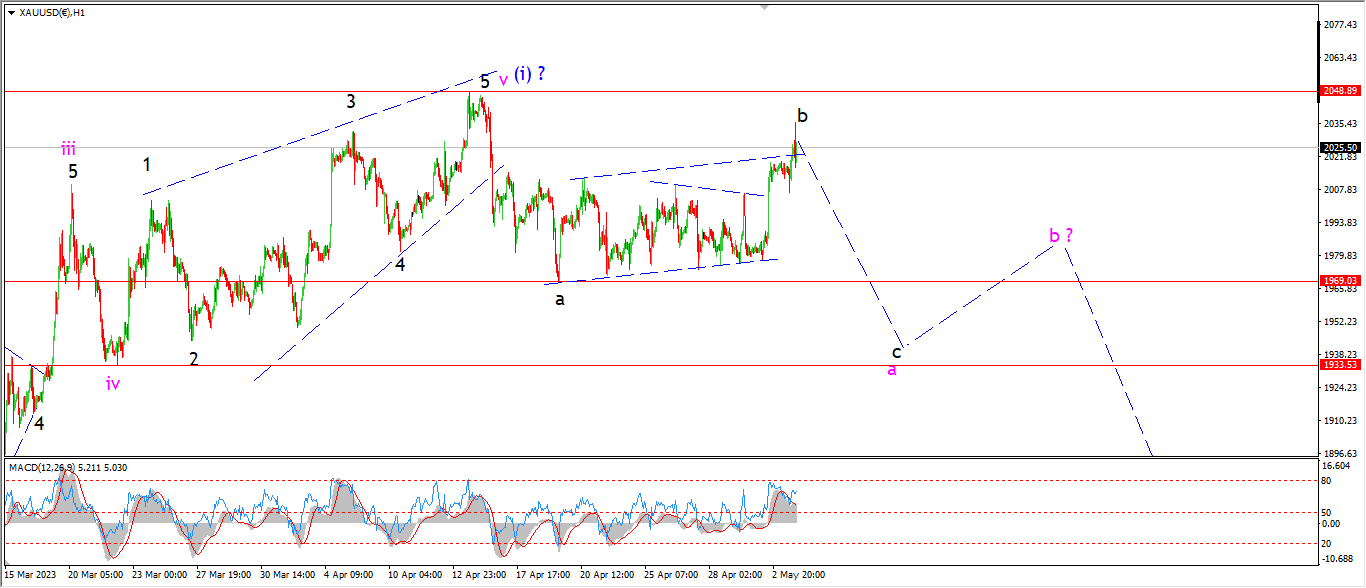
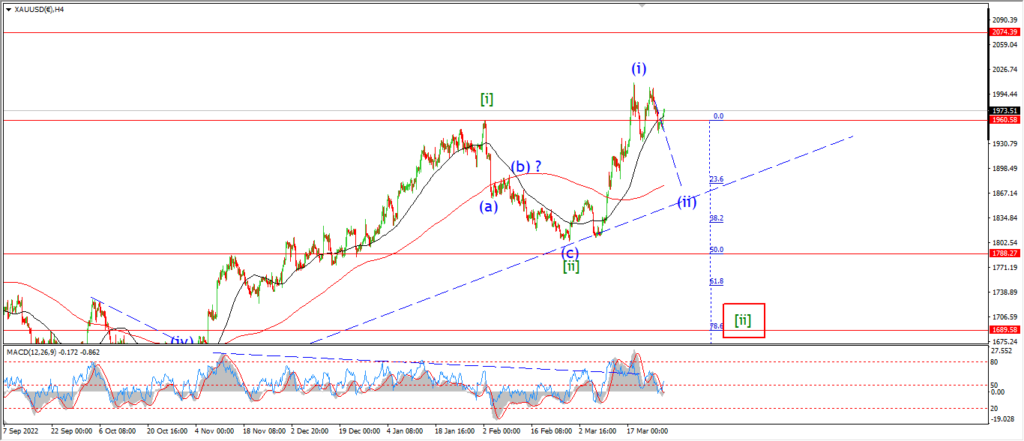
A three wave decline off the top for gold is still my base case scenario here.
Wave ‘a’ pink is still underway.
but the internal pattern has been revised again tonight.
Wave ‘b’ of ‘a’ has traced out a three wave correction higher to a lower high this evening.
And wave ‘c’ of ‘a’ should now turn lower again towards the 1950 area to complete three waves down as shown.
Tomorrow;
Watch for wave ‘b’ of ‘a’ to hold below the highs.
Wave ‘c’ will be confirmed with a break of 1969 again.
CRUDE OIL.
CRUDE OIL 1hr.
CRUDE OIL 4hr.
CRUDE OIL daily.
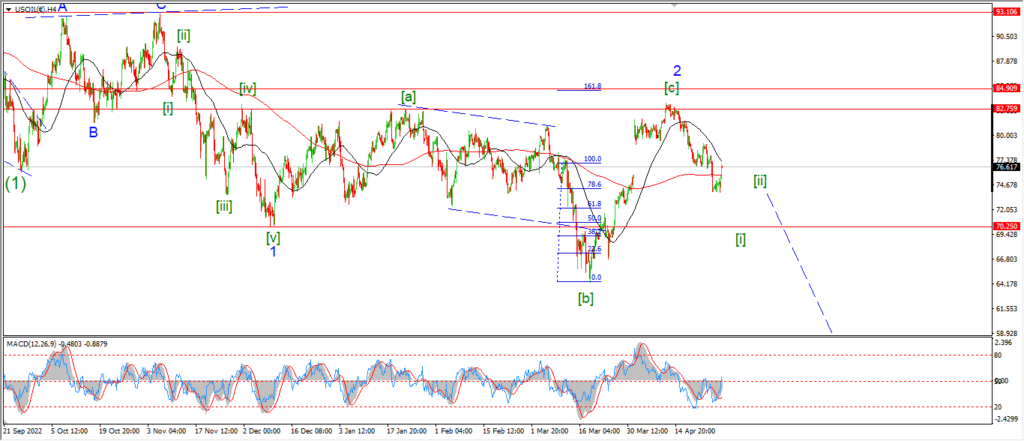
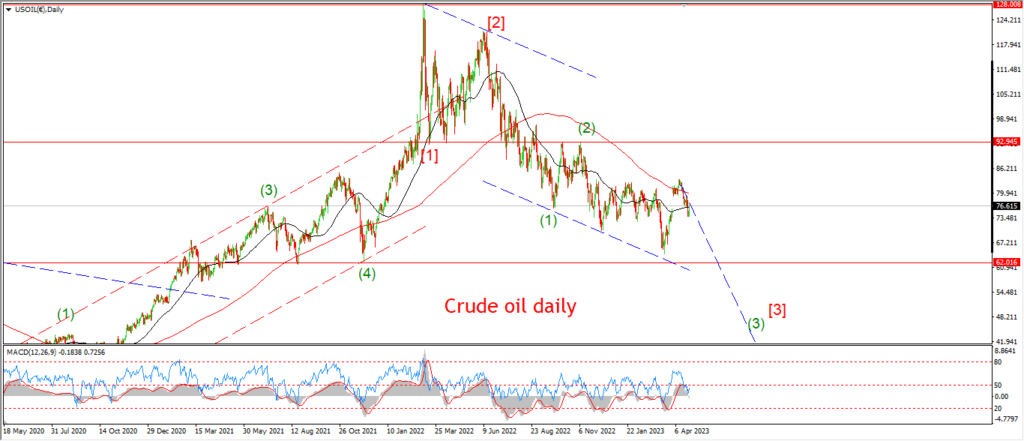
Crude oil has undergone quite the crash over the last few weeks,
and again we face the reality check that his decline suggests.
Economies are slowing down in a big way now at the grass roots level.
And demand is just not there to drive prices higher anymore.
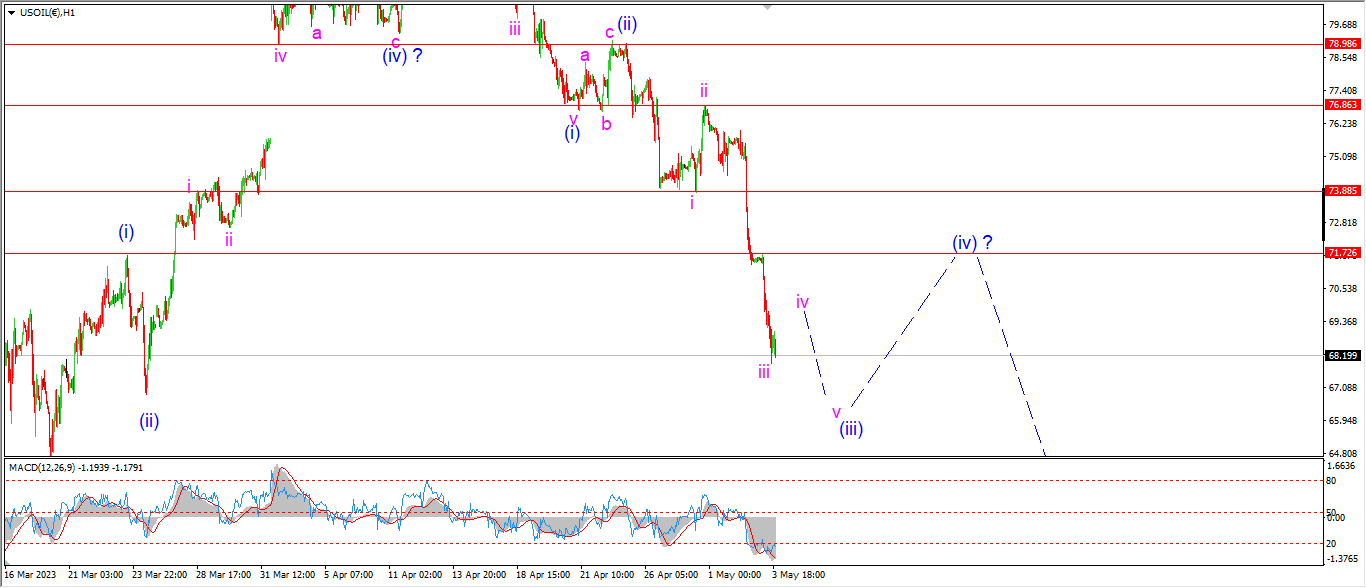
The price has now almost retraced all of the recent rally into the 83.00 level at wave ‘2’.
This decline is labelled as wave [i] of ‘3’,
and at the moment the price is surely moving that way.
The acceleration lower this week is viewed as wave (iii) of [i] of ‘3’.
and that pattern is getting close to full now.
Wave (iii) may have one more step lower to complete its pattern as shown.
So wave ‘iv’ and ‘v’ should finish up by the end of this week.
Next week will be dominated by a correction higher in wave (iv) blue.
Tomorrow;
Watch for wave ‘iv’ and ‘v’ to complete five waves down near the 66.00 handle over the next few sessions.
S&P 500.
S&P 500 1hr
S&P 500 4hr
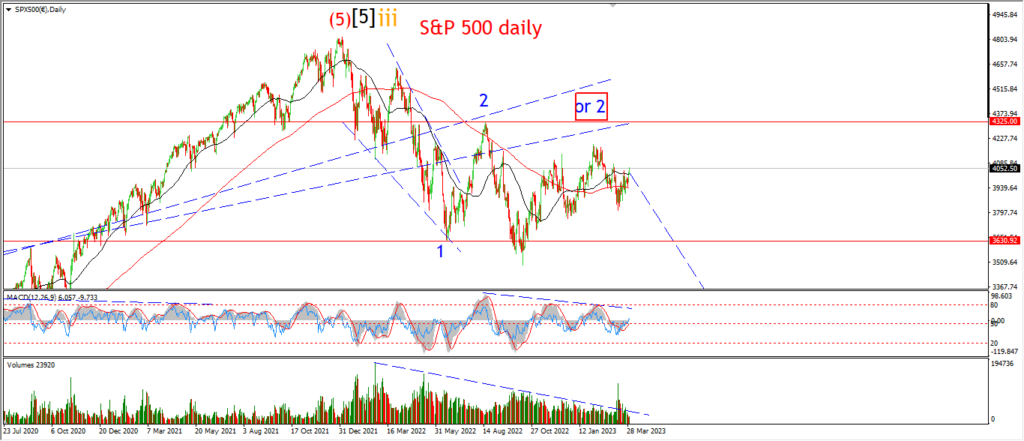
S&P 500 daily.
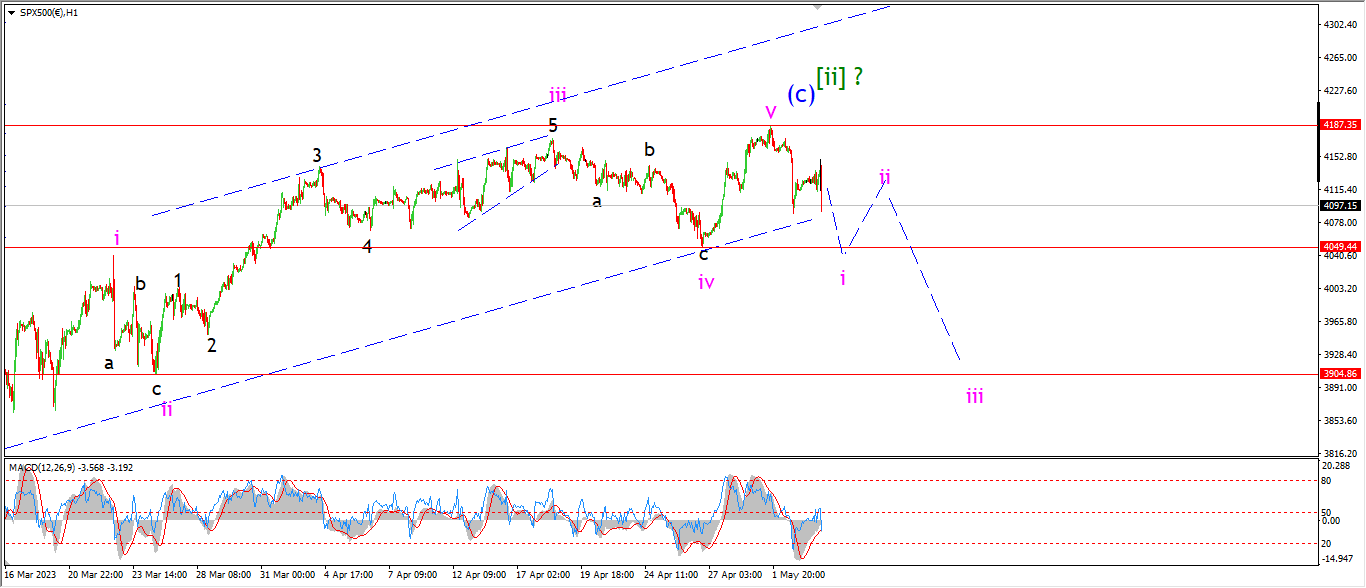
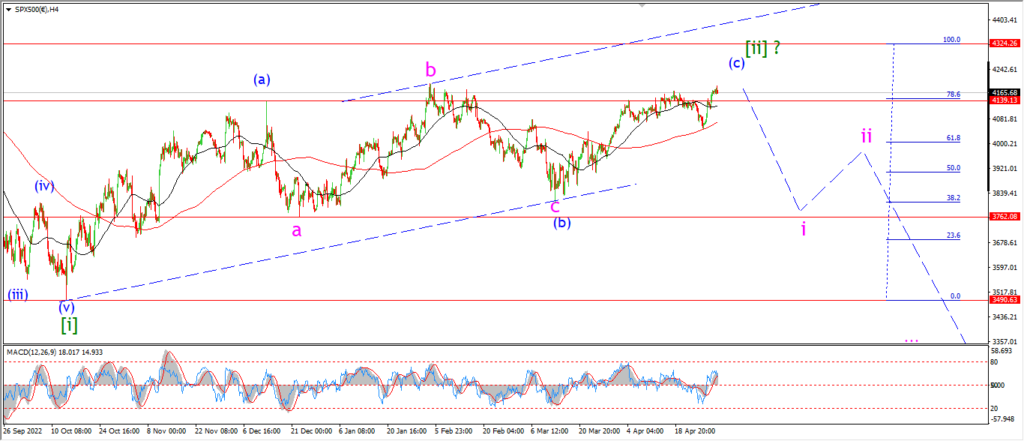
We are taking really small baby steps over the edge of this topping pattern again today.
At the moment, the market seems to be moving towards a turning point again.
Wave ‘i’ of (i) should break the wave ‘iv’ low at 4049 to raise the probability of a top here.
It is early days in this pattern again.
So lets see how the market moves into the end of this week and if the reversal can build again.
Tomorrow;
Watch for wave ‘i’ down to break the wave ‘iv’ lows at 4049.
The next level of importance lies at the wave ‘i’ high of 3904.
SILVER.
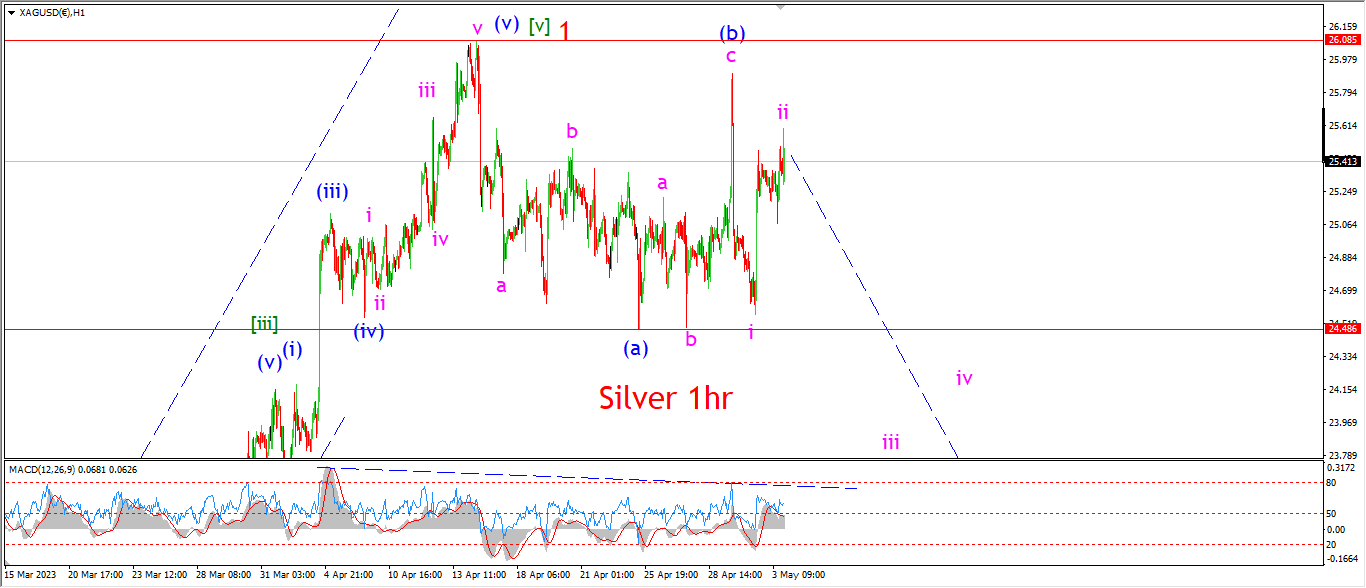
SILVER 1hr
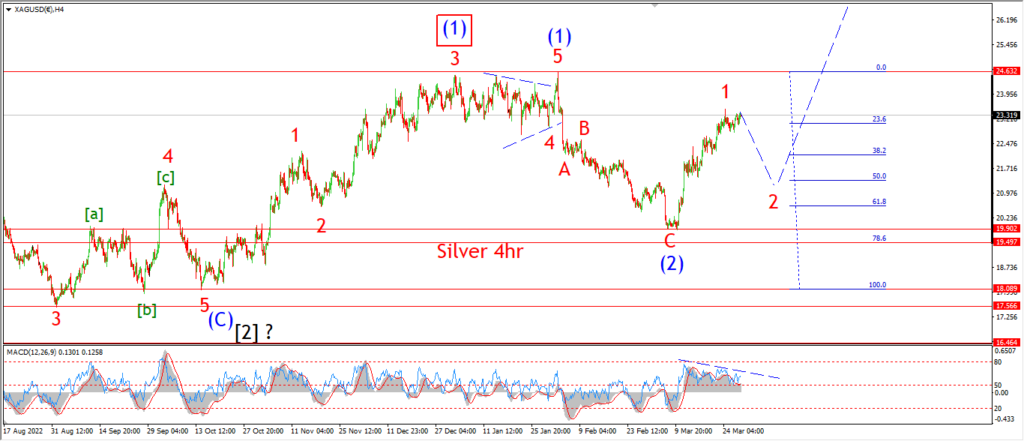
SILVER 4hr.
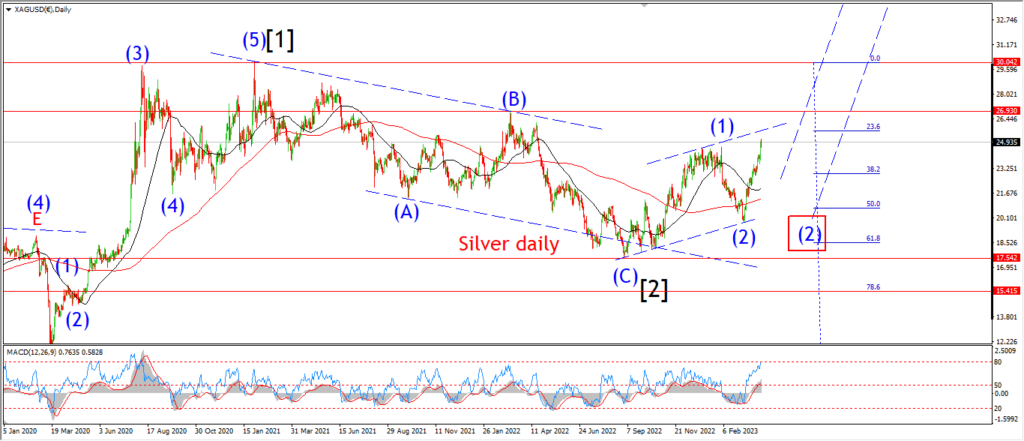
SILVER daily.
What a whipsaw week in the silver market.
And even with those wild price swings the price has not managed to make a new high yet.
In fact we have a series of lower highs in place now.
Silver is trading much like it did last December and January.
The market flat lined for a few months with intermittant spikes,
but that eventually gave way to a significant decline into the early march lows.
And I am suggesting that something similar is likely to happen again this time as wave ‘2’ completes.
If the lower end of this trading range breaks at the 24.48 level,
I think that will be enough to confirm wave ‘2’ is underway.
Tomorrow;
Watch for wave (c) of [a] of ‘2’ to continue lower in five waves as shown.
24.48 is the initial target for this decline.
BITCOIN
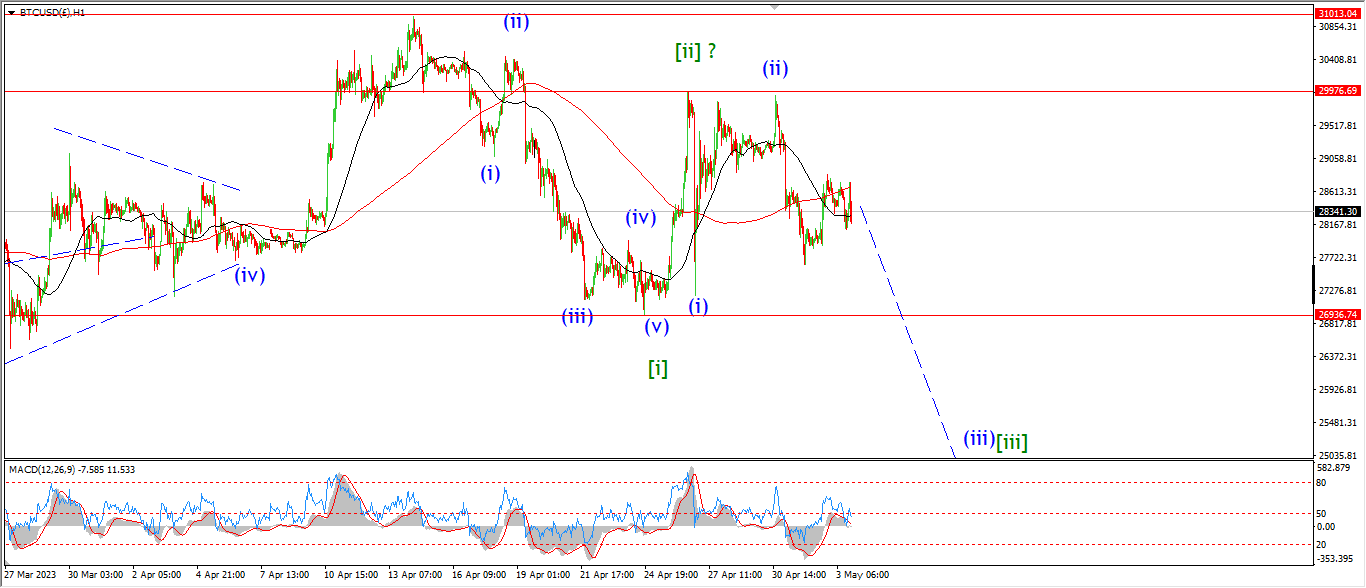
BITCOIN 1hr.

BITCOIN 4hr.
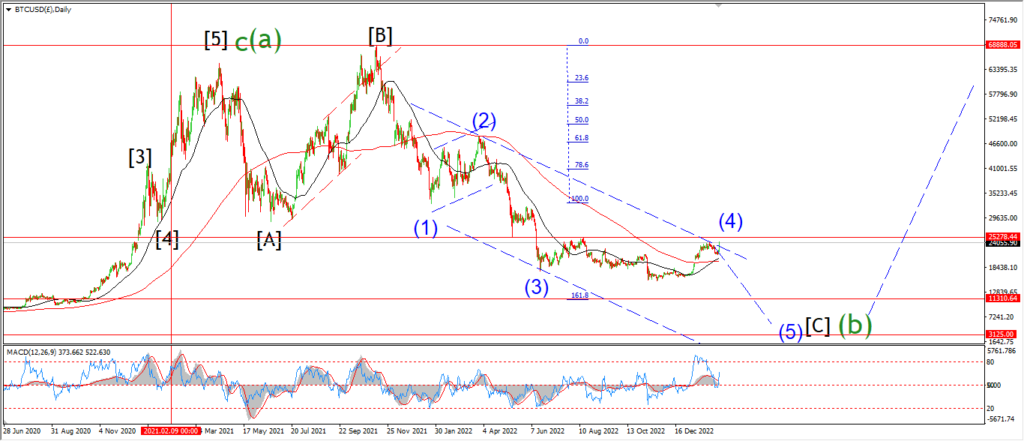
BITCOIN daily.
….
FTSE 100.
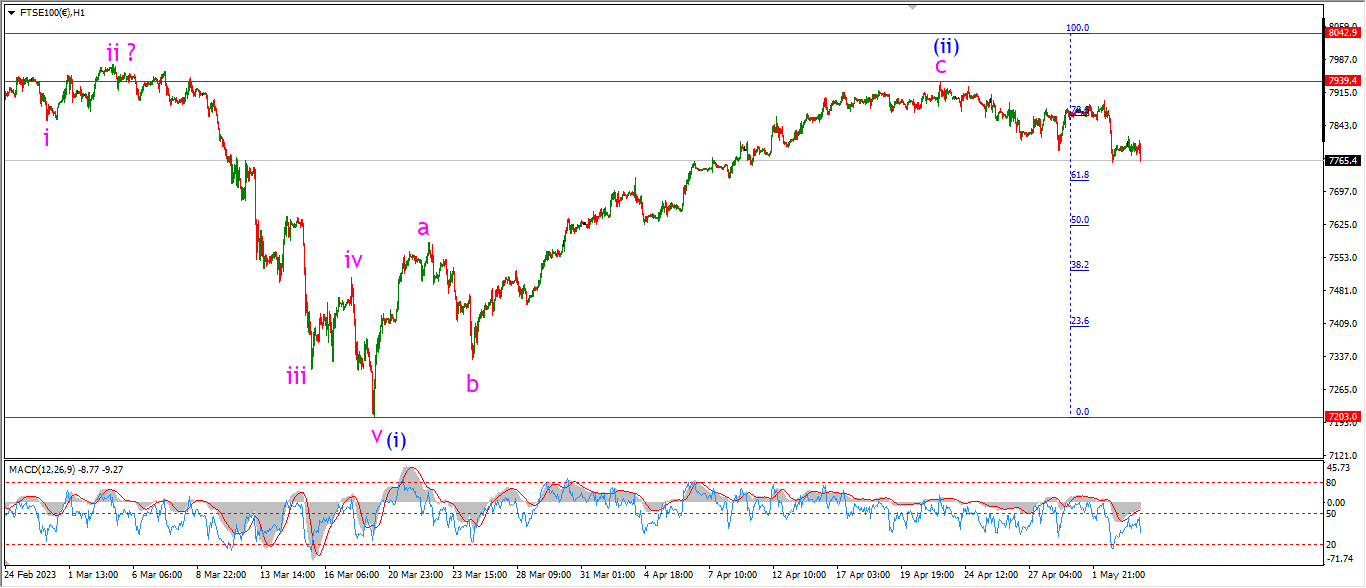
FTSE 100 1hr.
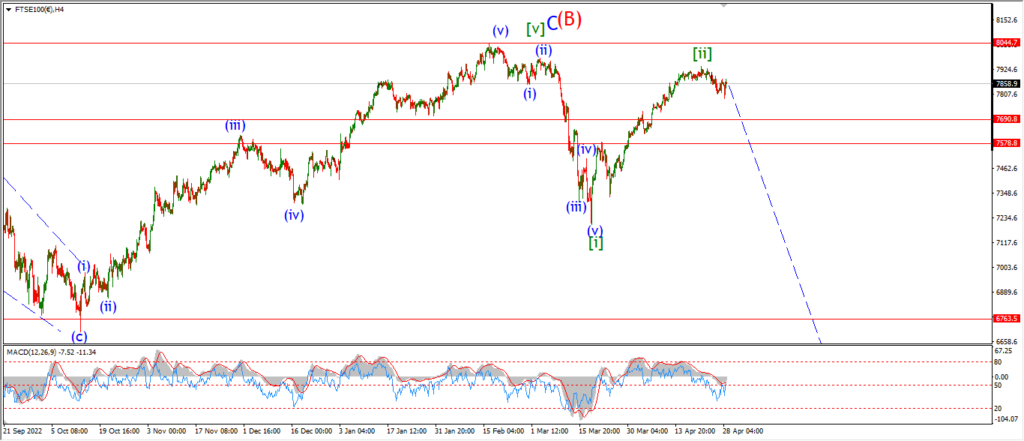
FTSE 100 4hr.

FTSE 100 daily.
….
DAX.
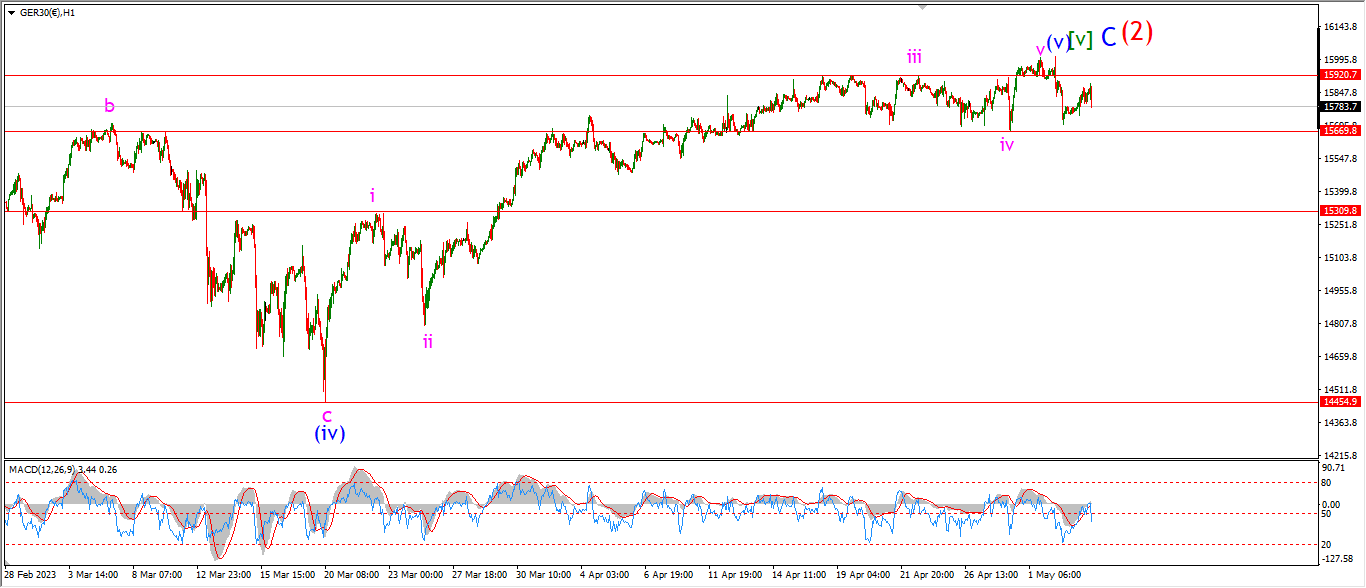
DAX 1hr
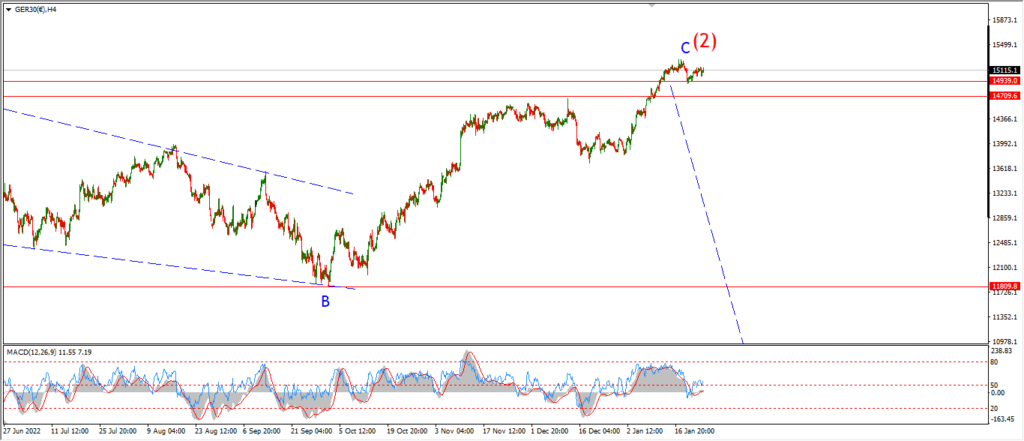
DAX 4hr

DAX daily.
….
NASDAQ 100.
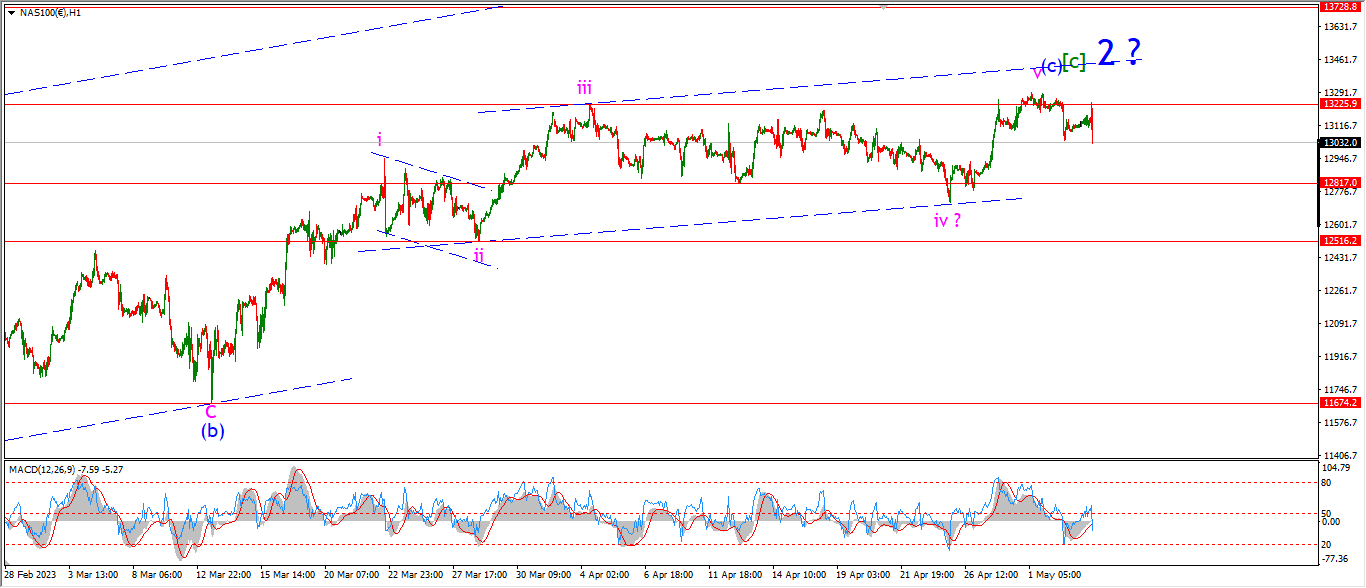
NASDAQ 1hr
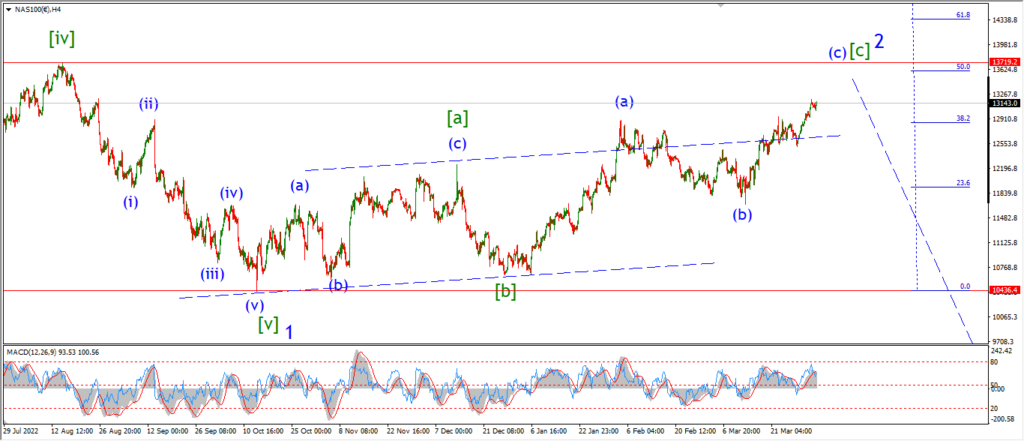
NASDAQ 4hr.

NASDAQ daily.
….