
[vc_row][vc_column][vc_separator border_width=”5″][/vc_column][/vc_row]
[vc_row][vc_column][vc_column_text]
Good evening everyone.
I know you guys and gals don’t need to be told that the underlying foundation of the economy has fully rotted out.
But, as a grounding mechanism for myself,
I like to take a wide angle view now and again to see the lay of the land.
So here it goes.
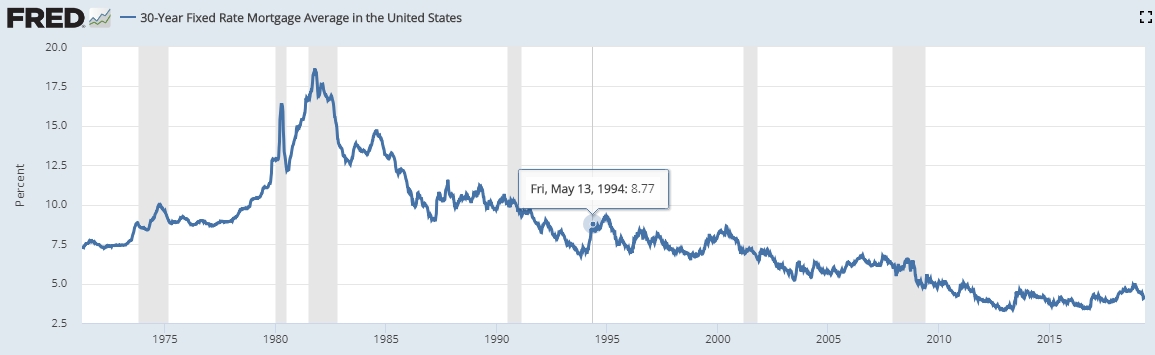
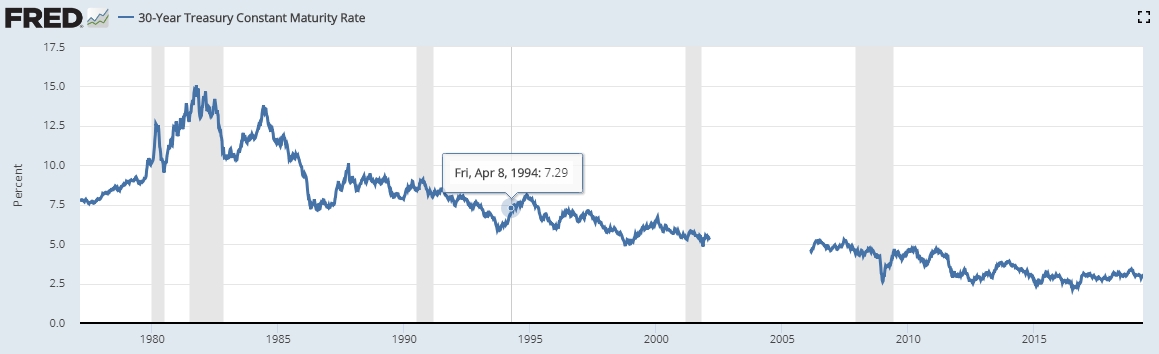
Mortgages:
The housing market today, is built on a declining cycle of rates on long term debt securities.
A bull market in the treasuries has been ongoing for 30 years.
As the credit worthiness of the govt went up,
so rates began a long slide into the recent lows in 2016.
This half cycle has ended,
And so has the half cycle of declining mortgage rates.
Therefore, the corresponding continuation of higher priced real estate has ended.
The next big cycle is the one that nobody is prepared for.
And that is a new bear market in long term treasuries and a rising rate cycle that will likely last a good ten years at least.
Wave good bye to a thirty YR mortgage at 4%,
but say hello to a housing crash that will dwarf the 2008 debacle.
In twenty years, people will buy their first home for about 1X of the income!
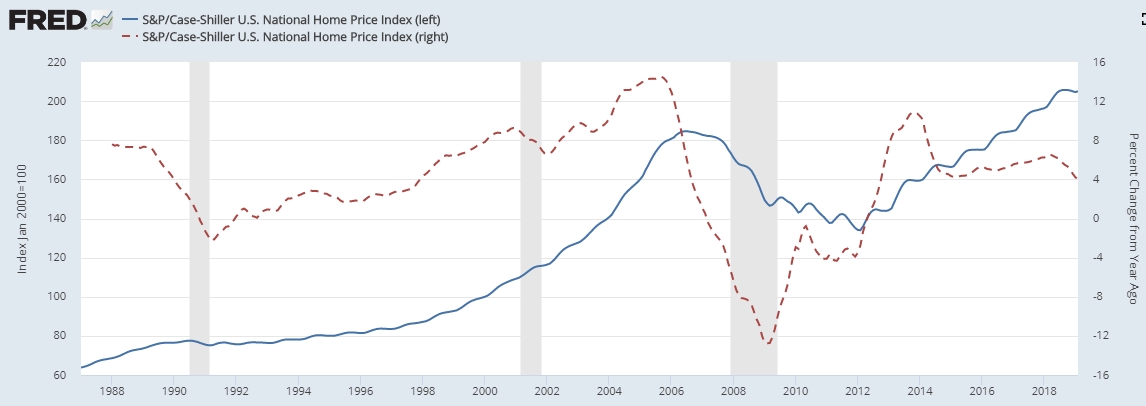
House prices:
The housing market is already beginning to show signs of stress.
The rate of change of prices has been slowing down since 2014.
When the red line goes negative again you will know that the gig is up for housing.
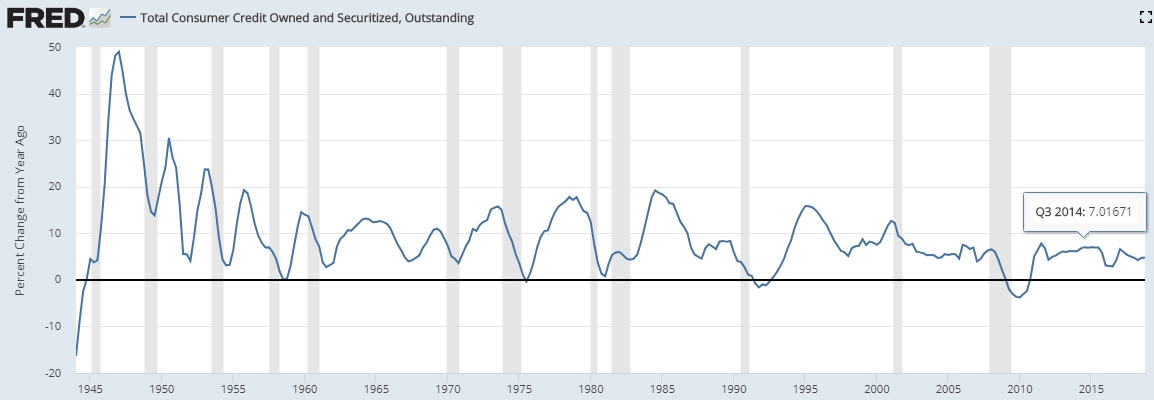
Credit;
The chart below shows the cycle of consumer credit since the 1940’s.
And you can see that we are in the late stages of the credit expansion cycle since that time.
Each shorter term cycle high has been on a decline since the mid nineties!
And every mania htat has occurred since then has been at lower and lower expansion rates.
The current minor cycle since the 2009 lows is anemic at best when compared to all previous cycles.
And the next time we go negative, I expect it to say that way for a while.
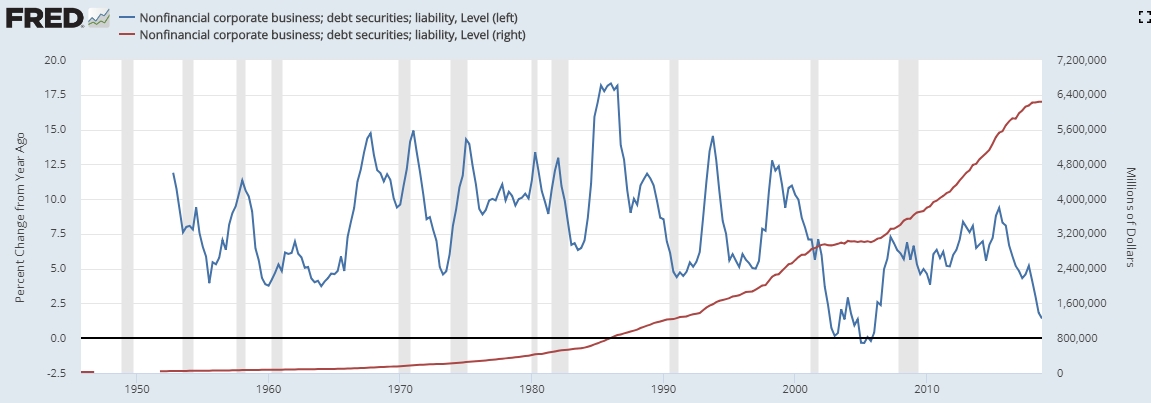
Corporate debt crash underway;
Corporations have been on a debt binge this last 10 years.
Corporations took 50 years to amass 3 trillion in debt.
And they have doubled that amount in the last 10 years!
And what has been achieved?
have the number of jobs doubled in the last 10 years?
Or have they simply pumped their own stock price on the credit card?
Take note,
the corporate debt bubble has popped!!!
And debt load will have to be paid, or it will crash the banking system, again!
And oh by the way,
When the buybacks stop, who’s going to buy?
 [/vc_column_text][/vc_column][/vc_row]
[_s2If current_user_can(access_s2member_ccap_eurusd)]
[vc_row][vc_column][vc_separator border_width=”5″][/vc_column][/vc_row]
[vc_row][vc_column][vc_column_text]
EURUSD
[/vc_column_text][/vc_column][/vc_row]
[vc_row][vc_column][vc_separator border_width=”5″][/vc_column][/vc_row][vc_row][vc_column width=”2/3″][vc_custom_heading text=”1 hr” use_theme_fonts=”yes”][vc_column_text]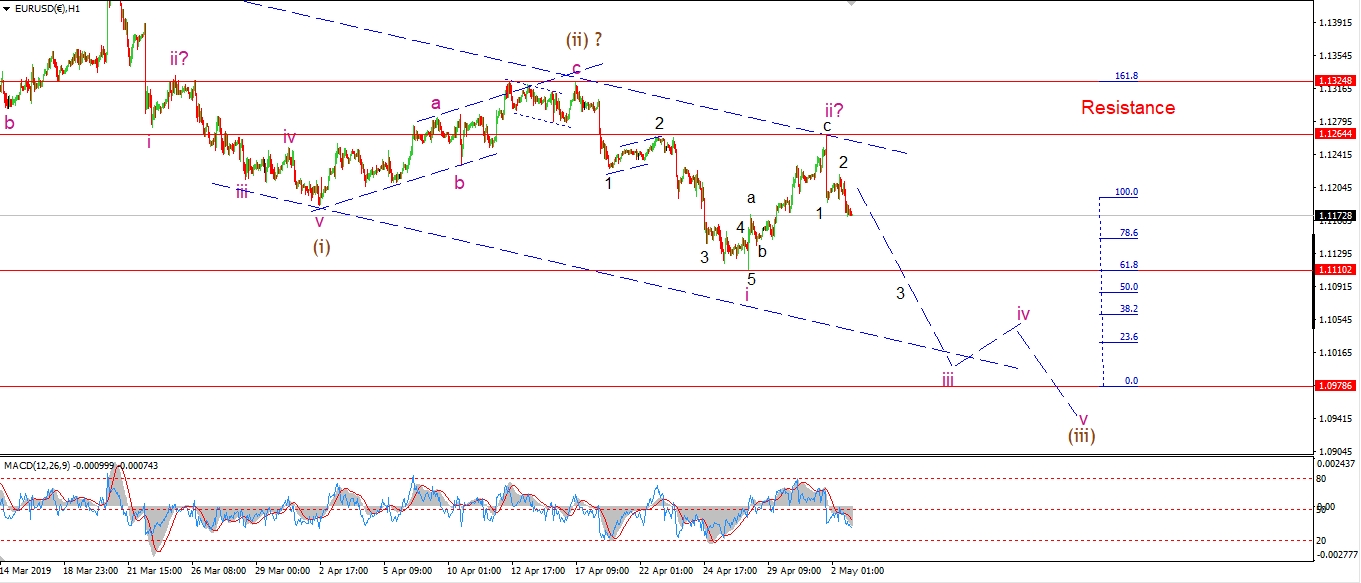 [/vc_column_text][/vc_column][vc_column width=”1/3″][vc_custom_heading text=”4 Hours” use_theme_fonts=”yes”][vc_column_text]
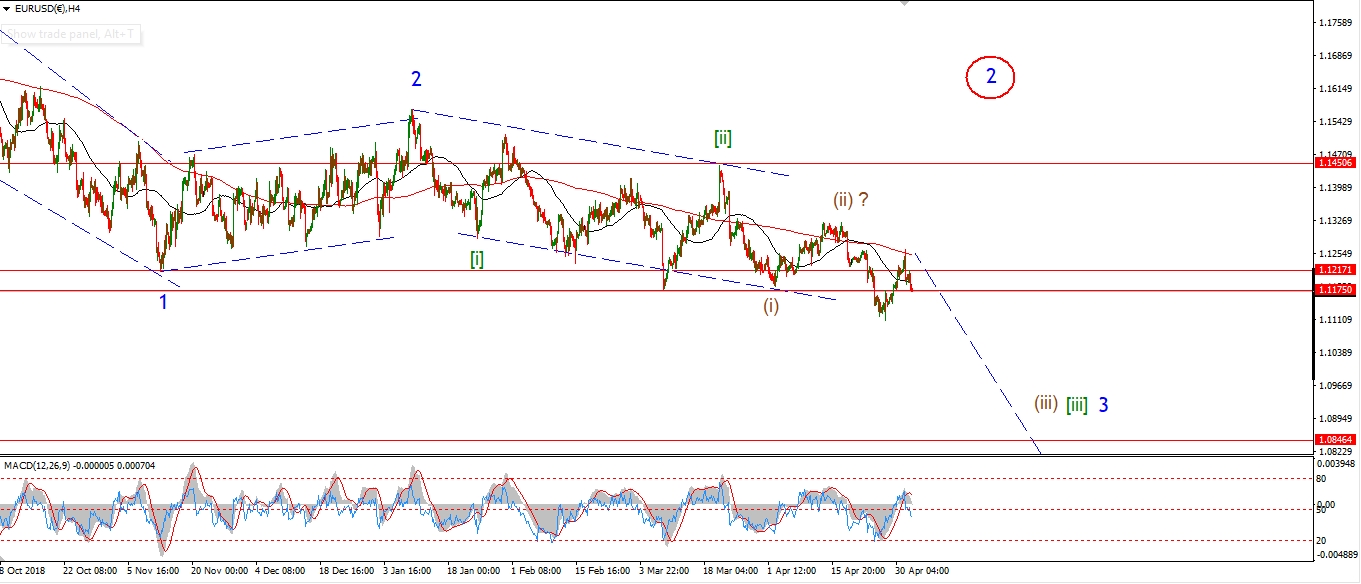 [/vc_column_text][vc_custom_heading text=”Daily” use_theme_fonts=”yes”][vc_column_text]
 [/vc_column_text][/vc_column][/vc_row]
[vc_row][vc_column][vc_column_text]
EURUSD is down again today,
although the decline is only in three waves so far,
so we have to see further declines tomorrow to get wave ‘iii’ underway correctly.
I have shown the decline off the high as waves ‘1’ and ‘2’ of ‘iii’.
Wave ‘iii’ should now hold below 1.1264 from here,
and then accelerate lower over the coming days.
the larger wave (iii) is targeted to 1.0978,
where wave (iii) reaches 162% of wave (i).
Tomorrow;
Watch for wave 1.1264 to hold and wave ‘iii’ to continue lower.
[/vc_column_text][/vc_column][/vc_row]
[/_s2If]
[_s2If current_user_can(access_s2member_ccap_gbpusd)]
[vc_row][vc_column][vc_separator border_width=”5″][/vc_column][/vc_row][vc_row][vc_column][vc_column_text]
GBPUSD
[/vc_column_text][/vc_column][/vc_row][vc_row][vc_column][vc_separator border_width=”5″][/vc_column][/vc_row][vc_row][vc_column width=”2/3″][vc_custom_heading text=”1 hr” use_theme_fonts=”yes”][vc_column_text]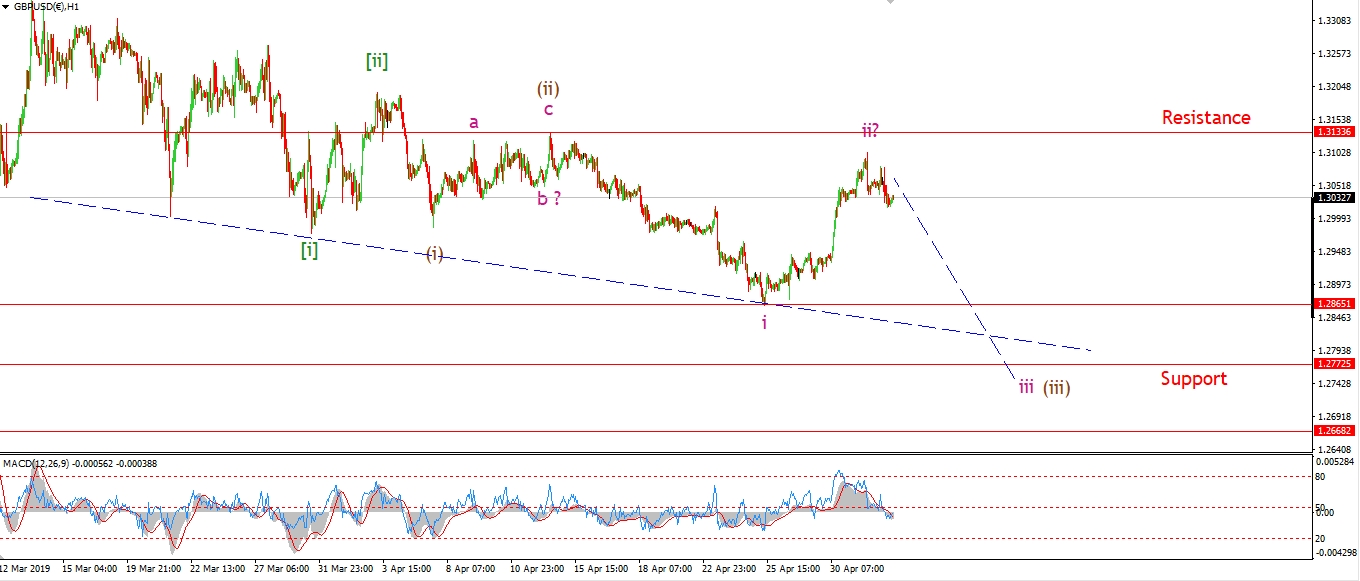 [/vc_column_text][/vc_column][vc_column width=”1/3″][vc_custom_heading text=”4 Hours” use_theme_fonts=”yes”][vc_column_text]
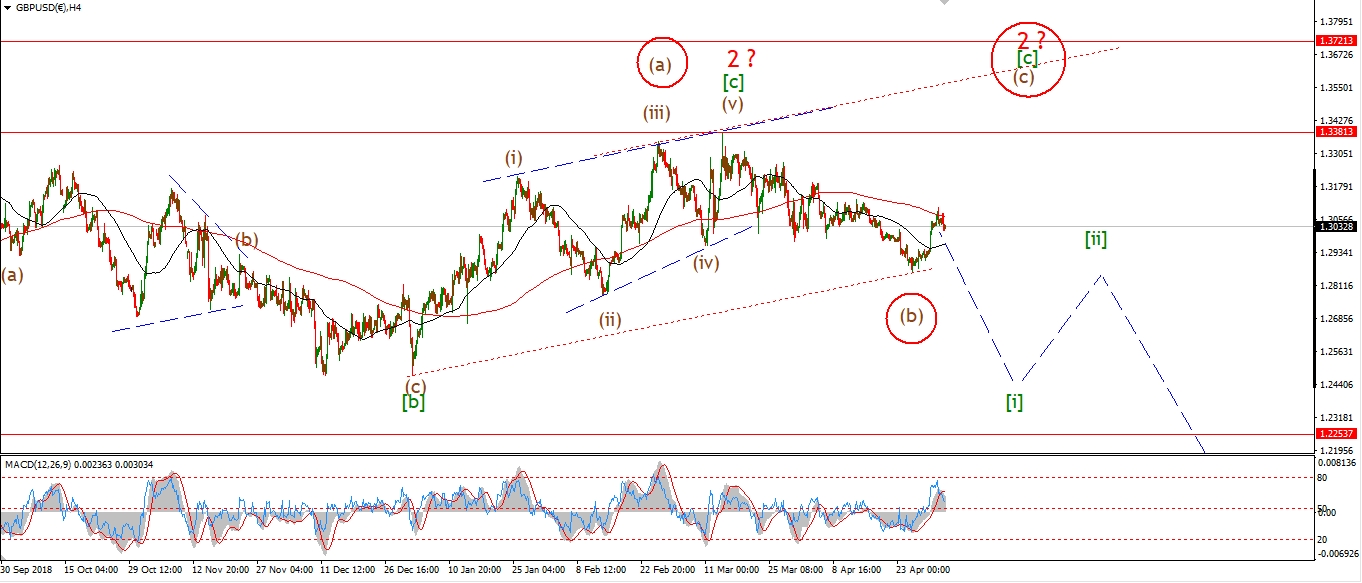 [/vc_column_text][vc_custom_heading text=”Daily” use_theme_fonts=”yes”][vc_column_text]
 [/vc_column_text][/vc_column][/vc_row]
[vc_row][vc_column][vc_column_text]
The pattrern in cable has not cleared up yet after four more trading days.
The alternate pattern on the 4hr chart
would allow for a rally back up to 1.3381 again in wave (c) of [c] of ‘2’.
I am going to watch this alternate count closely over the next couple of sessions.
If the expected decline in wave (iii) of [i] does not occur.
Then I will move to the alternate count.
Tomorrow;
1.3133 must hold and wave ‘iii’ of (iii) down will be confirmed with a break of 1.2865.
[/vc_column_text][/vc_column][/vc_row]
[/_s2If]
[_s2If current_user_can(access_s2member_ccap_usdjpy)]
[vc_row][vc_column][vc_separator border_width=”5″][/vc_column][/vc_row][vc_row][vc_column][vc_column_text]
USDJPY
[/vc_column_text][/vc_column][/vc_row][vc_row][vc_column][vc_separator border_width=”5″][/vc_column][/vc_row][vc_row][vc_column width=”2/3″][vc_custom_heading text=”1 hr” use_theme_fonts=”yes”][vc_column_text]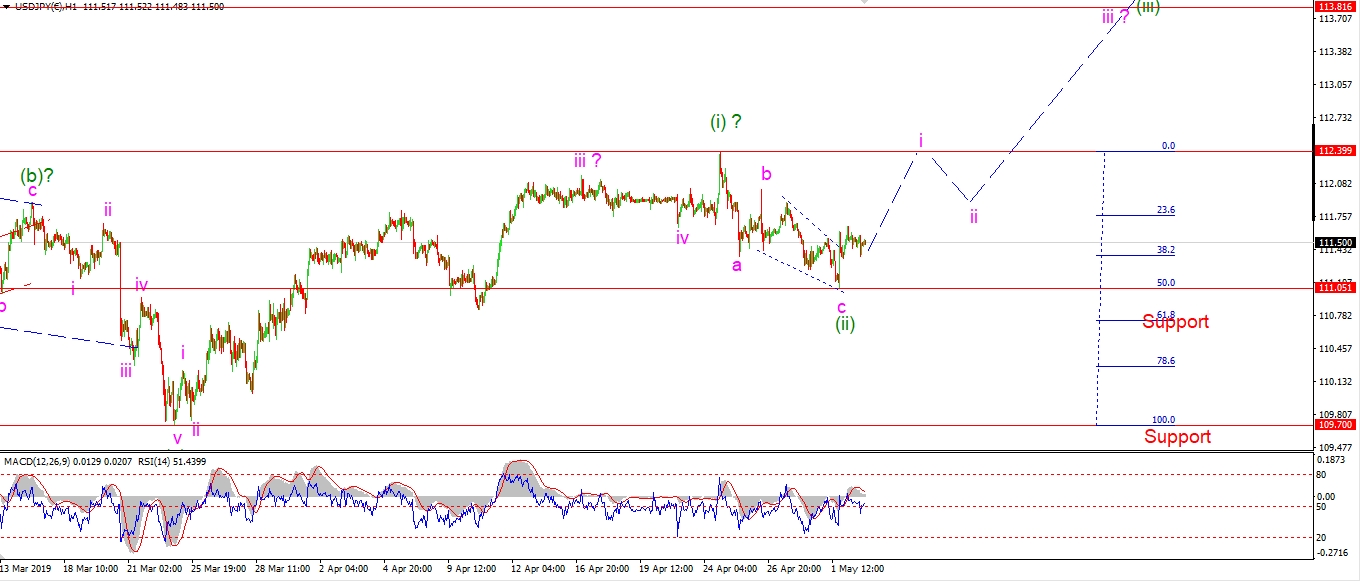 [/vc_column_text][/vc_column][vc_column width=”1/3″][vc_custom_heading text=”4 Hours” use_theme_fonts=”yes”][vc_column_text]
 [/vc_column_text][vc_custom_heading text=”Daily” use_theme_fonts=”yes”][vc_column_text]
 [/vc_column_text][/vc_column][/vc_row]
[vc_row][vc_column][vc_column_text]
USDJPY is holding off the lows of wave (ii) so far today.
The action looks corrective today,
so this may be a minor impulse wave to begin wave ‘i’ of (iii).
Wave (iii) will be confirmed if we see a rally above 112.39.
Tomorrow;
Watch for 111.05 to hold at wave (ii).
Wave ‘i’ of (iii) should continue higher.
[/vc_column_text][/vc_column][/vc_row]
[/_s2If]
[_s2If current_user_can(access_s2member_ccap_dow_jones)]
[vc_row][vc_column][vc_separator border_width=”5″][/vc_column][/vc_row][vc_row][vc_column][vc_column_text]
DOW JONES INDUSTRIALS
[/vc_column_text][/vc_column][/vc_row][vc_row][vc_column][vc_separator border_width=”5″][/vc_column][/vc_row][vc_row][vc_column width=”2/3″][vc_custom_heading text=”1 hr” use_theme_fonts=”yes”][vc_column_text]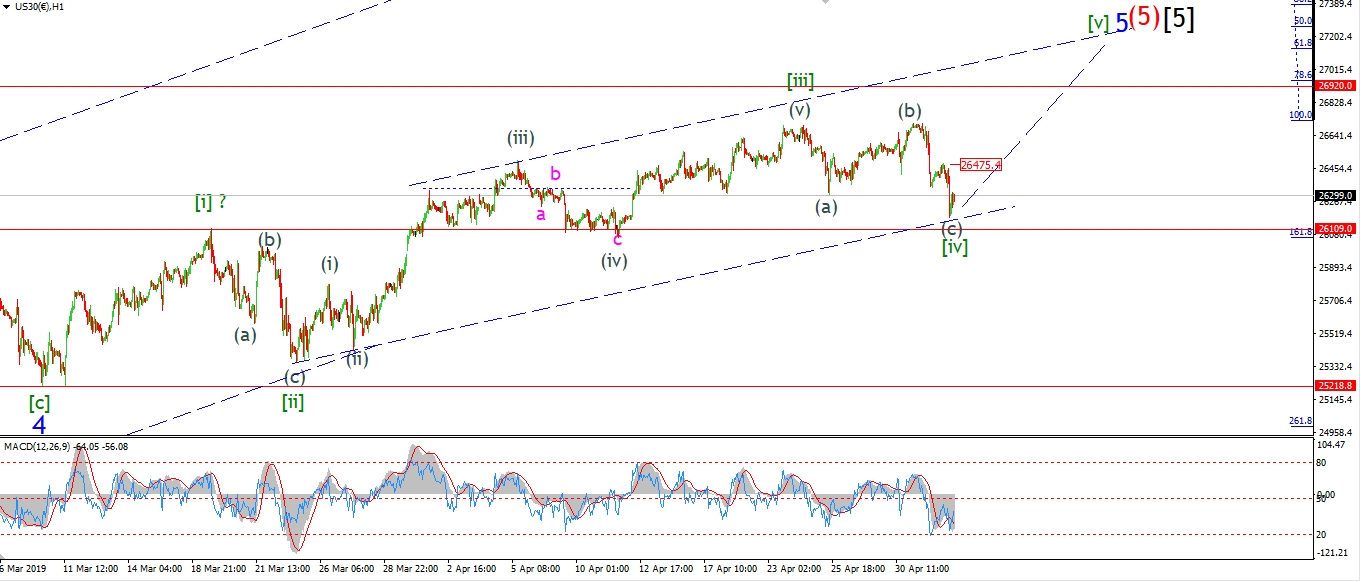 [/vc_column_text][/vc_column][vc_column width=”1/3″][vc_custom_heading text=”4 Hours” use_theme_fonts=”yes”][vc_column_text]
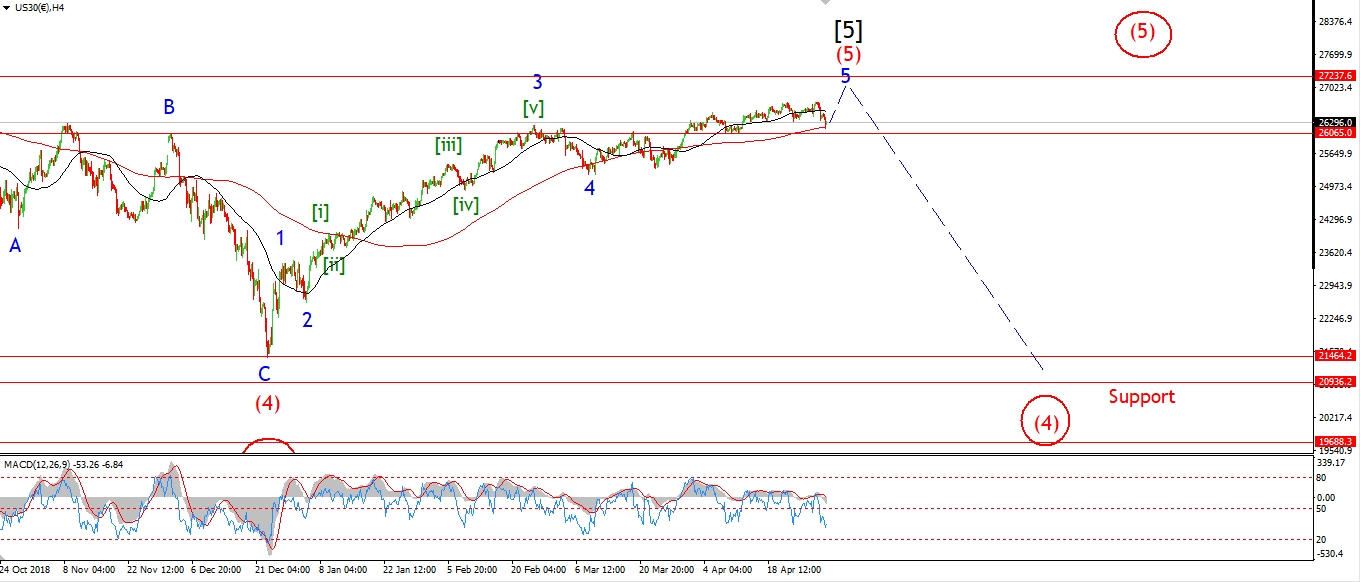 [/vc_column_text][vc_custom_heading text=”Daily” use_theme_fonts=”yes”][vc_column_text]
 [/vc_column_text][/vc_column][/vc_row]
[vc_row][vc_column][vc_column_text]
The DOW is down again today which ruled out the suggested count last night.
We are fast moving to the end of this structure now.
And the bullish options are fading with every decline.
So we are down to a few remaining scenarios.
The new wave count tonight
is further along the structure in wave ‘5’ blue compared to the recent wave counts.
The sideways action over the last few sessions,
is viewed as a running flat wave [iv].
With only wave [v] left to complete the pattern in wave ‘5’ blue.
Which will complete a five wave pattern off the late December lows as shown on the 4hr chart.
On the short term chart,
The price must hold above 26109 at wave [i] for this wave count to hold.
So we are even close to the edge with this interpretation.
Tomorrow;
Watch for price to hold above 26109 and for wave [v] to begin with a spike above 26470 again.
On the lower end,
25218 is the cut off point for the bull market.
If the price continues lower from here I will switch to a full on bearish mode again.
[/vc_column_text][/vc_column][/vc_row]
[/_s2If]
[_s2If current_user_can(access_s2member_ccap_gold)]
[vc_row][vc_column][vc_separator border_width=”5″][/vc_column][/vc_row][vc_row][vc_column][vc_column_text]
GOLD
[/vc_column_text][/vc_column][/vc_row][vc_row][vc_column][vc_separator border_width=”5″][/vc_column][/vc_row][vc_row][vc_column width=”2/3″][vc_custom_heading text=”1 hr” use_theme_fonts=”yes”][vc_column_text] [/vc_column_text][/vc_column][vc_column width=”1/3″][vc_custom_heading text=”4 Hours” use_theme_fonts=”yes”][vc_column_text]
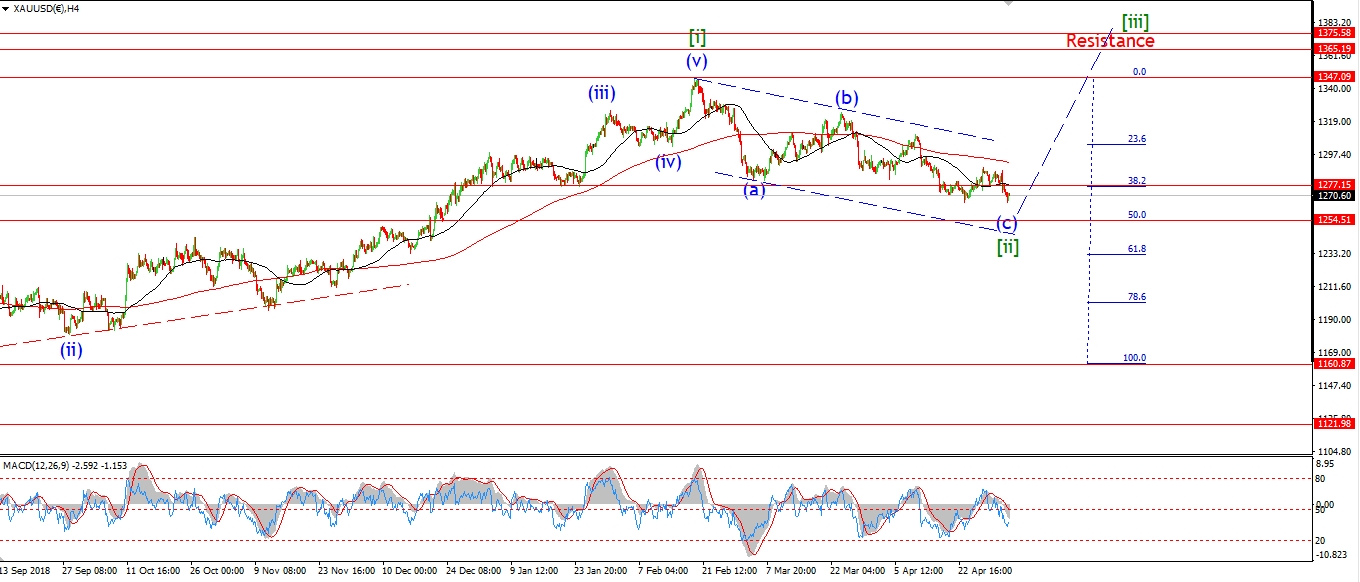 [/vc_column_text][vc_custom_heading text=”Daily” use_theme_fonts=”yes”][vc_column_text]
 [/vc_column_text][/vc_column][/vc_row]
[vc_row][vc_column][vc_column_text]
The invalidation point for the previous wave count lay at 1266.56.
the price reached a low today at 1266.59 before bouncing above 1270 again.
So we have not reached a new low yet in wave (c) yet.
A break of that level will do it,
but I think we are more likely to hit that lower trend line again to complete the diagonal wave (c).
Tomorrow;
Watch for wave ‘v’ of (c) to break 1266.56 again before turning up in wave ‘i’.
[/vc_column_text][/vc_column][/vc_row]
[/_s2If]
[_s2If current_user_can(access_s2member_ccap_crude)]
[vc_row][vc_column][vc_separator border_width=”5″][/vc_column][/vc_row][vc_row][vc_column][vc_column_text]
U.S CRUDE OIL
[/vc_column_text][/vc_column][/vc_row][vc_row][vc_column][vc_separator border_width=”5″][/vc_column][/vc_row][vc_row][vc_column width=”2/3″][vc_custom_heading text=”1 hr” use_theme_fonts=”yes”][vc_column_text]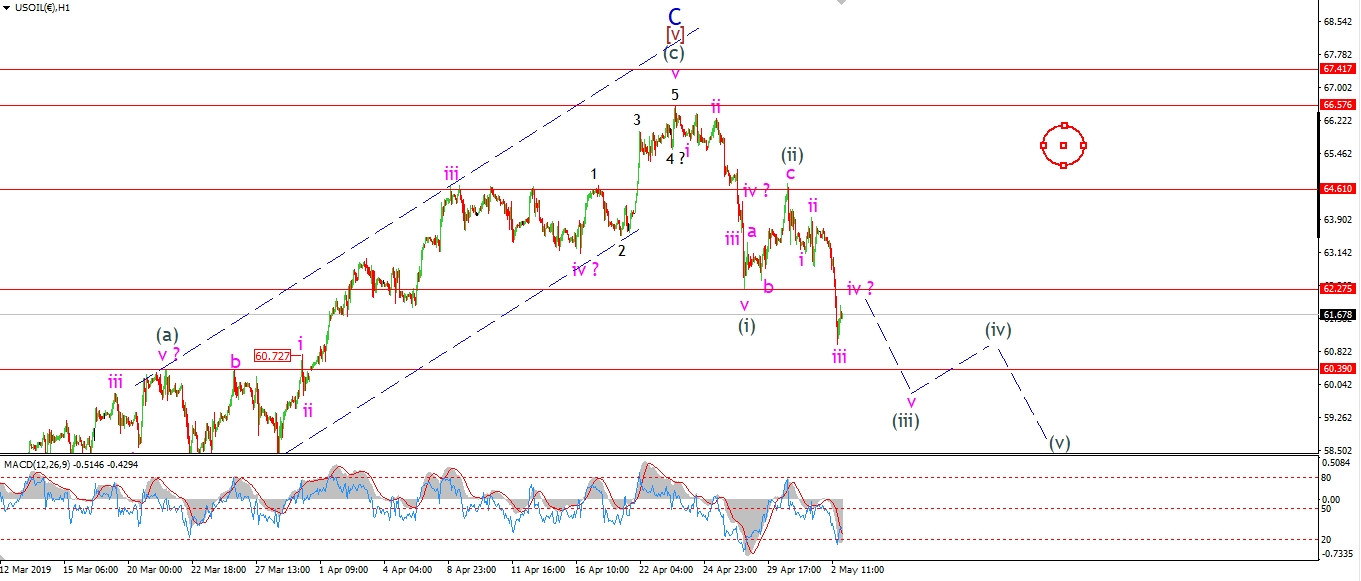 [/vc_column_text][/vc_column][vc_column width=”1/3″][vc_custom_heading text=”4 Hours” use_theme_fonts=”yes”][vc_column_text]
 [/vc_column_text][vc_custom_heading text=”Daily” use_theme_fonts=”yes”][vc_column_text]
 [/vc_column_text][/vc_column][/vc_row]
[vc_row][vc_column][vc_column_text]
A further sharp decline in Crude today ruled out the alternate wave (ii) idea shown last night.
The price broke the wave (i) low in a clear acceleration move.
This is labelled wave ‘iii’ of (iii).
If this short term count is correct,
then the price is likely to continue lower to about 58.50 or so
to complete wave [i] down.
Wave (iii) down should hit 60.40 at a minimum,
This is where wave (i) and (iii) reach equality.
Tomorrow;
The price must now continue lower to trace out a five wave pattern within wave (iii).
Watch for the wave (i) low to offer resistance to wave ‘iv’ tomorrow.
With a further decline in wave ‘v’.
[/vc_column_text][/vc_column][/vc_row]
[/_s2If]
[_s2If current_user_can(access_s2member_ccap_us10yr)]
[vc_row][vc_column][vc_separator border_width=”5″][/vc_column][/vc_row][vc_row][vc_column][vc_column_text]
US 10 yr Treasuries.
[/vc_column_text][/vc_column][/vc_row][vc_row][vc_column][vc_separator border_width=”5″][/vc_column][/vc_row][vc_row][vc_column width=”2/3″][vc_custom_heading text=”1 hr” use_theme_fonts=”yes”][vc_column_text]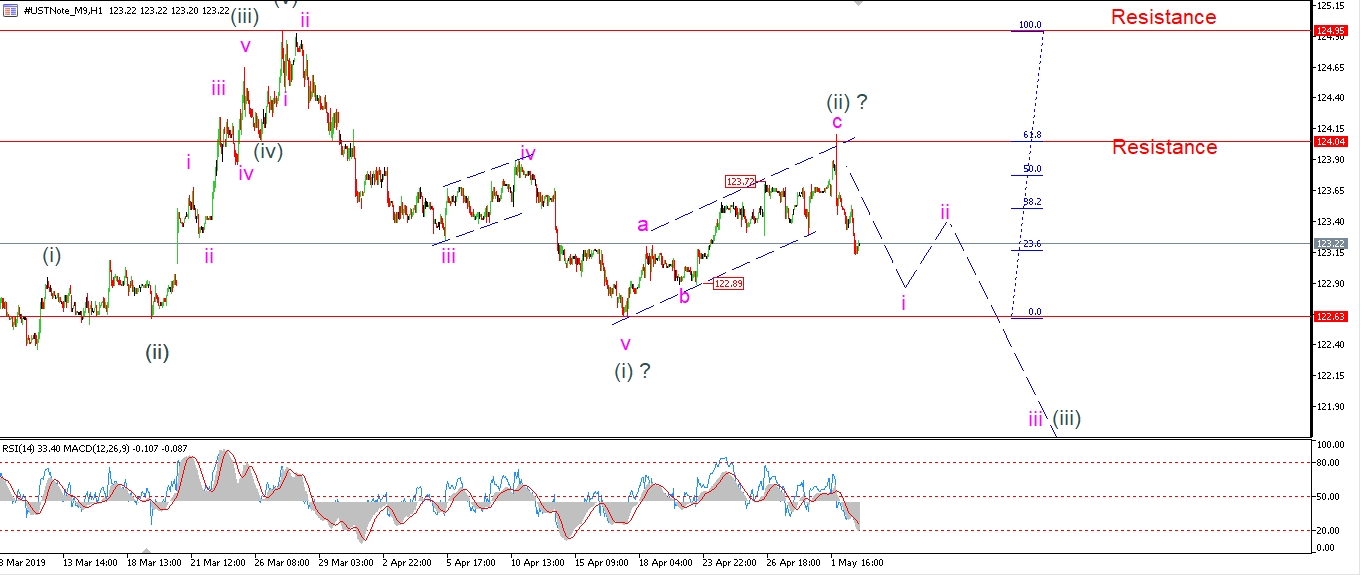 [/vc_column_text][/vc_column][vc_column width=”1/3″][vc_custom_heading text=”4 Hours” use_theme_fonts=”yes”][vc_column_text]
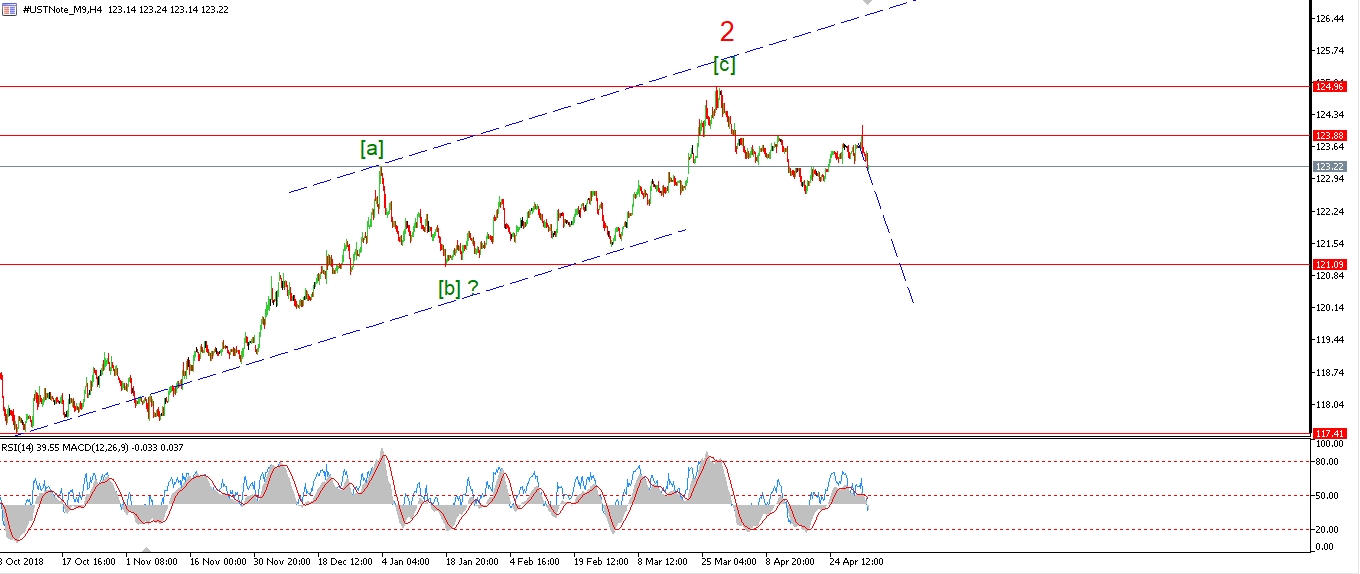 [/vc_column_text][vc_custom_heading text=”Daily” use_theme_fonts=”yes”][vc_column_text]
 [/vc_column_text][/vc_column][/vc_row]
[vc_row][vc_column][vc_column_text]
The 10YR continued lower today in a possible wave ‘i’ of (iii).
the price must break 122.63 to confirm wave (iii),
but that may not occur until wave ‘iii’ of (iii).
So,
if we see a break of the previous wave ‘b’ low at 122.89,
that will signal wave ‘i’ is in force.
Tomorrow;
Watch for the decline in wave ‘i’ to continue.
we should see a bearish lower high complete early next week.
[/vc_column_text][/vc_column][/vc_row]
[/_s2If]
[_s2If current_user_can(access_s2member_ccap_silver)]
[vc_row][vc_column][vc_separator border_width=”5″][/vc_column][/vc_row][vc_row][vc_column][vc_column_text]
SILVER
[/vc_column_text][/vc_column][/vc_row][vc_row][vc_column][vc_separator border_width=”5″][/vc_column][/vc_row][vc_row][vc_column width=”2/3″][vc_custom_heading text=”1 hr” use_theme_fonts=”yes”][vc_column_text]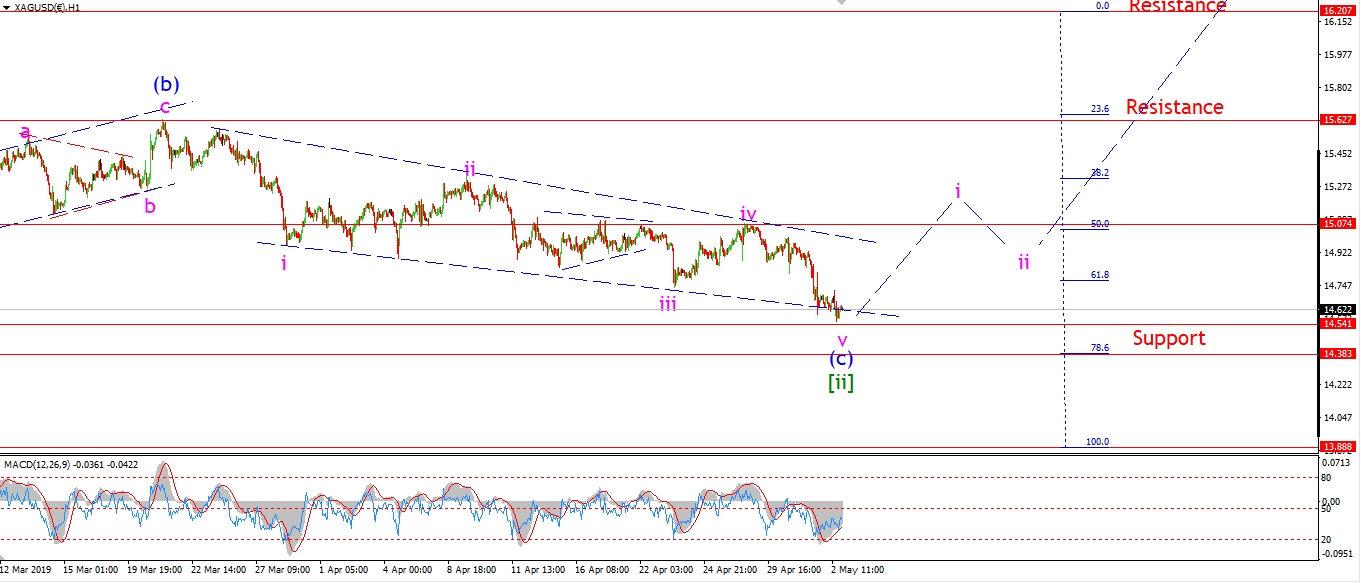 [/vc_column_text][/vc_column][vc_column width=”1/3″][vc_custom_heading text=”4 Hours” use_theme_fonts=”yes”][vc_column_text]
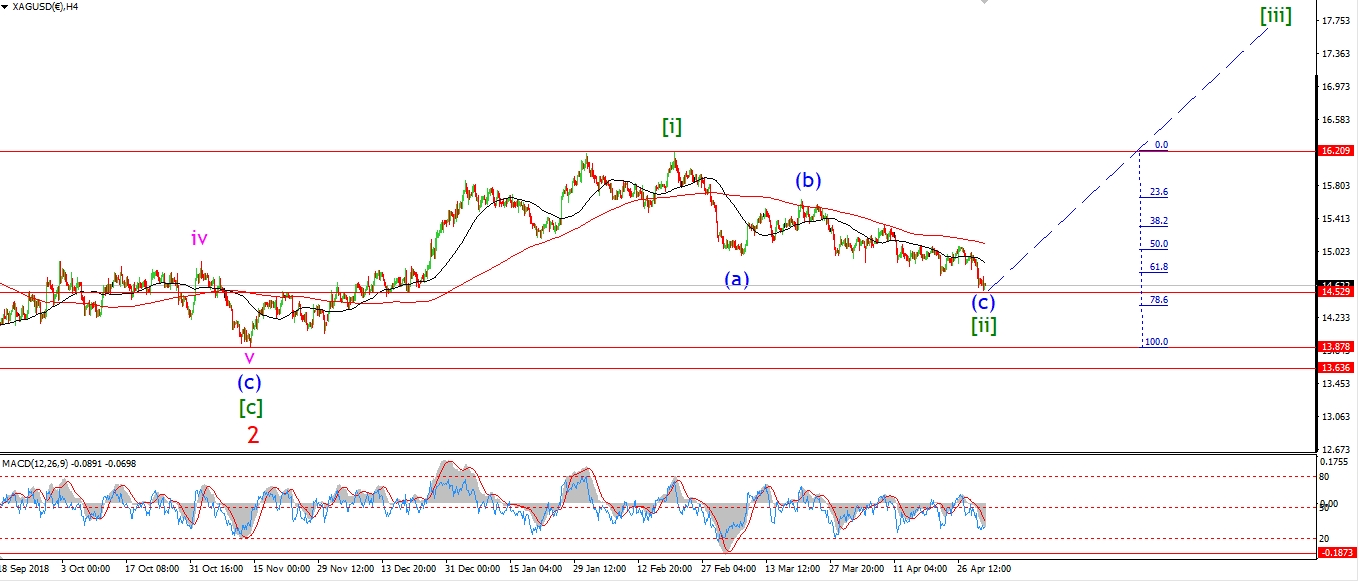 [/vc_column_text][vc_custom_heading text=”Daily” use_theme_fonts=”yes”][vc_column_text]
 [/vc_column_text][/vc_column][/vc_row]
[vc_row][vc_column][vc_column_text]
I think we are days away from a new long term rally in silver and GOLD.
Silver hit a new low at support today at 14.54.
The price has completed a five wave decline in wave (c).
And wave (c) is most likely tracing out an ending diagonal.
Therefore the momentum will be slowing throughout the decline.
The 4hr chart shows just that,
with a bullish higher low in momentum now in place at wave (c) off the wave (a) low.
Tomorrow;
Watch for the initial signals of a turn up again in wave ‘i’
with a push back towards 15.00 again in a five wave pattern.
[/vc_column_text][/vc_column][/vc_row]
[/_s2If]
[_s2If current_user_can(access_s2member_ccap_sp500)]
[vc_row][vc_column][vc_separator border_width=”5″][/vc_column][/vc_row][vc_row][vc_column][vc_column_text]
S&P 500.
[/vc_column_text][/vc_column][/vc_row][vc_row][vc_column][vc_separator border_width=”5″][/vc_column][/vc_row][vc_row][vc_column width=”2/3″][vc_custom_heading text=”1 hr” use_theme_fonts=”yes”][vc_column_text]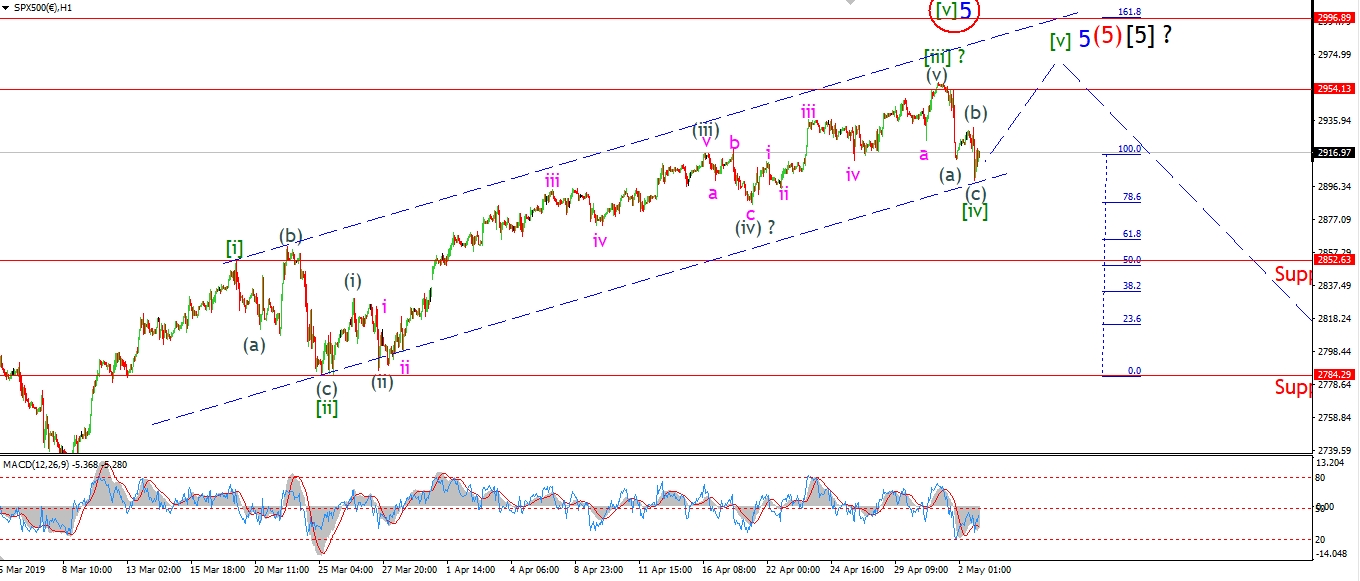 [/vc_column_text][/vc_column][vc_column width=”1/3″][vc_custom_heading text=”4 Hours” use_theme_fonts=”yes”][vc_column_text]
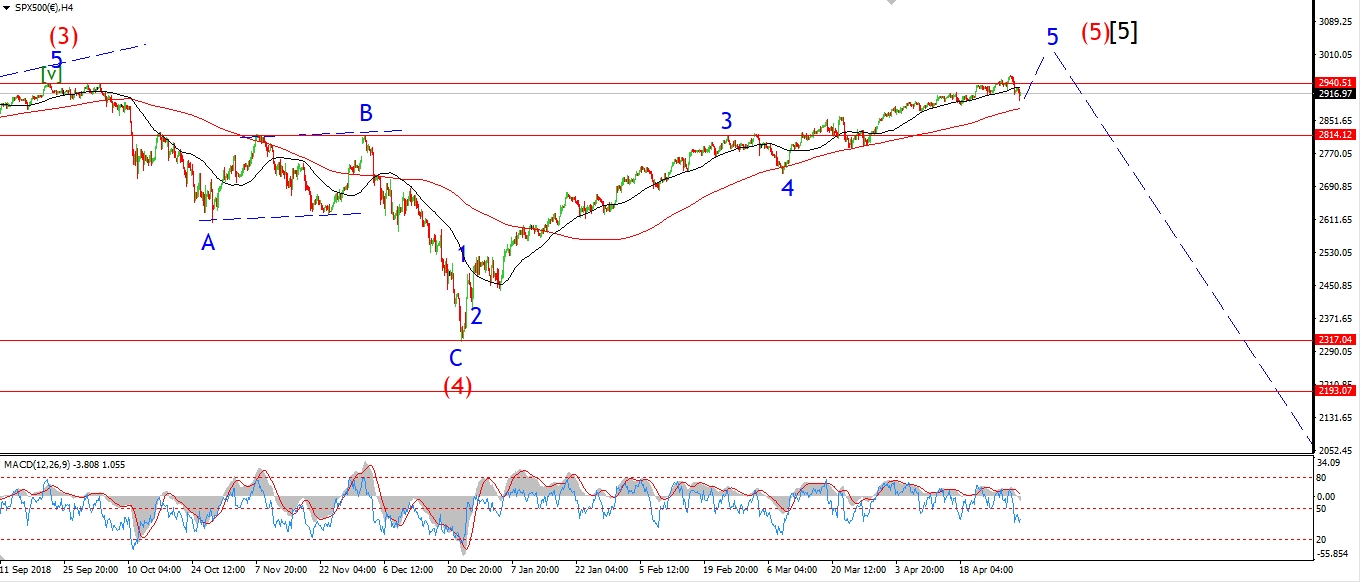 [/vc_column_text][vc_custom_heading text=”Daily” use_theme_fonts=”yes”][vc_column_text]
 [/vc_column_text][/vc_column][/vc_row]
[vc_row][vc_column][vc_column_text]
The S&P now shows a similar count to the DOW this evening,
after a three wave decline off the high,
is labelled as a correction in wave [iv] at todays session lows.
The correction in wave [iv] must now hold above 2852.63 for this wave count to remain valid.
If we see decline off the highs in five waves
that breaks that 2852 level
that will be a very large bearish signal which could not be ignored.
Especially,
as the market has already fulfilled the minimum requirement to complete the bull market,
that is,
a new all time high that was registered this week at 2854.
Tomorrow;
The current wave count is calling for one last high in wave [v] of ‘5’
to complete a five wave pattern off the December lows.
That could happen quite quickly from here.
Watch for todays lows to hold and wave (i) of [v] to continue higher.
[/vc_column_text][/vc_column][/vc_row]
[/_s2If]
[vc_row][vc_column][vc_column_text]
[/vc_column_text][/vc_column][/vc_row]
[vc_row][vc_column][vc_separator border_width=”5″][/vc_column][/vc_row]