
Good evening to one and all.
The Lord’s Blessing’s to you all again tonight.
There are days like today where I feel like I am making excuses for myself all the time.
I underestimated the potential for rally in the stock markets in the short term.
And that is my failing.
I think we have a reasonable explanation in the short term count.
None the less,
the rally came and I was not prepared for that.
As a result I am a little defeated this evening!
But now,
I must pick myself up by the shoe lases and dust myself off to get back on the horse again.
Thank you for your patience.
So here it goes.
https://twitter.com/bullwavesreal
EURUSD.
EURUSD 1hr.
EURUSD 4hr.

EURUSD daily.
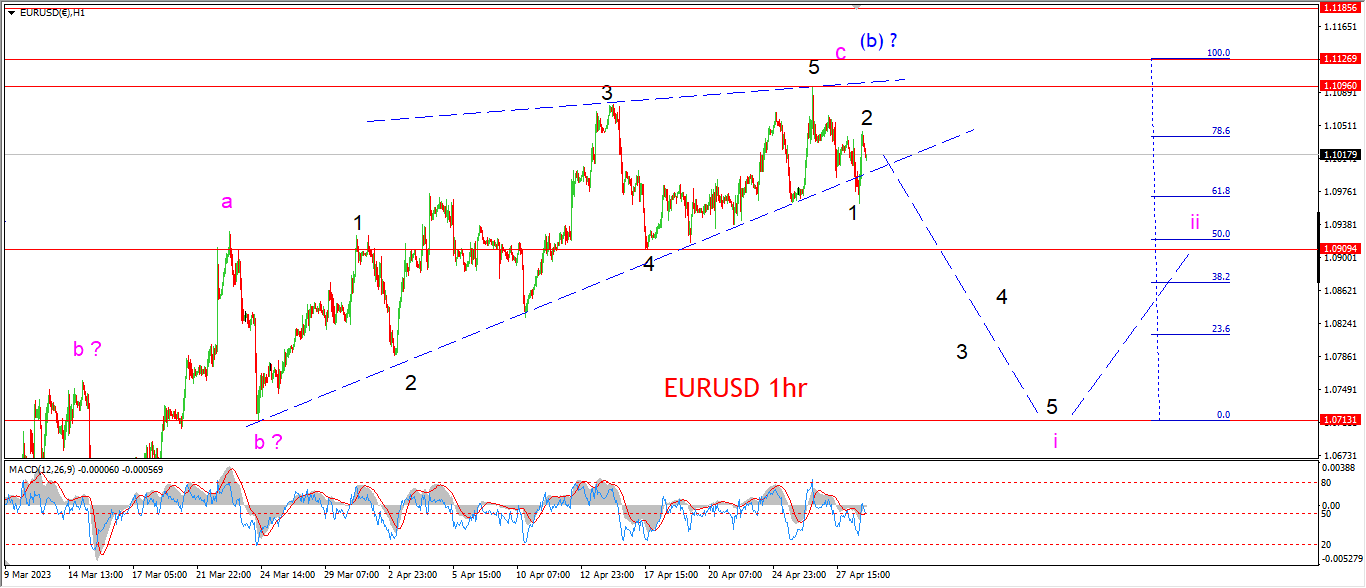
The drop off this weeks high in EURUSD has traced out a wedge in five waves.
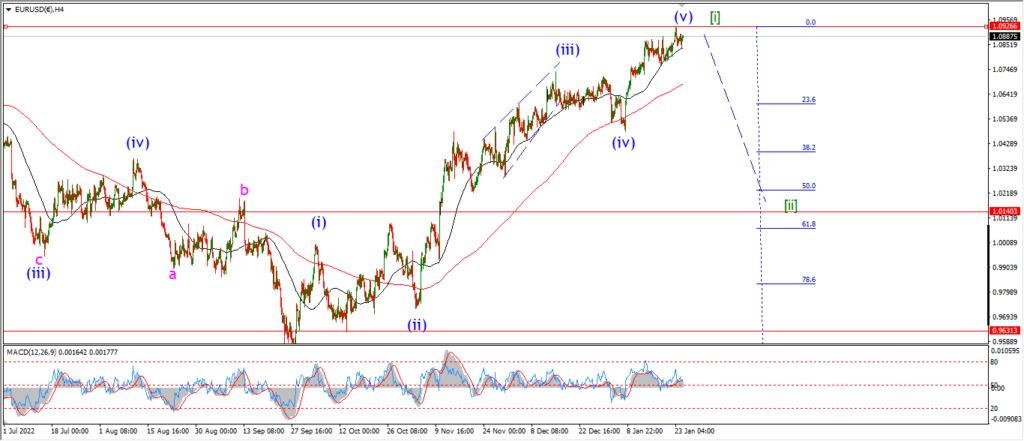
so the short term top potential remains in place here for wave (b).
Wave (c) down in five waves remains my main scenario here.
But that scenario has not been confirmed yet with a notable decline.
Wave ‘i’ down should fall back into 1.0700 again in five waves.
So I will have to wait until early next week for that pattern to begin.
Monday;
Watch for the price to hold below 1.1096 at the wave (b) top.
Wave ‘i’ will be confirmed with a break of 1.0900 again.
GBPUSD
GBPUSD 1hr.
GBPUSD 4hr.

GBPUSD daily.
I have been forced out of the box in cable tonight with that spike rally back to a new high again.
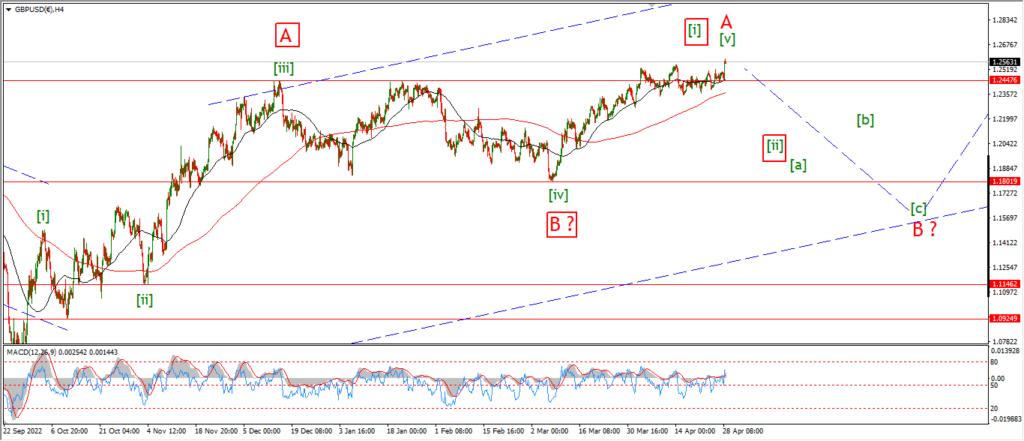
If you take a look at the 4hr chart again you will see the the two counts I am looking at now to explain this action.
You can see that wave ‘A’ and ‘B’ of (2) is still the main overall wave count here.
Wave ‘A’ is now counted into this weeks highs.
With wave [v] of ‘A’ now in play for this current top.
Wave ‘B’ should still carry the price lower over the coming weeks.
And I am looking at a low below 1.1800 to complete this correction.
The alternate count shows a three wave rally in wave ‘A’,
followed by a flat correction in wave ‘B’.
and now a five wave rally underway in wave ‘C’.
Wave [i] of ‘C’ is now topping out.
And wave [ii] of ‘C’ is expected to turn lower over the coming weeks.
Wave [ii] of ‘C’ should fall back into the 1.2000 area in three waves.
Monday;
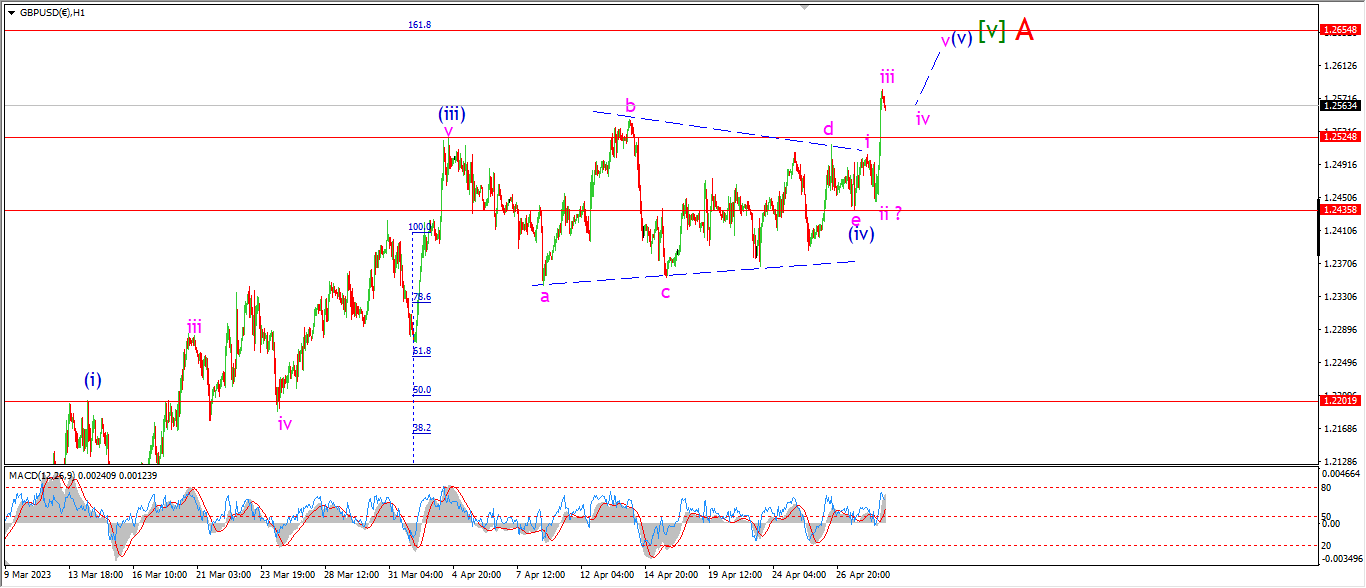
The recent sideways action is viewed as wave (iv) of [v] of ‘A’.
Watch for wave (v) of [v] to top out early next week.
Wave (v) blue is tracing out five waves up as I write so there won’t be much upside left here in this scenario.
USDJPY.
USDJPY 1hr.
USDJPY 4hr.

USDJPY daily.
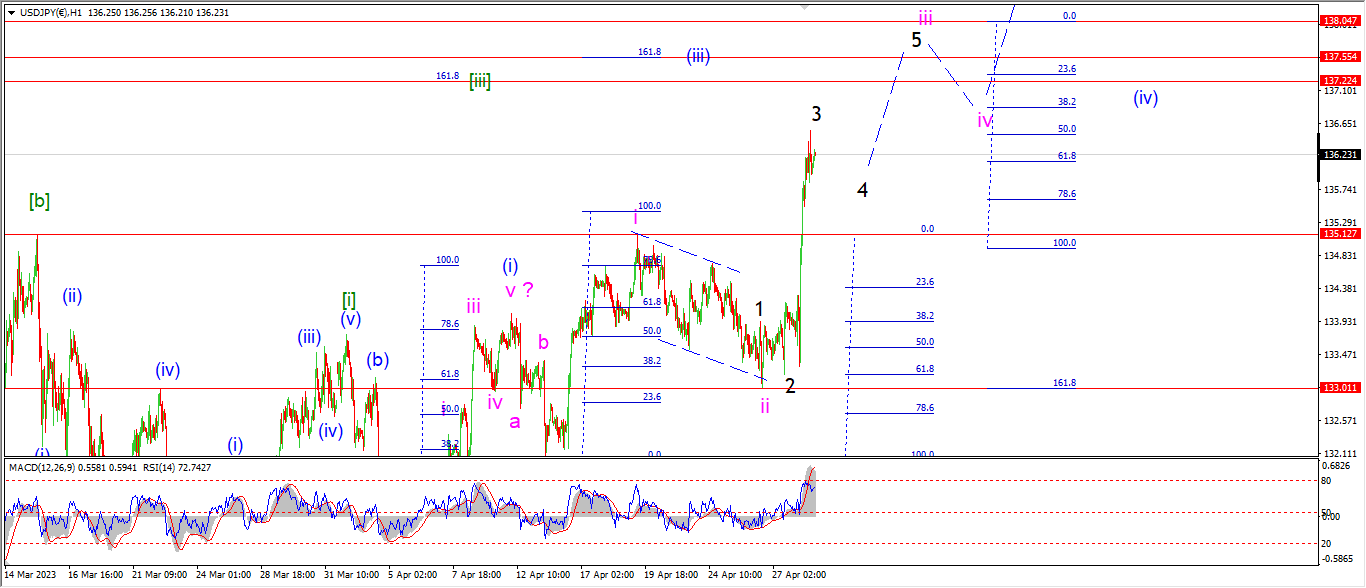
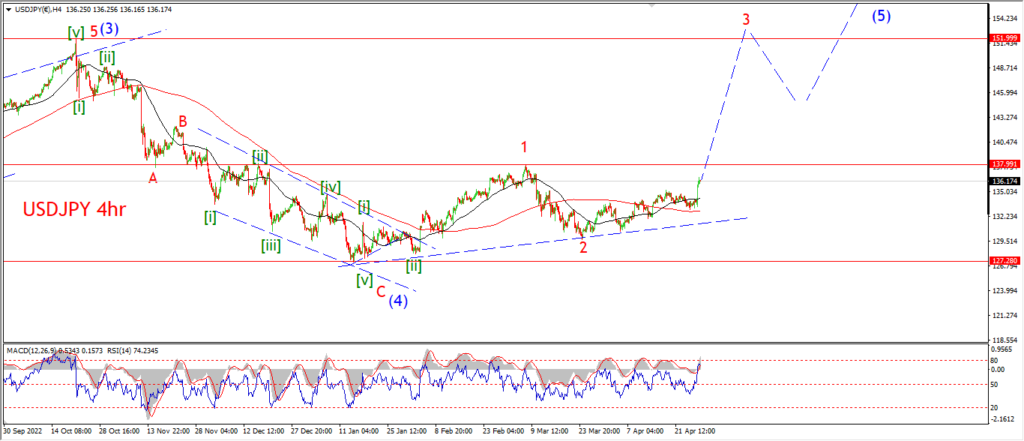
USDJPY is holding close to the highs for the week tonight as wave ‘iii’ continues towards its target.
The bullish pattern got a boost today for sure.
And that cluster of Fibonacci targets seems to be drawing the price towards it now.
The pattern for wave ‘ii’ will remain in force as long as the wave ‘i’ high holds at 135.12.
Monday;
Watch for wave ‘iii’ pink to trace out five waves up and complete in the target area close to 137.50.
DOW JONES.
DOW 1hr.
DOW 4hr
DOW daily.
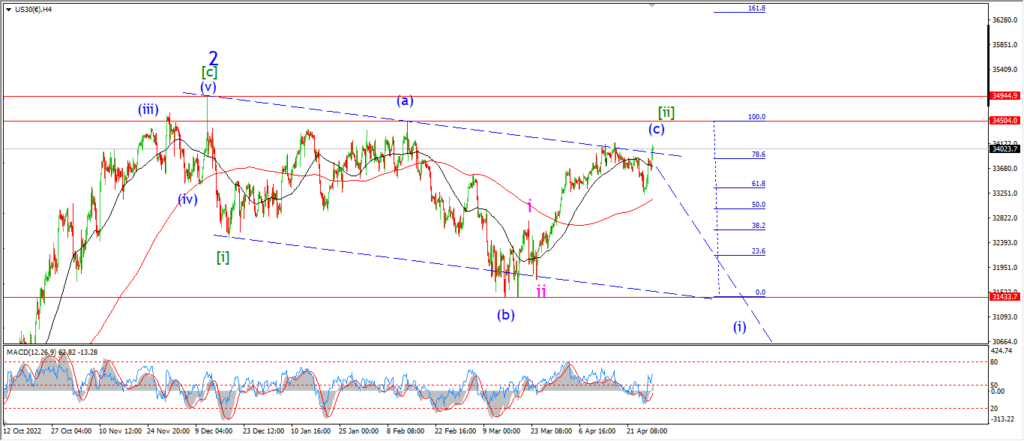
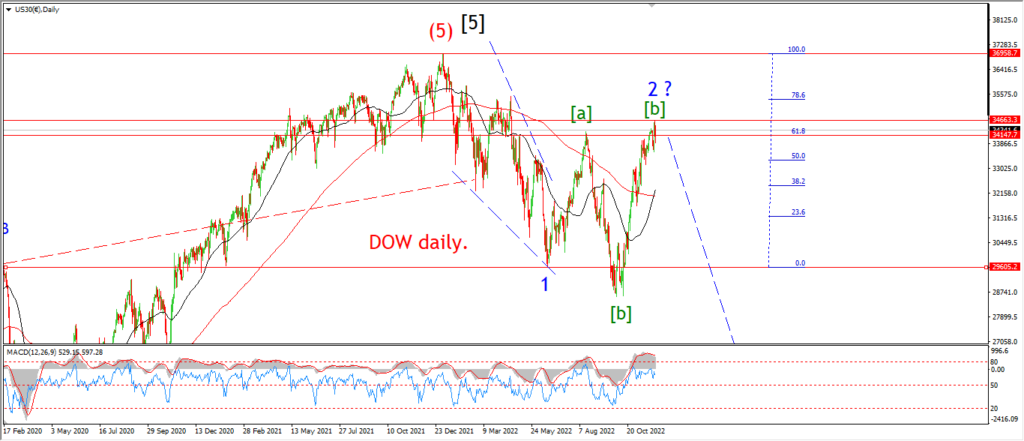
I want to start on the 4hr chart tonight.
I have abandoned the previous wave count for wave (ii) blue after todays continued rally back into the highs of this rally.
I am now looking at this whole sideways pattern since the beginning of the year as wave [ii] of ‘3’.
With the recent rally completing five waves up in wave (c) of [ii].
This correction in wave [ii] can complete as a running flat below 34500.
Or as an expanded flat with a break above 34500.
I would prefer the first option for obvious reasons.
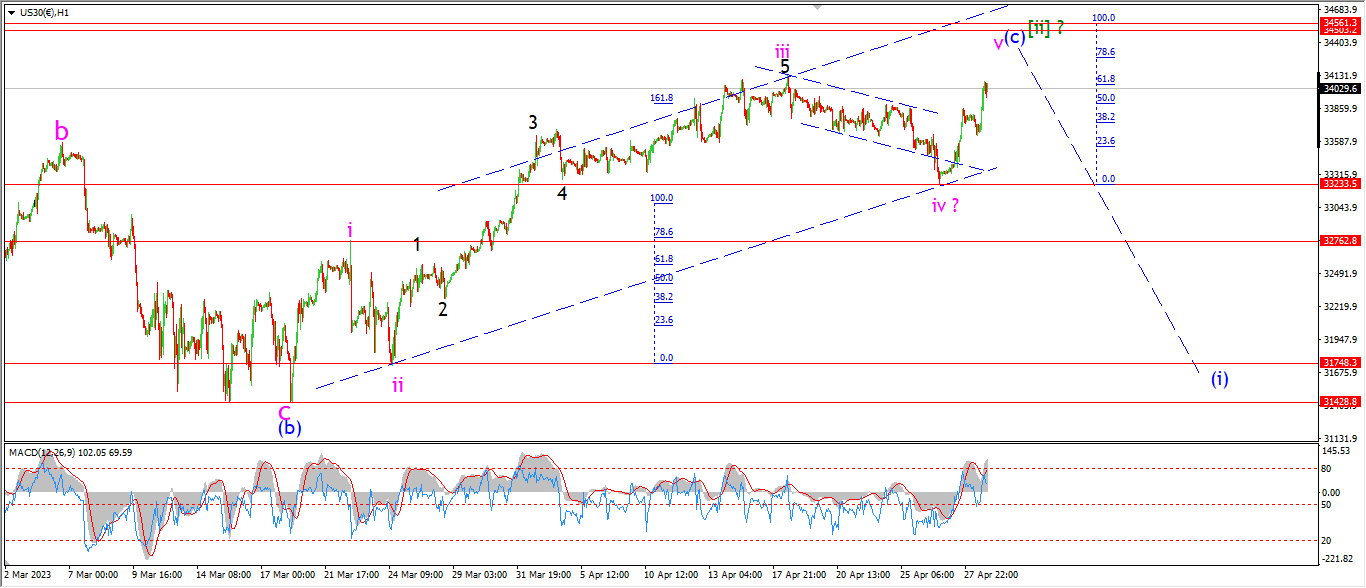
The hourly chart shows the complete wave (c) pattern.
The decline over the last week is now viewed as wave ‘iv’ of (c) of [ii].
Wave ‘v’ of (c) can complete now as a failed fifth wave.
But the Fibonacci grid suggests a target at 34560 where wave ‘i’ and ‘v’ reach equality.
Monday;
I have spent long enough searching for a top and being disappointed.
So I will wait for the market to give the cue here early next week.
GOLD
GOLD 1hr.
GOLD 4hr.

GOLD daily.
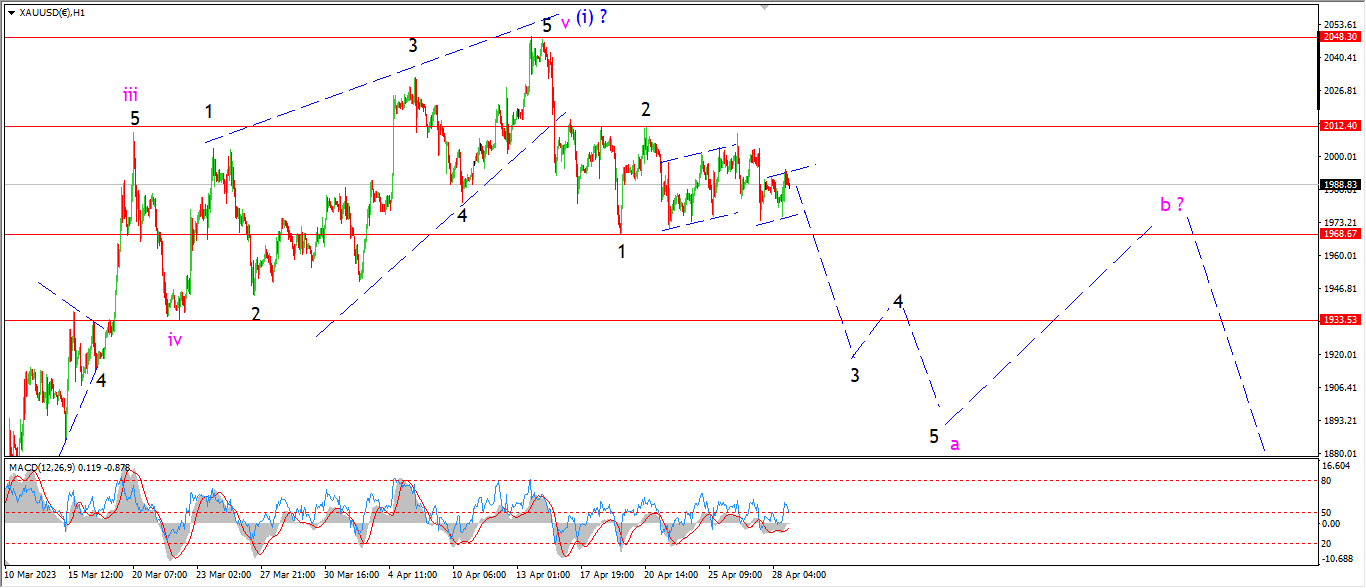
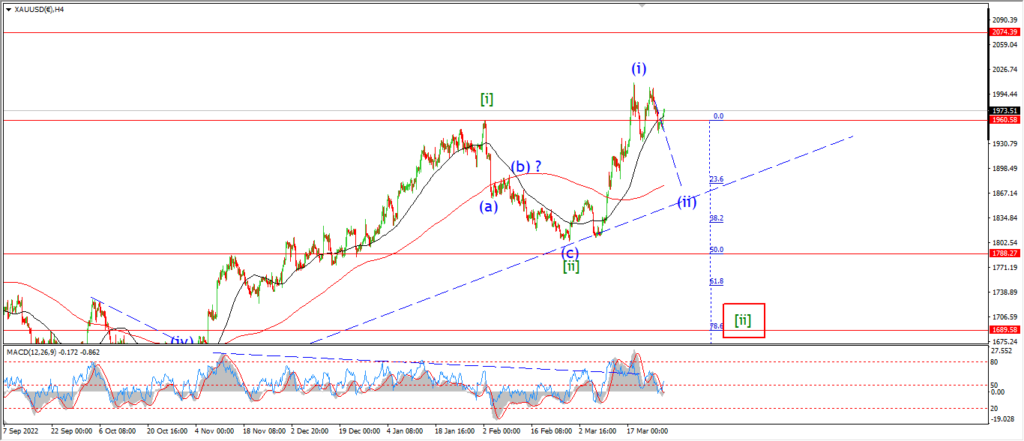
Gold is going nowhere fast these days.
I can see a possible minor correction higher complete at todays highs.
But again the pattern needs to be confirmed with a larger decline into wave ‘3’ of ‘a’ in the next few days.
A break below 1968 again will be the first signal wave ‘3’ of ‘a’ is underway.
Monday;
Watch for the high at 2012 to continue to hold at wave ‘2’.
The wave count now hinges on a sharp decline early next week to confirm the pattern.
CRUDE OIL.
CRUDE OIL 1hr.
CRUDE OIL 4hr.
CRUDE OIL daily.
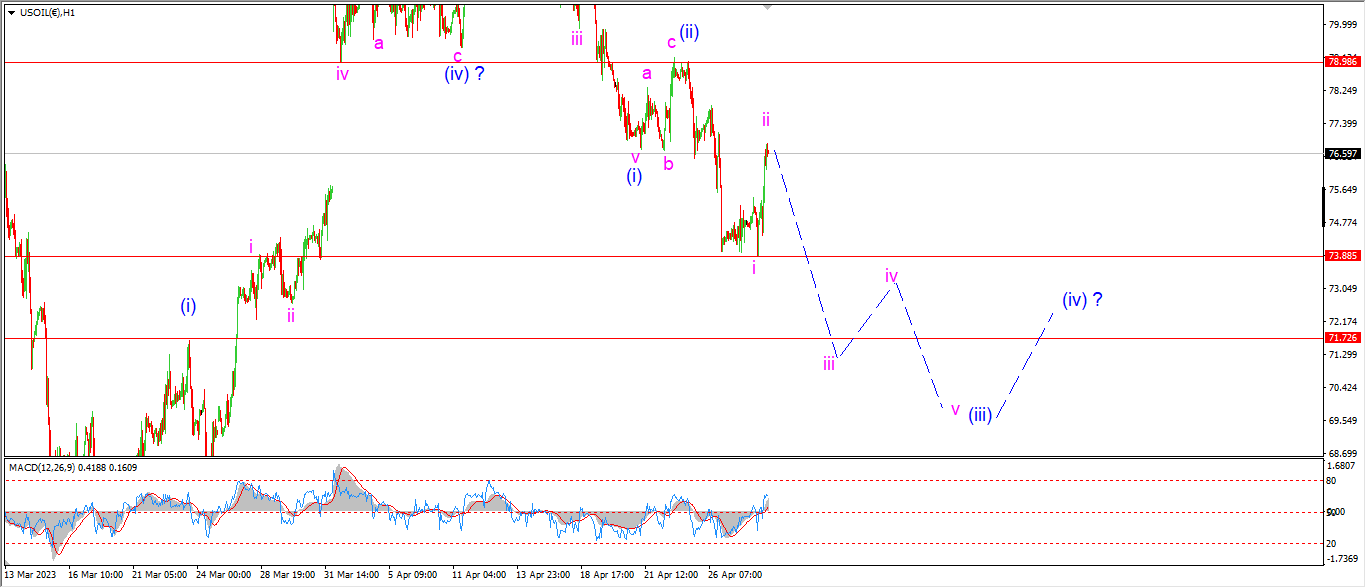
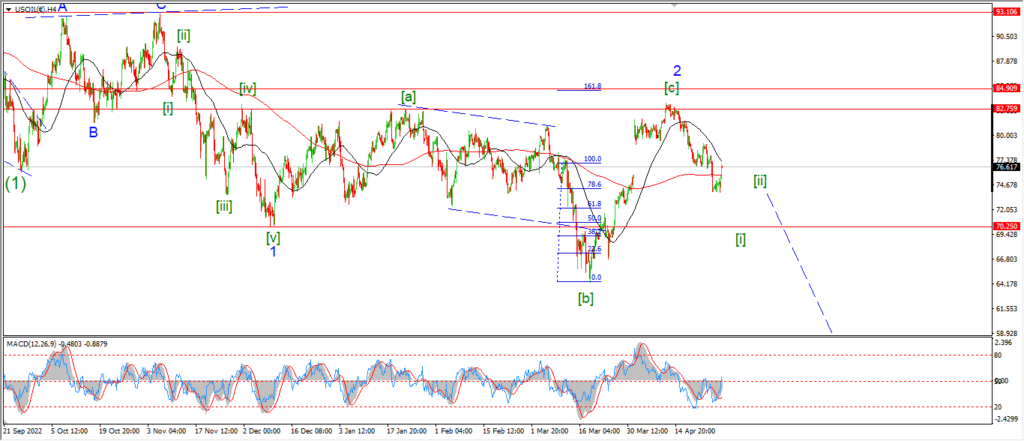
Crude oil has taken a turn higher today which has ruled out the previous count for wave (iii).
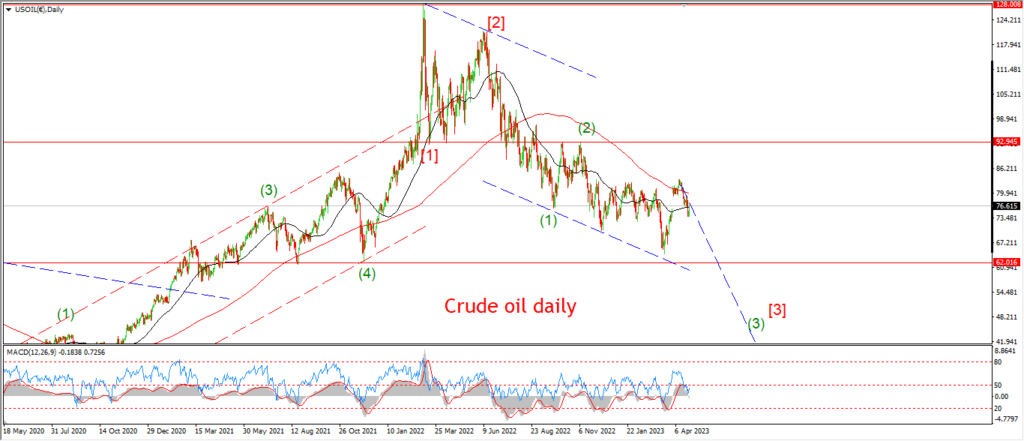
I am still looking at the possibility that wave (iii) is underway though.
But todays rally is labelled wave ‘ii’ of ‘iii’.
and wave ‘iii’ of (iii) is left for next week instead.
The overall decline in wave (iii) should fall towards 70.00 again over the next week or so.
And this pattern will remain valid as long as wave (ii) holds at 78.98.
Monday;
Watch for wave ‘ii’ to complete a lower high below the wave (ii) high.
And wave ‘iii’ of (iii) will be confirmed with a break of 73.88 again.
S&P 500.
S&P 500 1hr
S&P 500 4hr
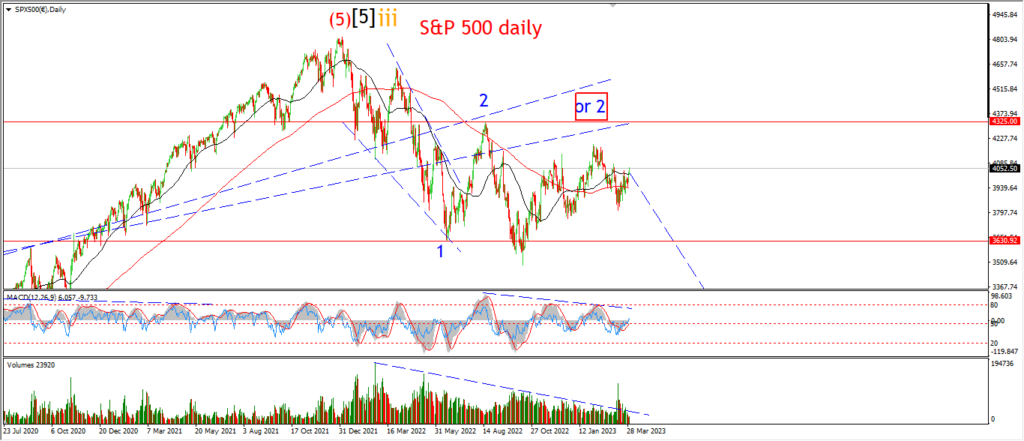
S&P 500 daily.
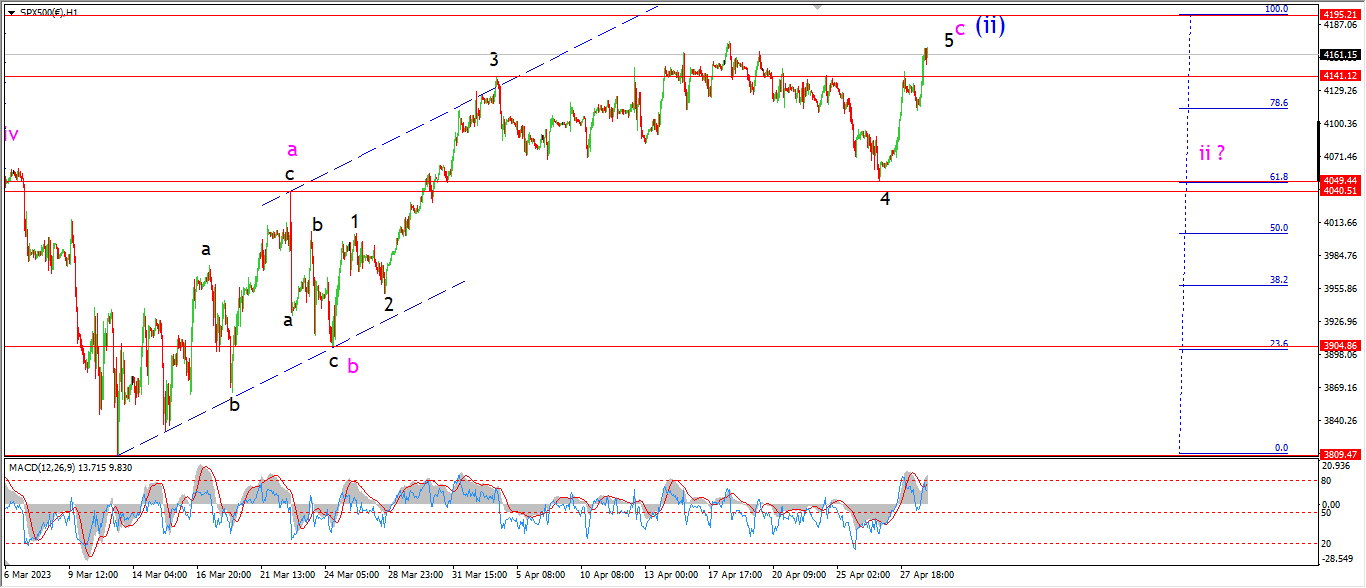
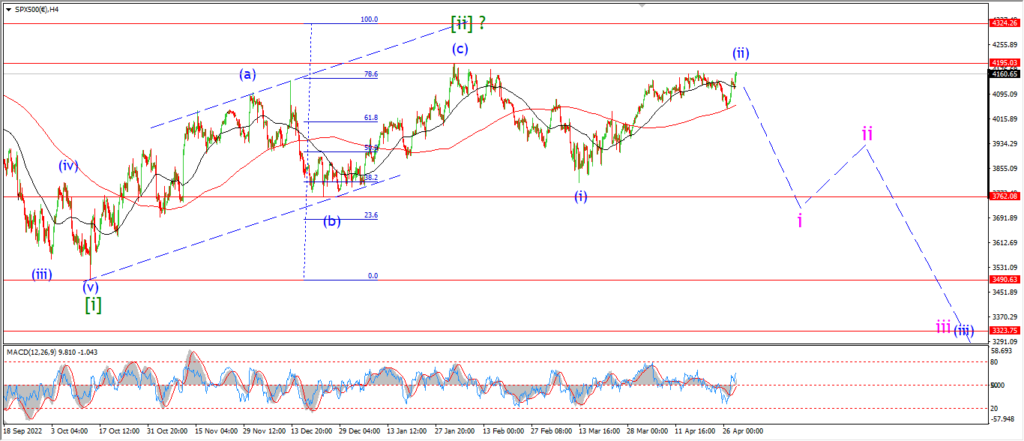
The rally today has forced my hand in the short term pattern again today.
I am sticking with the idea that wave (ii) is completing here.
Even though we are so close to the invalidation level again at 4195.
The market failed below that level last week,
and I will just have to take my chances this time also.
The sideways action over the last week is viewed as wave ‘4’ of ‘c’ which has traced out an expanded flat correction.
And wave ‘5’ of ‘c’ has already broken the wave ‘3’ high so that calls this wave ‘c’ rally complete again.
the only thing I need here as always is that confirming price action.
And that comes with a turn down to break below 4000 again early next week.
Tomorrow;
Watch for wave ‘5’ of ‘c’ of (ii) to top out below 4195.
A break of wave ‘4’ at 4049 again will favor the bearish count again.
SILVER.
SILVER 1hr
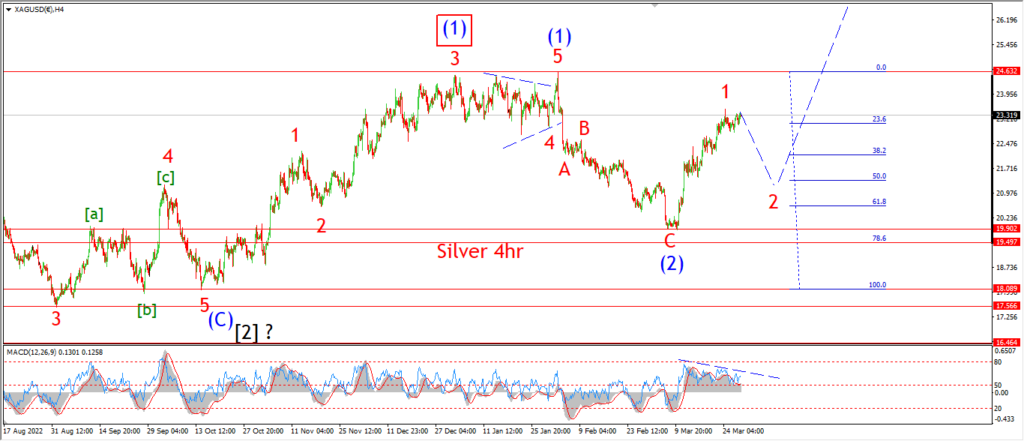
SILVER 4hr.
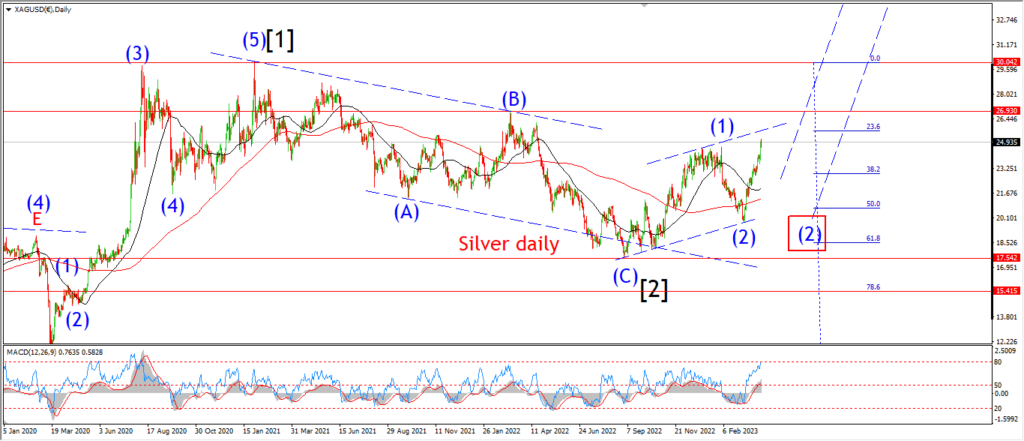
SILVER daily.
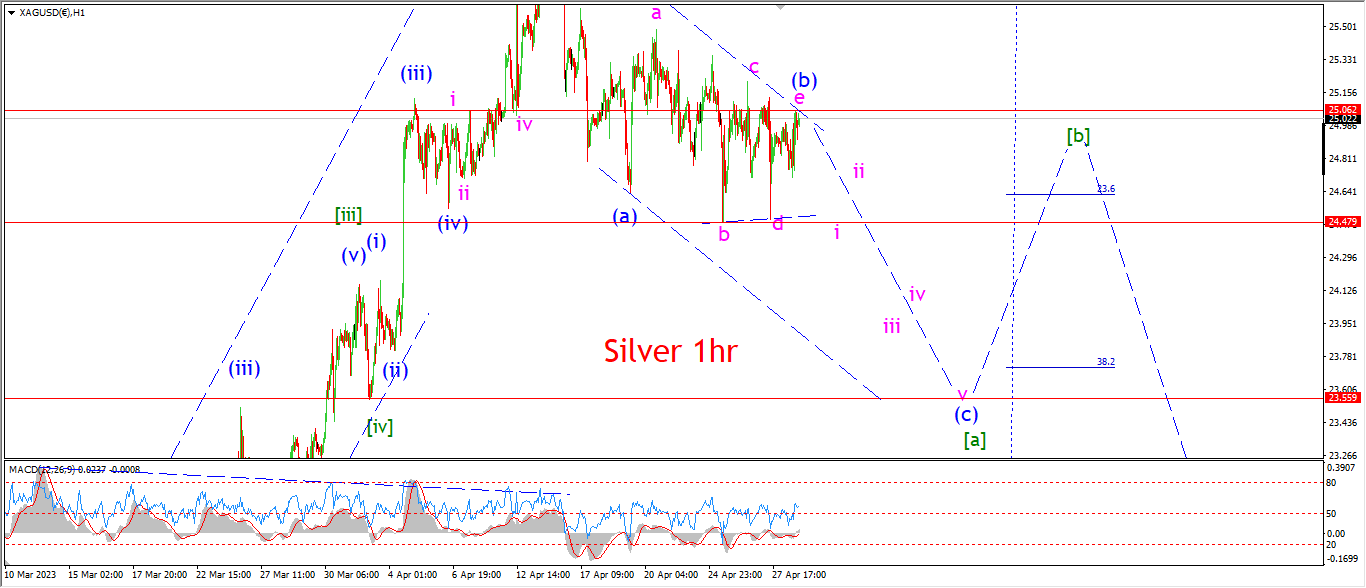
Silver continues to move in a triangle today after a three wave move higher completes this evening.
I am looking at this evenings top as wave ‘e’ of (b) of [a].
And wave (c) should now begin with a break below the range of the triangle on Monday in wave ‘i’ of (c).
Monday;
Watch for wave ‘i’ of (c) to confirm the pattern with a break of 24.48 again at the wave ‘b’ lows.
BITCOIN
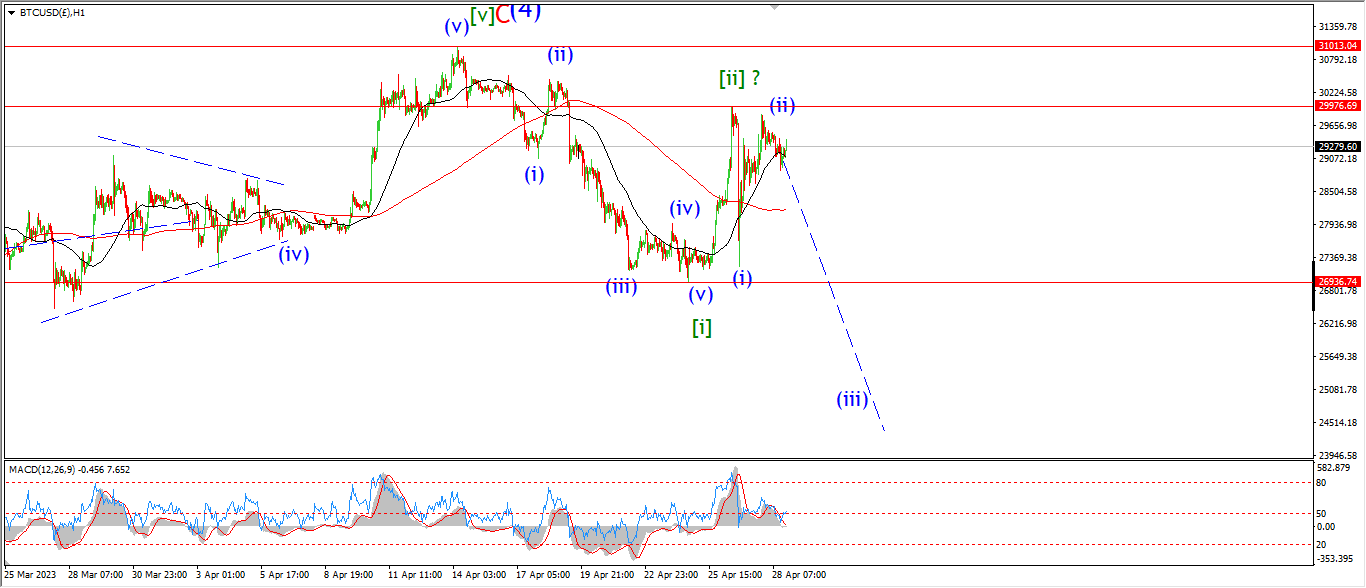
BITCOIN 1hr.

BITCOIN 4hr.
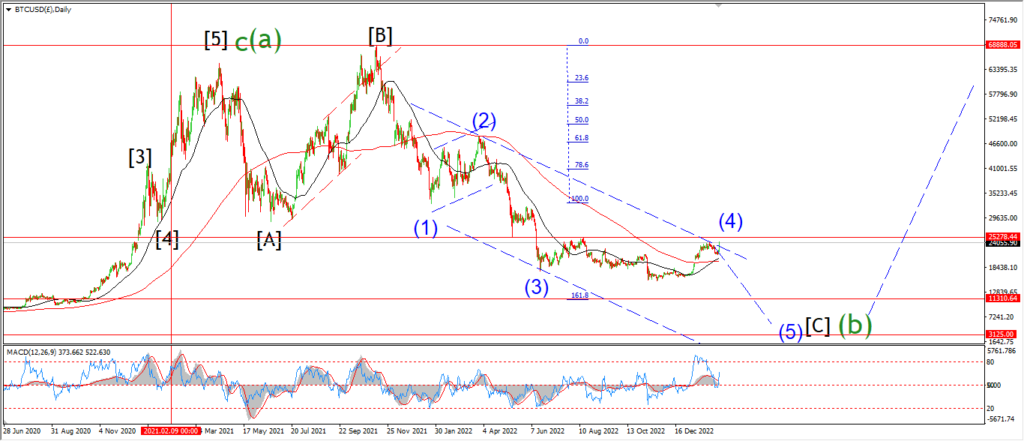
BITCOIN daily.
….
FTSE 100.
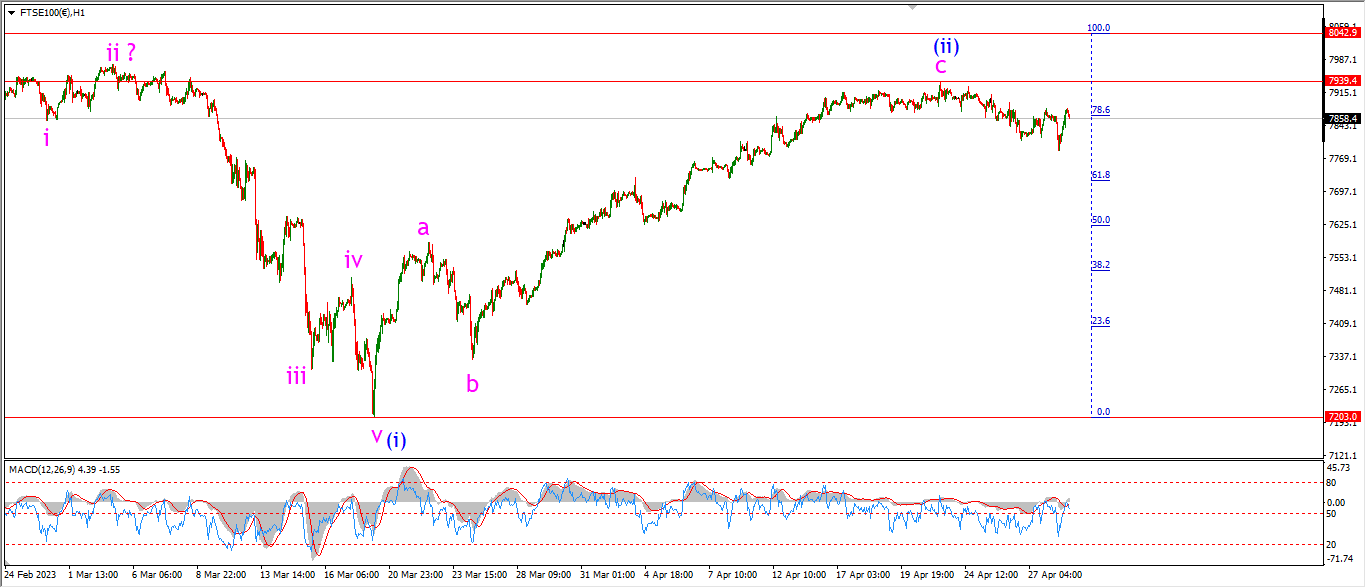
FTSE 100 1hr.
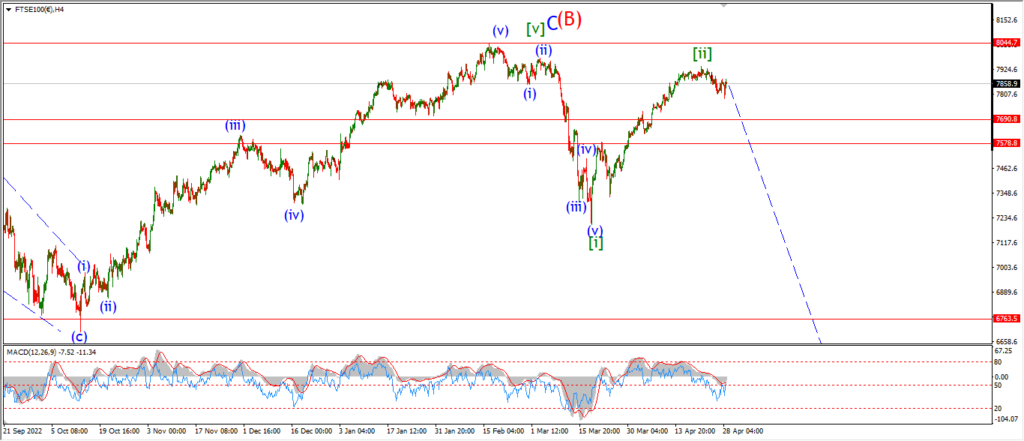
FTSE 100 4hr.

FTSE 100 daily.
….
DAX.
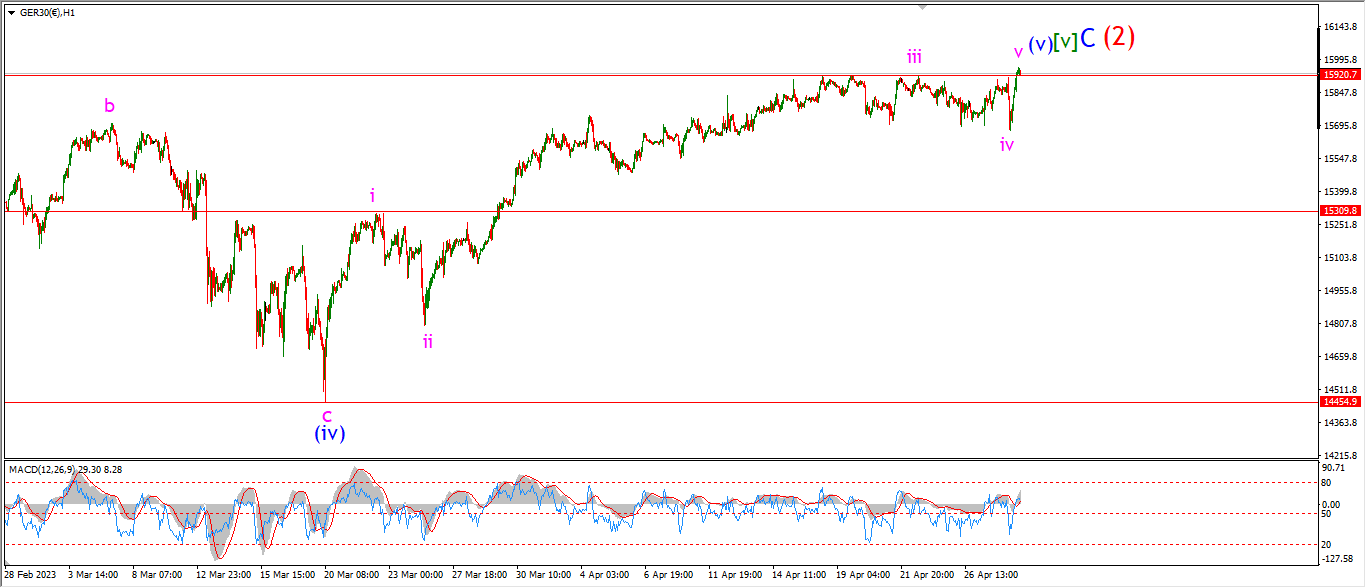
DAX 1hr
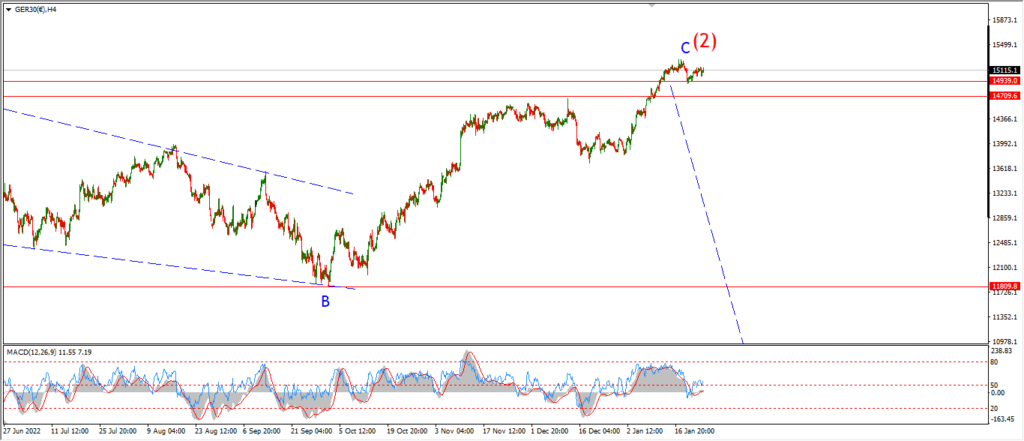
DAX 4hr

DAX daily.
….
NASDAQ 100.
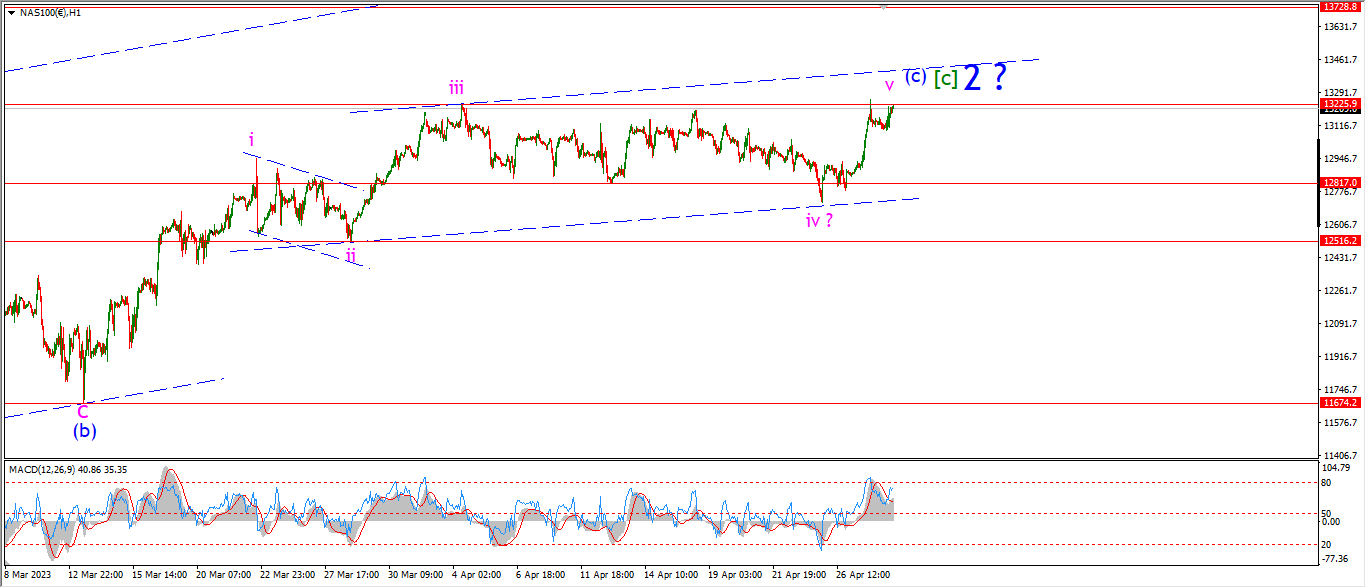
NASDAQ 1hr
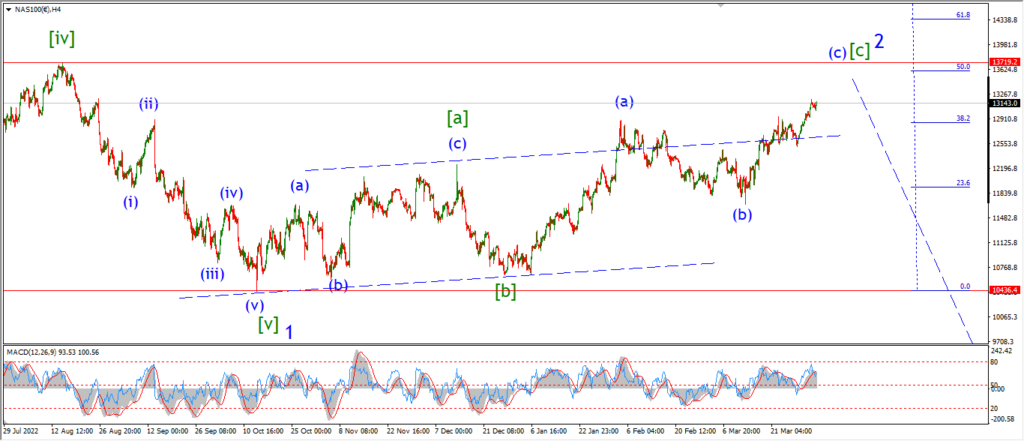
NASDAQ 4hr.

NASDAQ daily.
….