
Good evening fellow souls.
Many will say that I have been foiled by a new bull market today, and that it is only a matter of time before all is back to normal, and we are on the road to eternally high stock prices.
Boy oh boy, I am so far from that bullish point of view now, that I think we may even be on different planets at this stage!
I will present the latest from goldman sachs in this article, https://www.zerohedge.com/markets/goldman-flips-bearish-sees-imminent-momentum-crash-all-sp-gains-come-just-5-stocks
I dont think it is possible to read that article and still hold a bullish outlook!
Anyway, lets see what the day has done and how we are lining up this week.
EURUSD.
EURUSD 1hr.
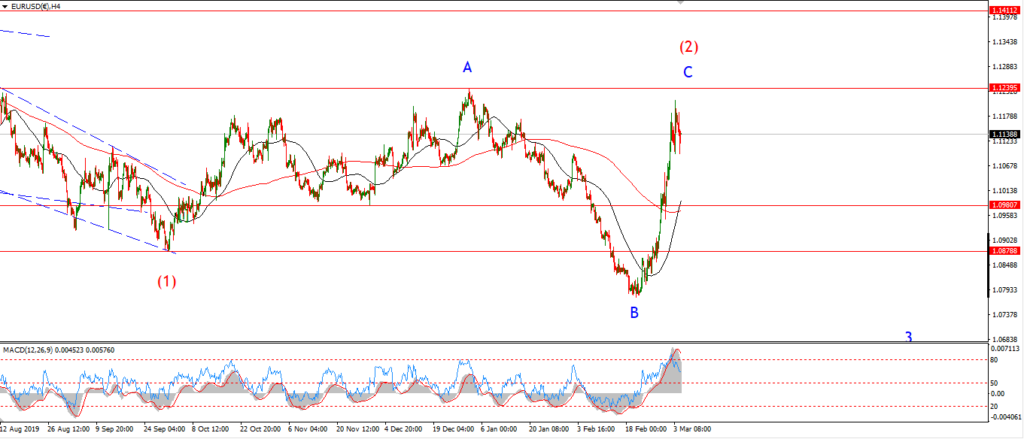
EURUSD 4hr.
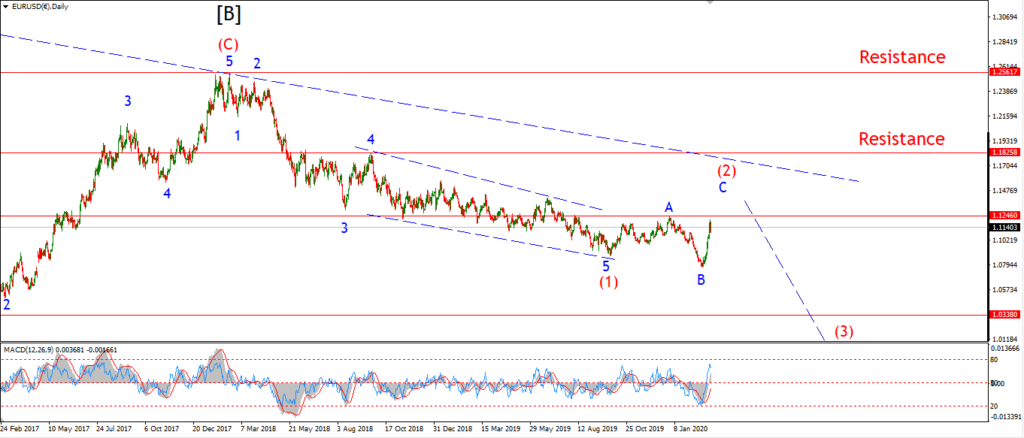
EURUSD daily.
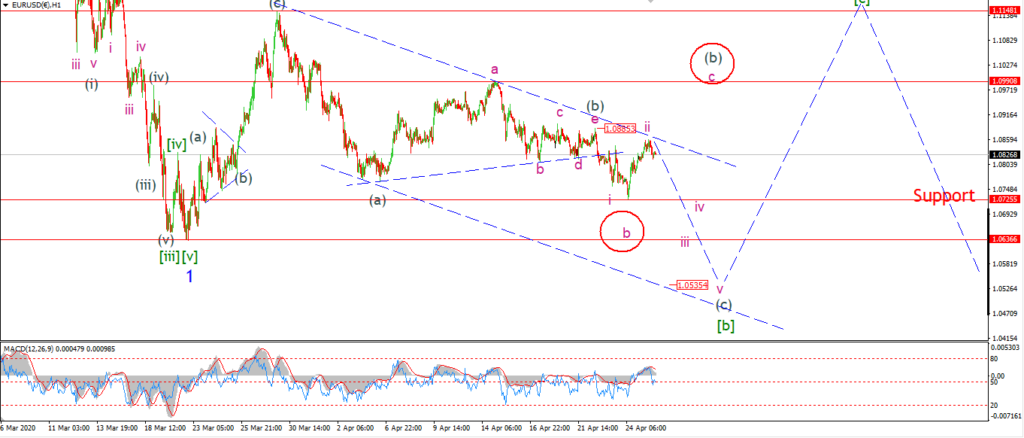
The action over the last ten days in EURUSD definitely points to a ‘b’ wave of some sort!
There are two possibilities for ‘b’ waves at the moment on the short term chart.
the main count calls for a further decline this week in wave (c) of [b],
before rallying again in wave [c].
It is worth considering the short term alternate count for EURUSD this evening
because of that indecision in the price action.
It is possible that wave (b) of [b] is still in play,
but as a flat correction rather than a triangle as I have shown.
If this is correct,
wave ‘c’ of (b) will rally into 1.0990 again before falling into wave (c) of [b] later in the week.
Tomorrow;
if we see a break above the triangle wave (b) high at 1.0885,
that should trigger this short term alternate.
Watch that level tomorrow.
If 1.0725 breaks,
that will re affirm the main wave count.
And we can expect wave [b] to complete just below 1.0600 again.
GBPUSD
GBPUSD 1hr.
GBPUSD 4hr.
GBPUSD daily.
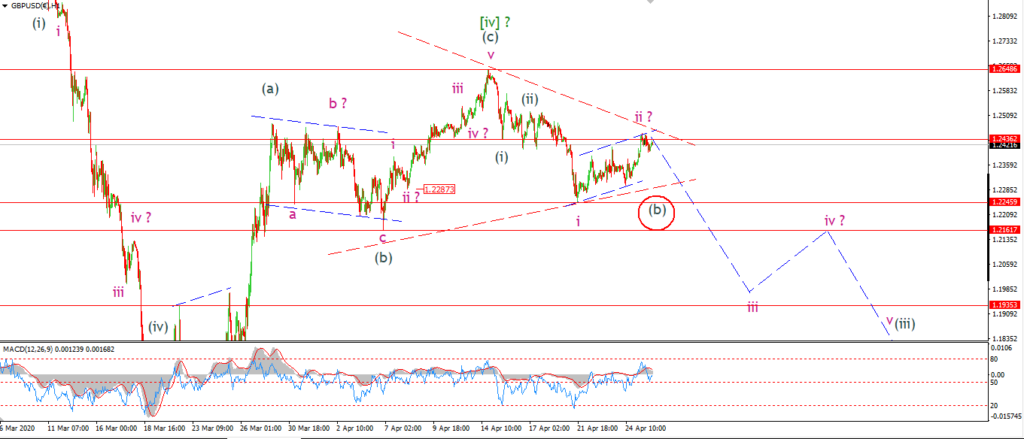
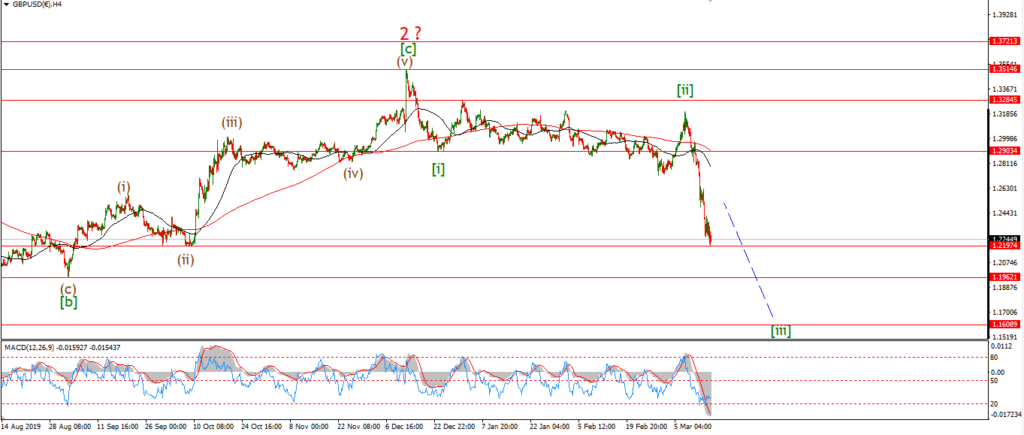
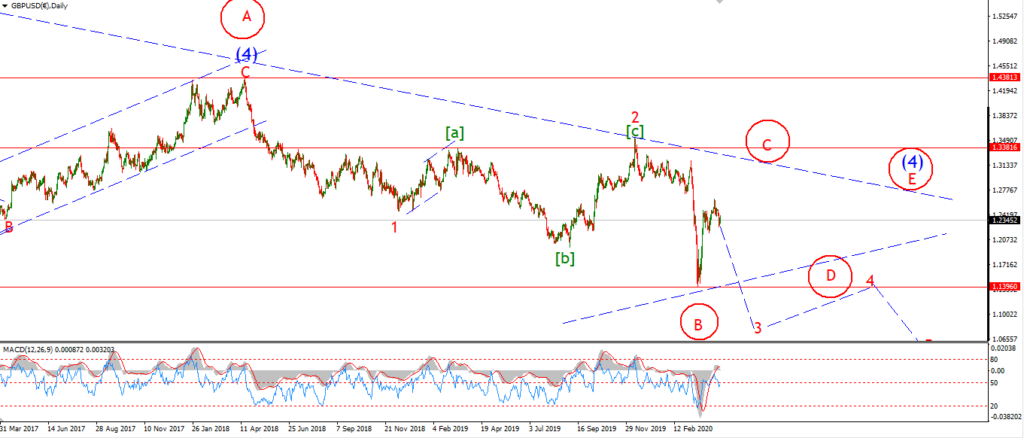
The same indecision has gripped GBPUSD these days also.
With that in mind,
I have changed the main count and introduced an alternate count this evening.
The main count shows a series of 1,2 impulse waves off the wave [iv] high.
This should result in an acceleration lower this week in wave ‘iii’ of (iii).
A break of 1.2245 will confirm this interpretation.
As for the new alternate count.
The range contraction over the last few weeks is possible to read as a triangle which is still ongoing.
If that 1.2245 level holds and the price range contracts even further over the next few sessions.
That will favor the triangle wave (b) idea,
and then we can expect a rally in wave (c) to complete the larger wave [iv].
Tomorrow;
1.2245 is the most important level in the short term.
A break of that level will signal a decline in wave (iii) is underway.
USDJPY.
USDJPY 1hr.
USDJPY 1hr.
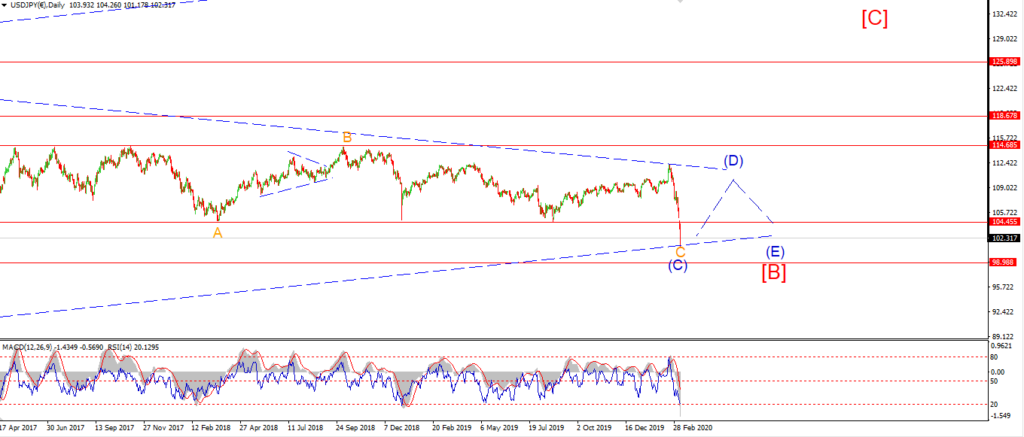
USDJPY daily.
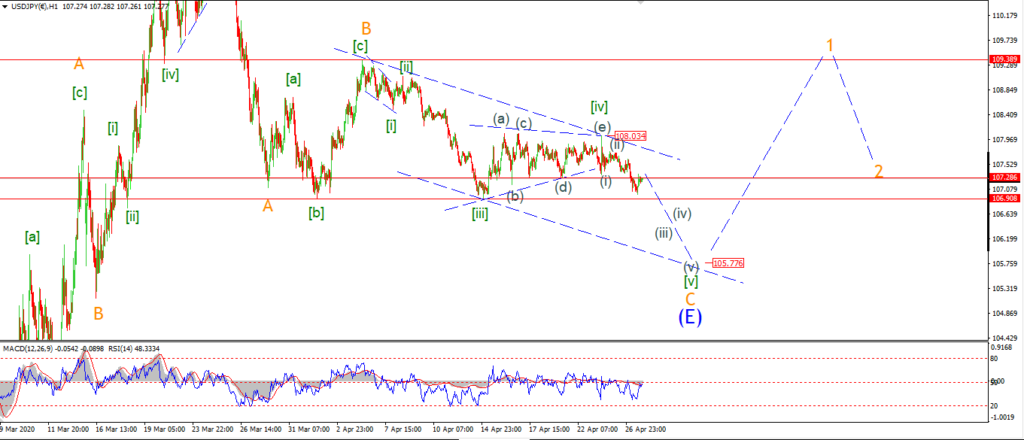
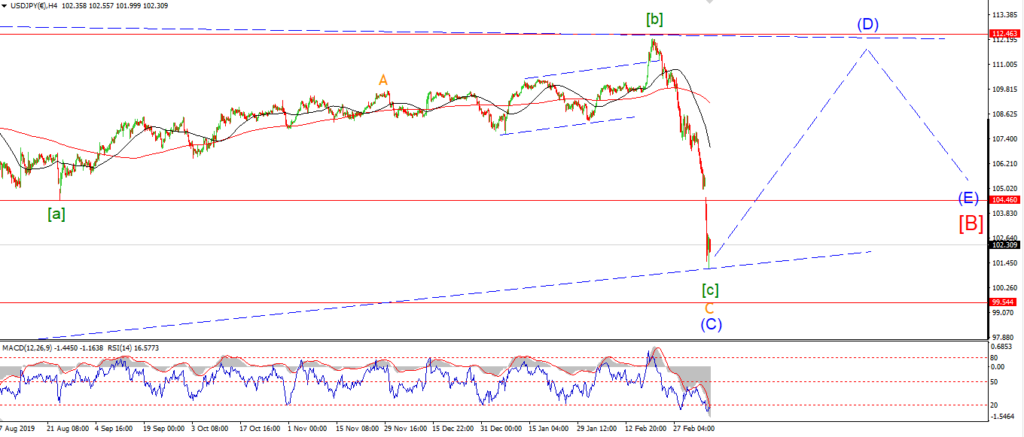
I am holding with the idea that USDJPY is falling in wave [v] of ‘C’ this week.
The triangle high at wave [iv] is holding so far.
And the price has begun to fall again into a possible wave (iii) of [v] today.
So long as the wave [iv] high holds over the coming days,
then we can expect a decline into the 105.70 area to complete the larger pattern in wave ‘C’ of (E).
Tomorrow;
Watch for wave (iii) of [v] to continue lower and break below 106.90 again at a minimum.
Ideally, I would like to see wave (iii) fall into the 106.00 area forst,
before any correction occurs in wave (iv) again.
DOW JONES.
DOW 1hr.
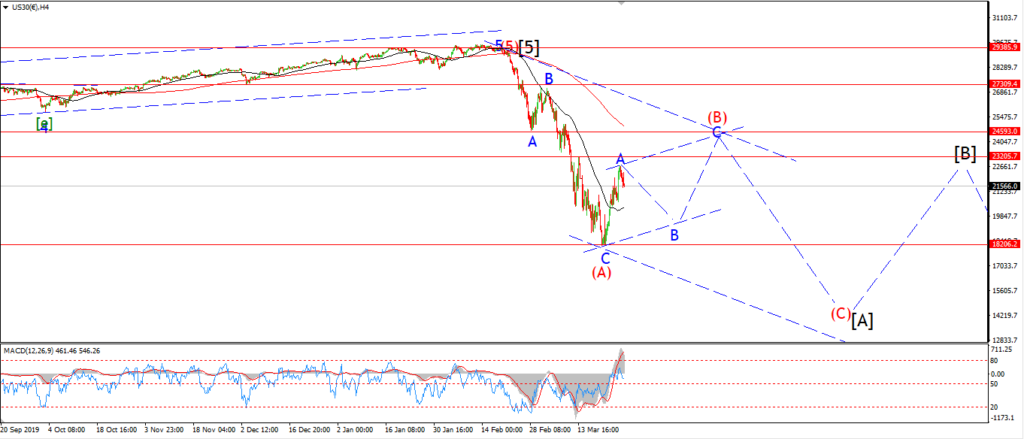
DOW 4hr
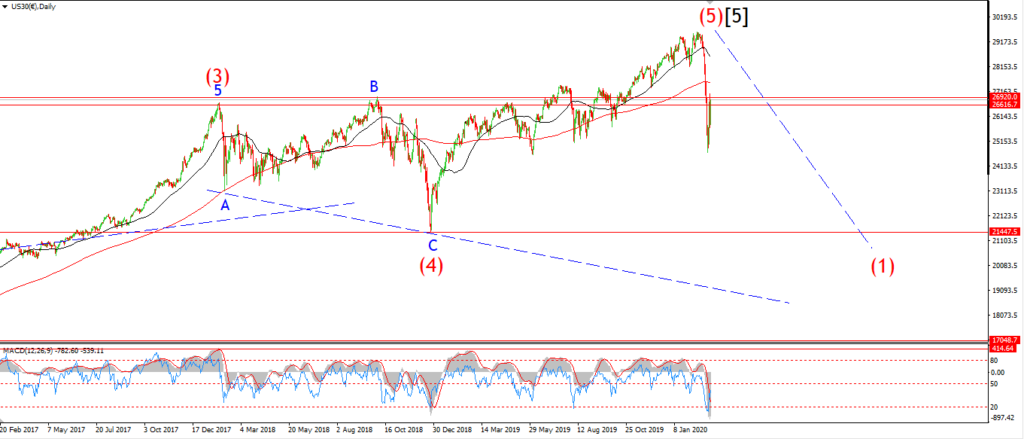
DOW daily.
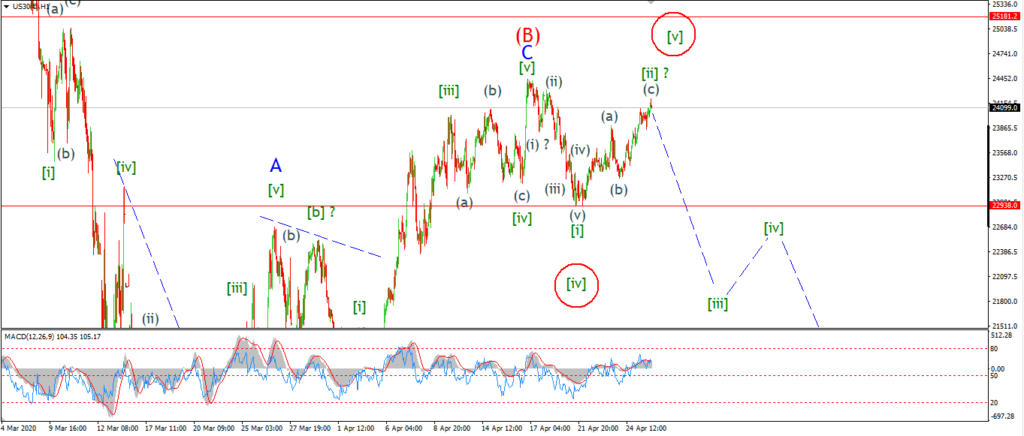
The DOW is inching higher in an agonizing fashion today
and this puts pressure on the immediately bearish wave count on the short term chart.
I still favor this bearish idea for sure.
But that does not rule out the fact that we may have a different structure developing to complete this bear market rally.
The high at wave (B) right now stands at 24264,
And we are getting close to that level as the market closes this evening.
The best alternate count I can see right now is for wave ‘C’ of (B) to be completing with a larger expanded flat wave [iv],
and then a final run up in wave [v] now underway.
This alternate count would also explain a five wave decline last week as wave (c) of [iv].
Even if this alternate count is correct,
it still suggest that we will see an end to the bear market rally in wave (B) this week
and wave (C) should begin with a serious initial selloff.
Tomorrow;
Watch for wave the high at 24264 to hold.
Wave [iii] down should carry the price quickly below 22900 again
to confirm that wave ‘1’ of (C) has begun.
GOLD
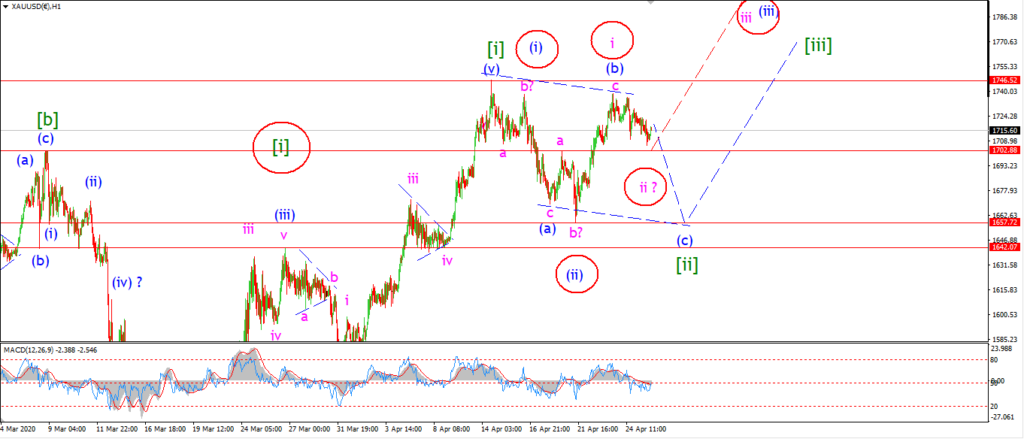
GOLD 1hr.
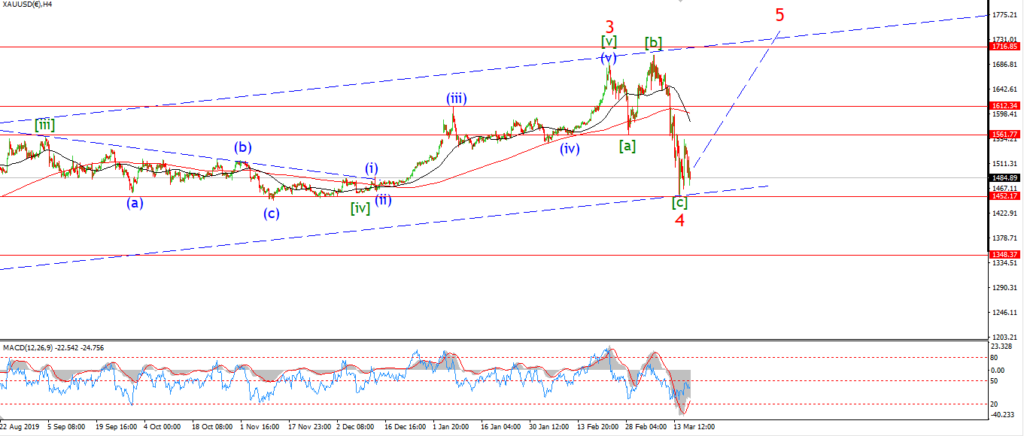
GOLD 4hr.
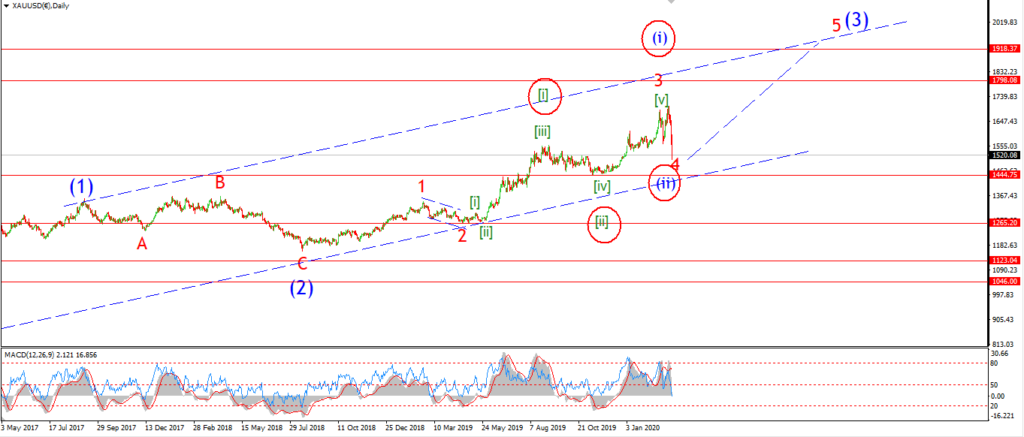
GOLD daily.
Gold continues to levitate above the 1700 level for another day.
The main wave count calls for a decline in wave (c) to about 1657 again over the coming week,
and then we will be setup for a rally in wave [iii] green.
Wave [iii] green is expected to carry gold to a new all time high over the next month.
The fly in the ointment right now is the action off the recent high.
The drop off the high over the last few days is very corrective looking.
With that in mind,
I have filled out the alternate count a little more this evening.
The small decline off the high can be viewed as wave ‘ii’ of (iii) of [iii].
In this case we could see an acceleration higher in wave (iii) of [iii] quicker than expected.
Tomorrow;
A sharp decline below 1700 again from this point will favor the main count.
then we can expect wave (c) of [ii] to complete in the 1650 area later this week.
I have one eye on that alternate count though.
A break of 1750 again will favor that idea.
CRUDE OIL.
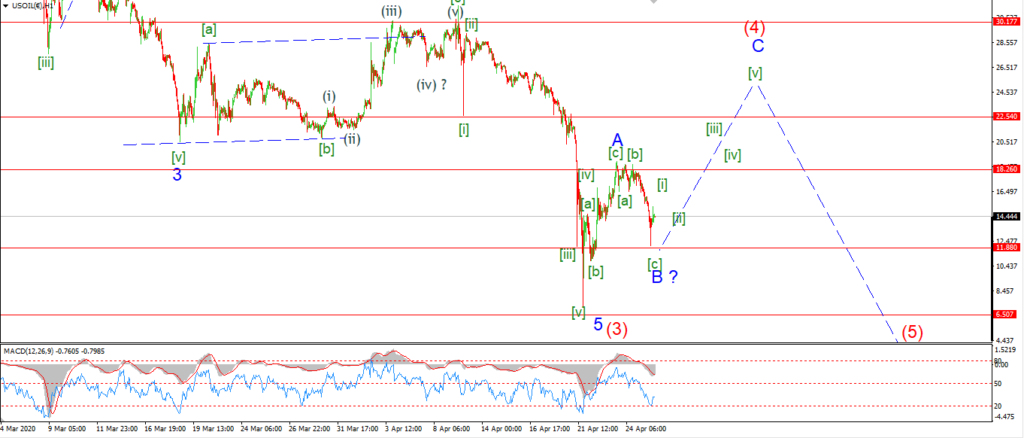
CRUDE OIL 1hr.
CRUDE OIL 4hr.
CRUDE OIL daily.
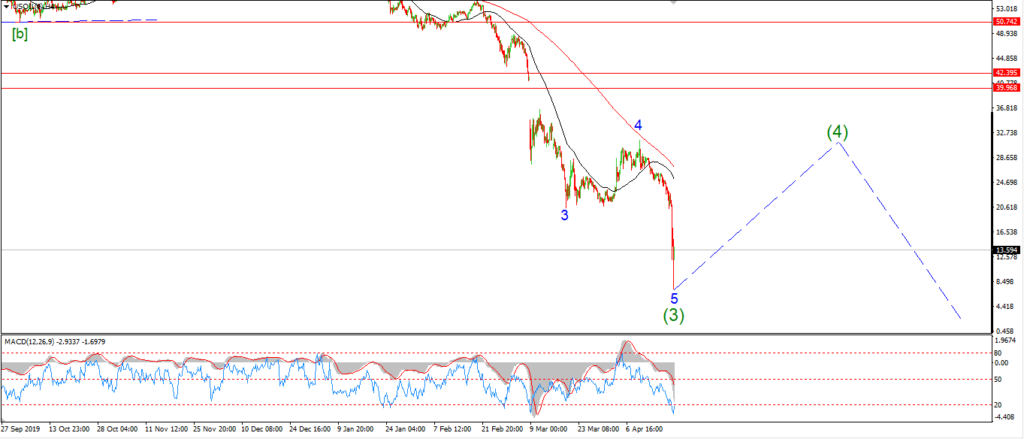
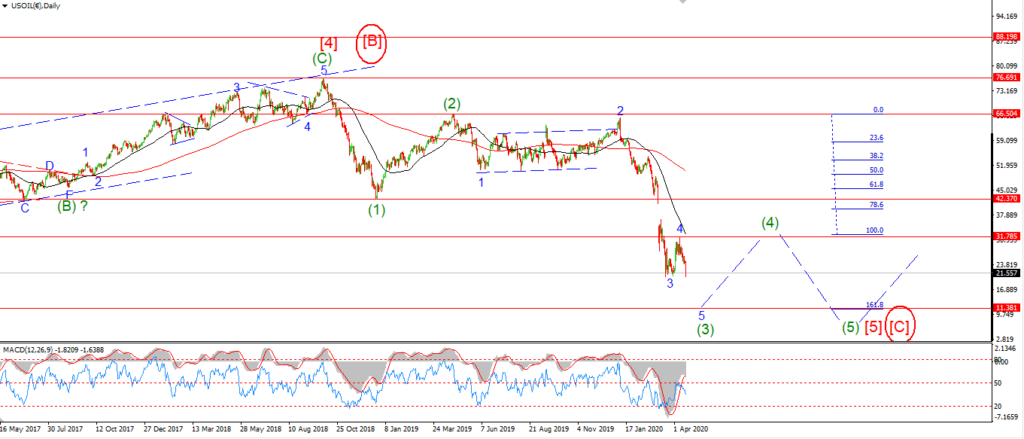
Crude fell sharply again today,but we have seen a recovery off the session low,
and we now seem to have a reasonable higher low in place, for now.
The pattern that I am working with is looking for a rally at a higher degree wave (4) in red.
And I suspect that wave ‘C’ of (4) could push back as high as the previous fourth wave high at about 30.00 again.
While the 30 handle might be a stretch for wave ‘C’,
a rally back above the recent high at wave ‘A’ of (4) is not.
And that will see wave ‘C’ break back above 18.26 at a minimum.
Tomorrow;
Watch for 11.88 to hold at wave ‘B’.
Wave [i] and [ii] of ‘C’ should create a higher low above 11.88 tomorrow.
And a rally in wave [iii] of ‘C’ should break 18.26.
S&P 500.
S&P 500 1hr
S&P 500 4hr
S&P 500 daily.
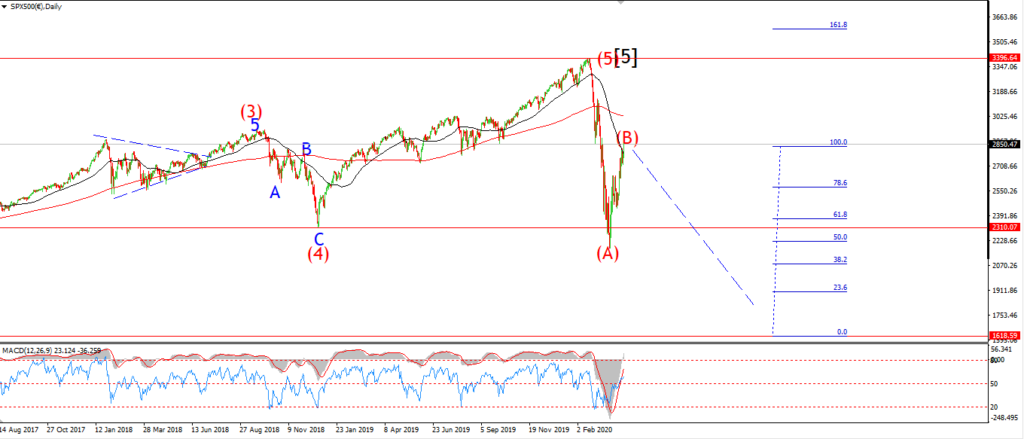
Foiled again!
So I guess now we should all just throw in the towel and go join the bulls…………….
Hold on a second there bucko!
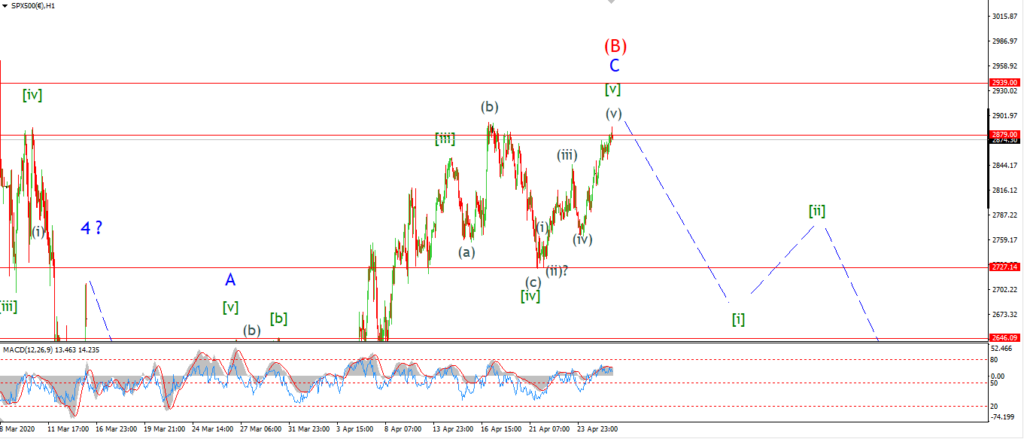
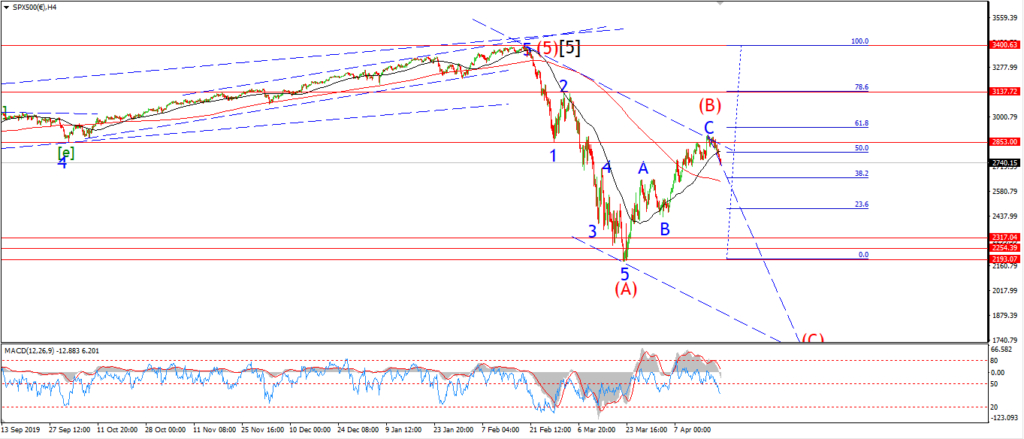
We may have a new high in wave ‘C’ tonight,
but this is still a bear-market rally we are in.
All that has happened here is that we have postponed the inevitable catastrophe for a few days.
And all it cost was an extra few trillion on the feds un-balance sheet!
So I must start again in figuring out this wave ‘C’ top.
The action over the last week has turned out to be an expanded flat wave [iv].
Wave (c) of [iv] fell in a five wave pattern off the high.
And now we have a final rally in wave [v] of ‘C’.
The short term pattern is terminal here.
It is much clearer on the cash chart rather than my derivative chart.
But the rise off the wave [iv] low is a nice five wave pattern into todays highs.
The question is this,
is wave [v] now complete,
or do we see a run into the 2939 level at the 62% retracement level before wave [i] down begins.
Either way,
I think this week does it for the bear market rally.
Tomorrow;
This extended rally is burning out now.
So a sharp turn lower into wave [i] is coming.
Watch for wave (v) of [v] to find a final high again.
The key level again lies at 2727.
But a break of 2791 cash will be a good sign that wave [i] is beginning.
SILVER.
SILVER 1hr
SILVER 4hr.
SILVER daily.
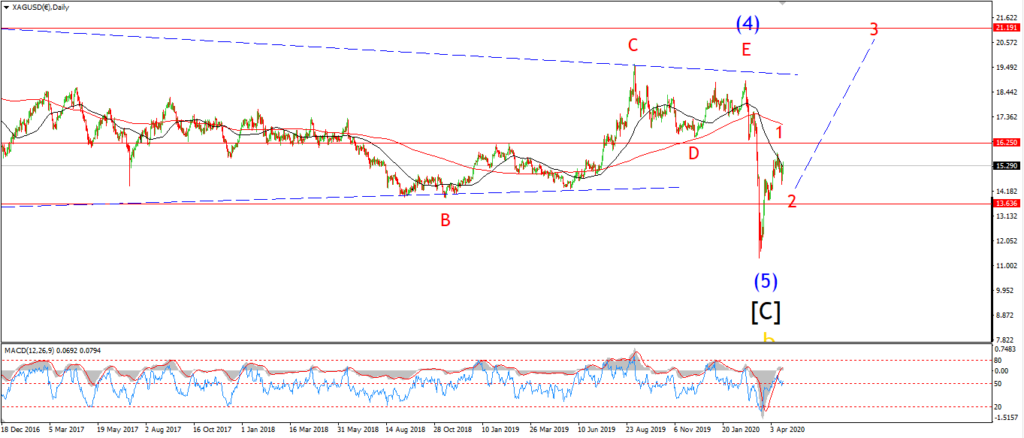
Silver is posing the same bullish questions tonight as gold.
That is;
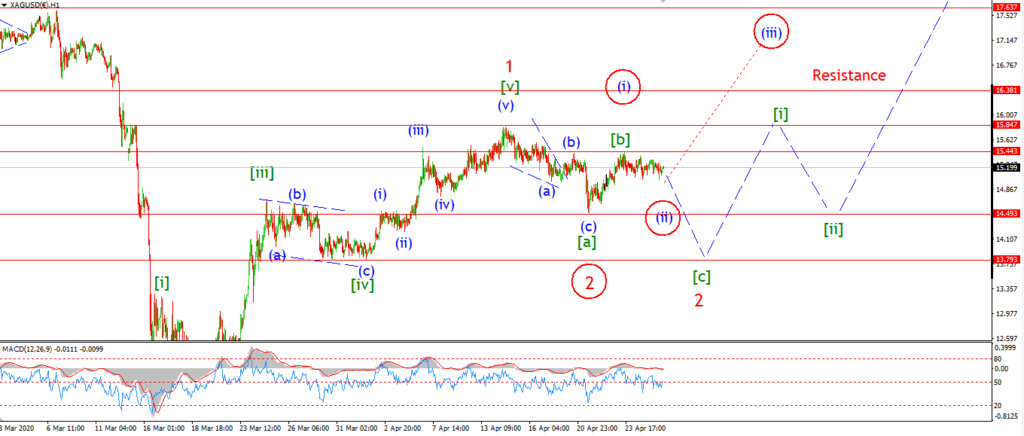
Is this correction already over at the previous low at 14.49?
The jury is out on that for the moment,
the rise off wave [a] is quite overlapping in general.
This suggests a corrective rise into that 15.44 high in wave [b].
The action off wave [b] is equally corrective looking.
And that action is allowing a bullish alternate to emerge here.
Tomorrow;
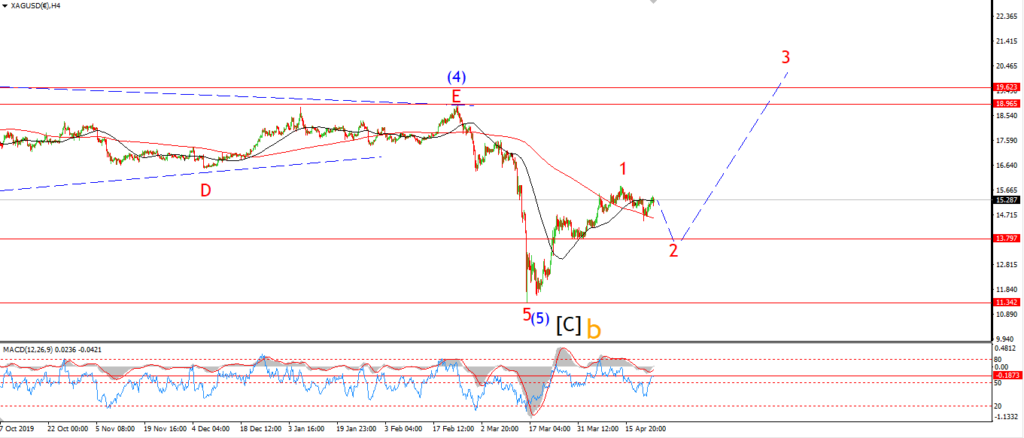
I still favor the idea of a final drop in wave [c] to complete wave ‘2’ at about 13.80.
But,
if the price accelerates higher off this point to break 15.84,
then I will consider that alternate bullish count again.
Watch for 15.44 to hold at wave [b] tomorrow;