
Good evening folks and the Lord’s blessings to you.
EURUSD
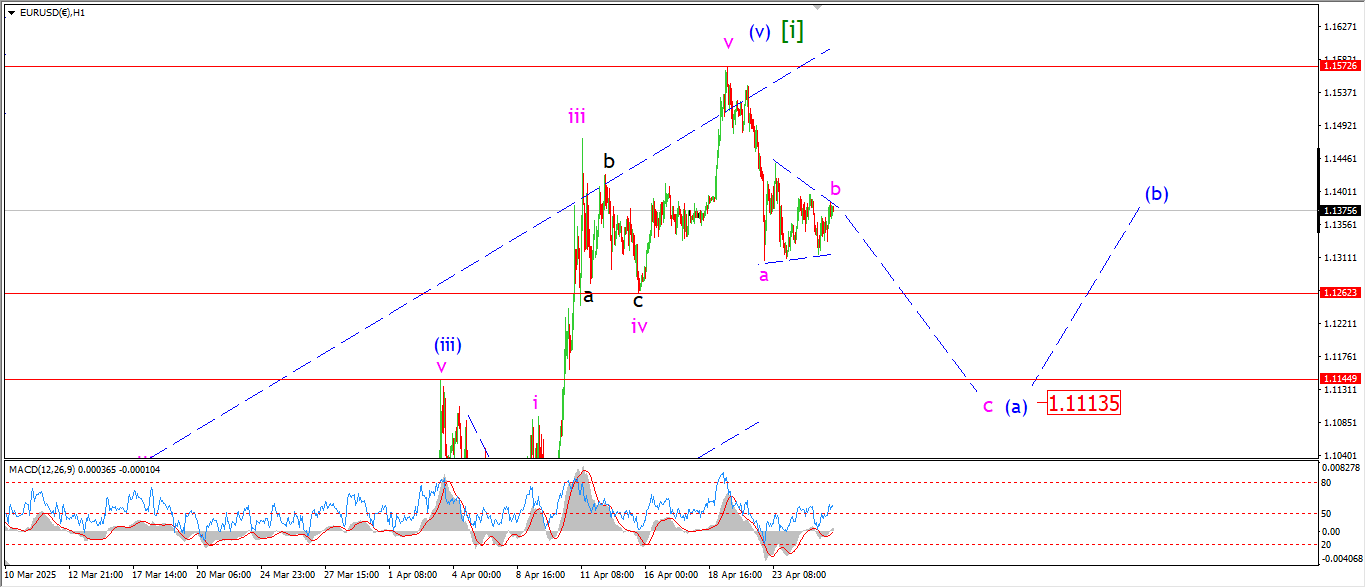
EURUSD 1hr.
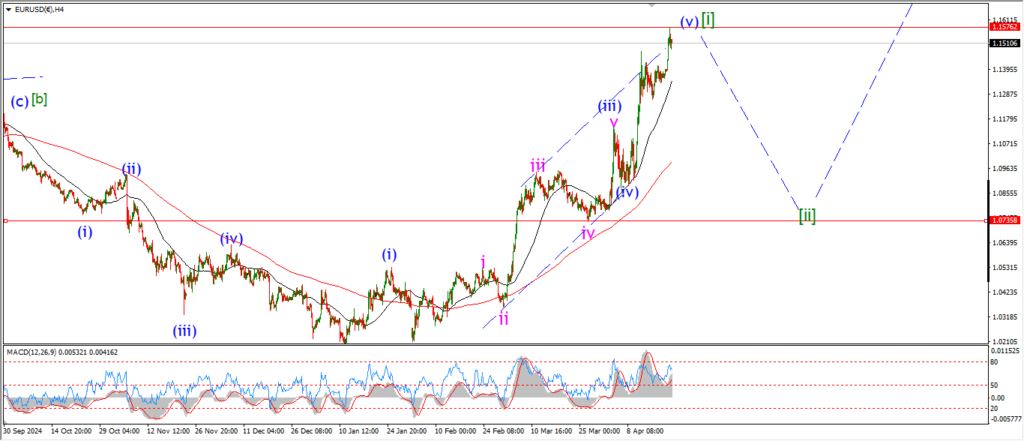
EURUSD 4hr.
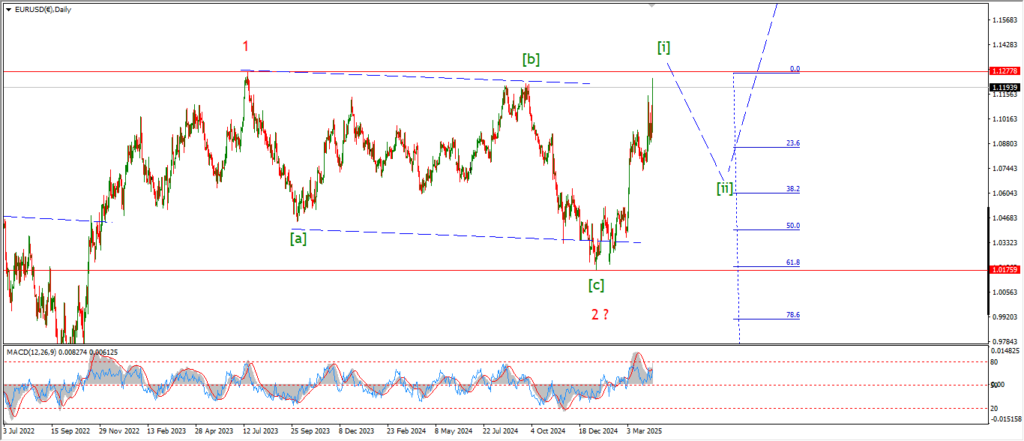
EURUSD daily.
I am looking at a possible contracting triangle pattern for wave ‘b’ of (a) today.
The price action has gone basically nowhere over the last few days,
which is exactly what you might expect from a triangle in wave ‘b’.
This pattern requires one more step lower into wave ‘c’ of (a) early next week.
With the minimum target at 1.1260 at wave ‘iv’.
the next level of interest is the wave (iii) high at 1.1145.
Monday;
Watch for wave ‘b’ to hold as a triangle and wave ‘c’ to turn lower again in five waves towards 1.1150.
GBPUSD
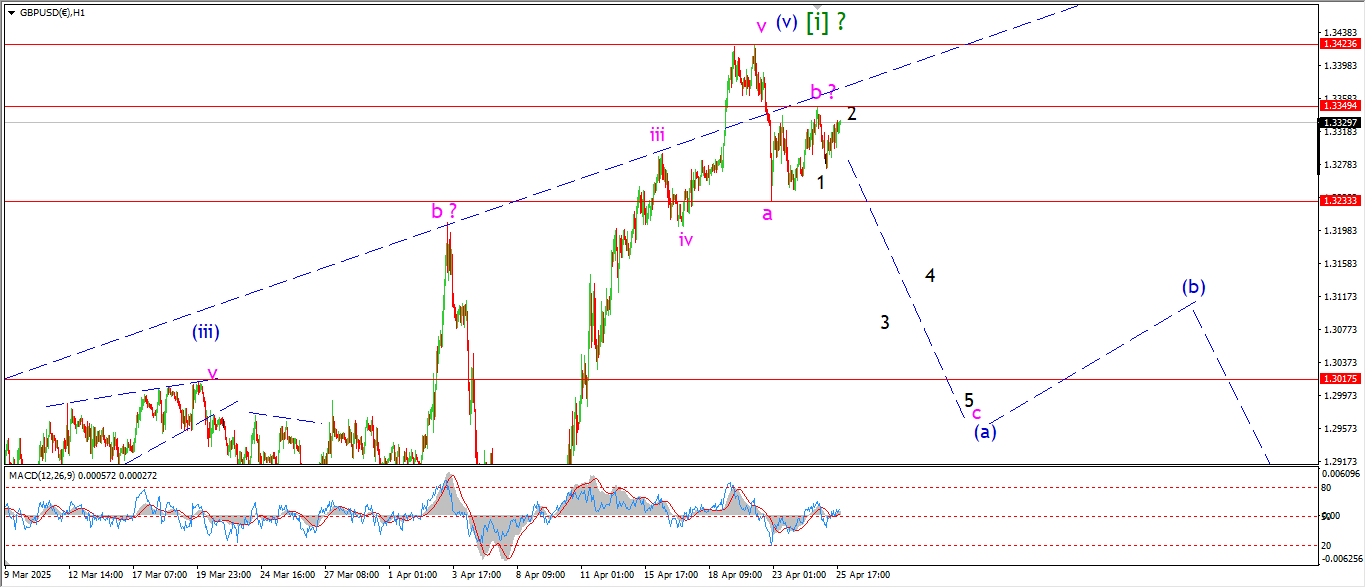
GBPUSD 1hr.
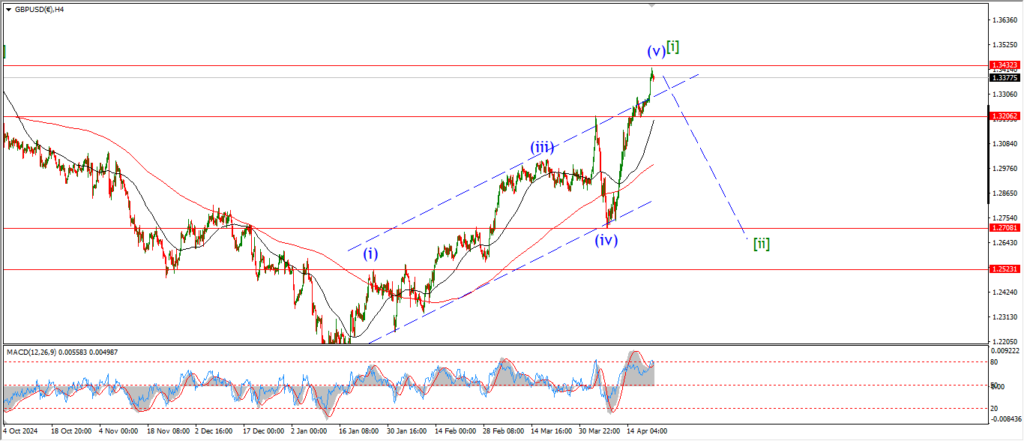
GBPUSD 4hr.
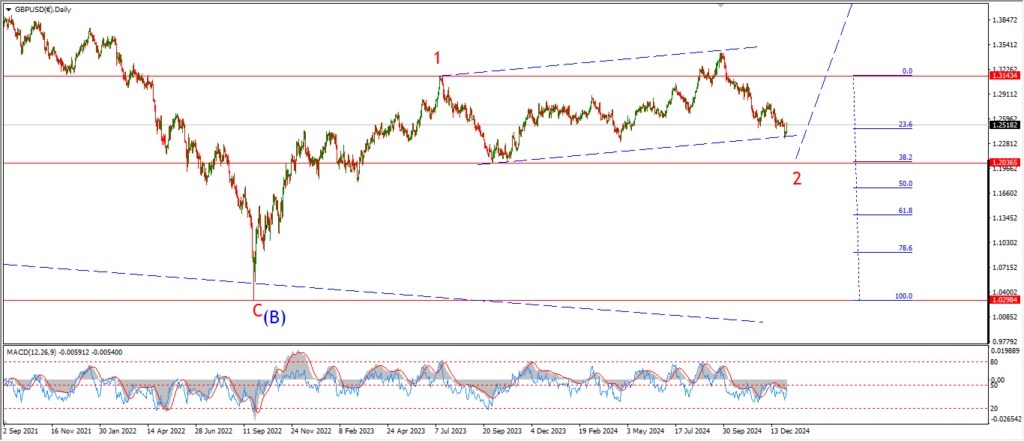
GBPUSD daily.
Cable is very quiet today but I am looking at a possible ‘1’ ‘2’ pattern to begin wave ‘c’ today.
Wave ‘b’ completed a three wave rise at the highs last night.
And now we have a very small lower high in place.
Wave ‘c’ must continue lower in five waves as shown.
And a break of 1.3233 again will signal wave ‘c’ is underway.
Monday;
Watch for wave ‘3’ of ‘c’ of (a) to take us lower as shown.
I would like to see wave (a) in blue reach the previous wave (iii) high at 1.3000 again.
USDJPY.
USDJPY 1hr.
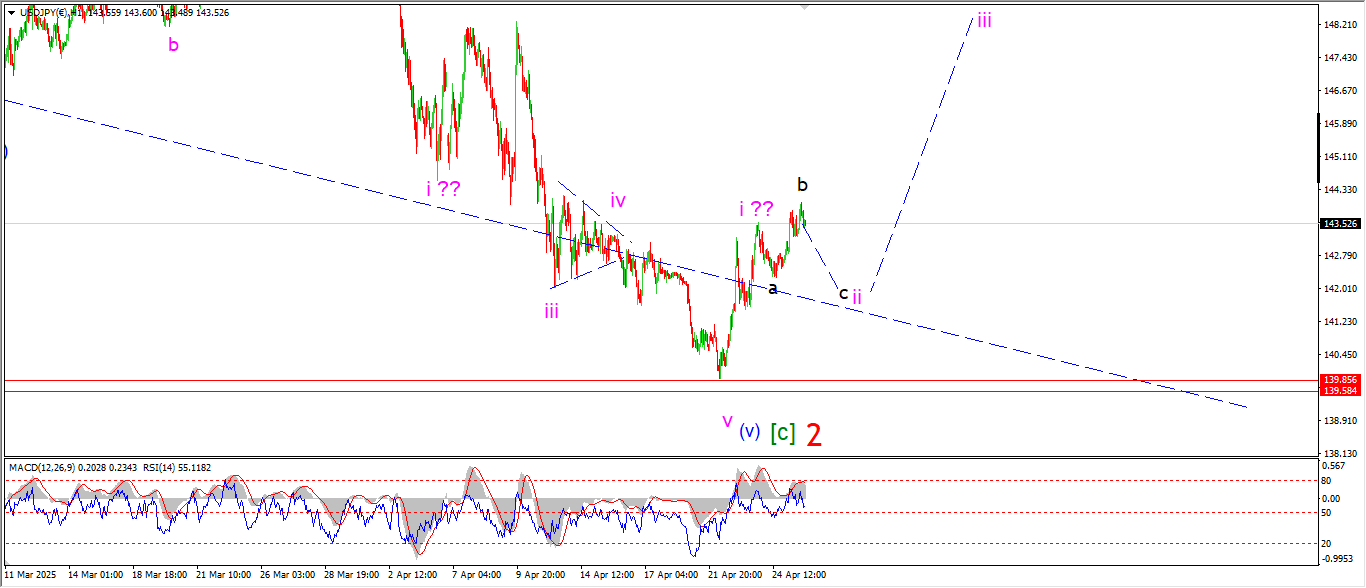
USDJPY 4hr.
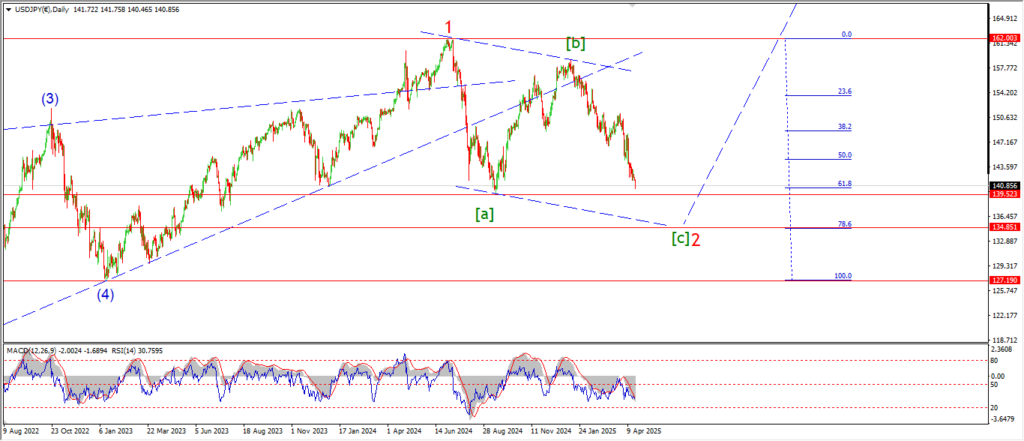
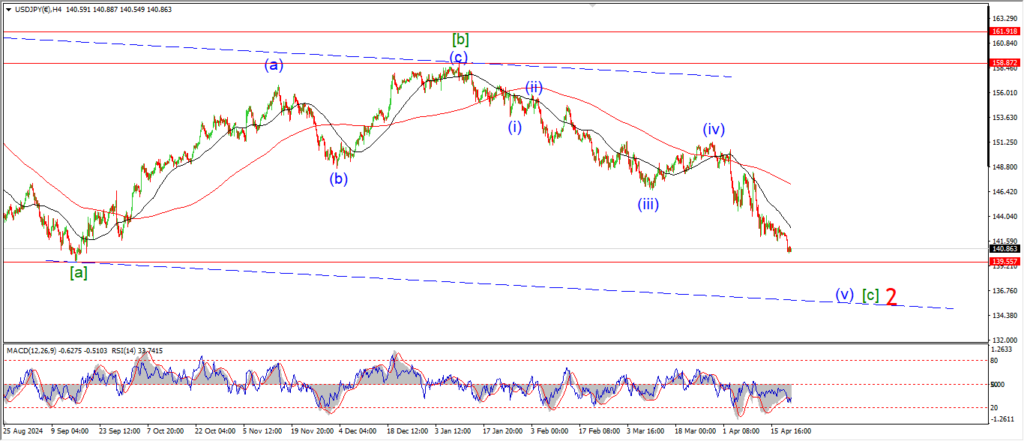
USDJPY daily.
USDJPY is beginning to act a little more like a reversal is building here.
The price has pushed back above the recent triangle correction in wave ‘iv’ completing an inverse head and shoulders.
We have a possible ‘i’ ‘ii’ pattern building.
And the fact that the price failed to break the target level at 139.58 is beginning to look like a positive development.
This can be viewed as a rejection in a failed fifth wave,
almost like the market recognizing that we have gone too far now.
This is a hunch,
not a fact!
But interesting none the less!
Monday;
Watch for wave ‘ii’ to hold above the recent lows at 139.85,
and for wave ‘ii’ to complete a higher low,
with a rally in wave ‘iii’ to follow.
DOW JONES.
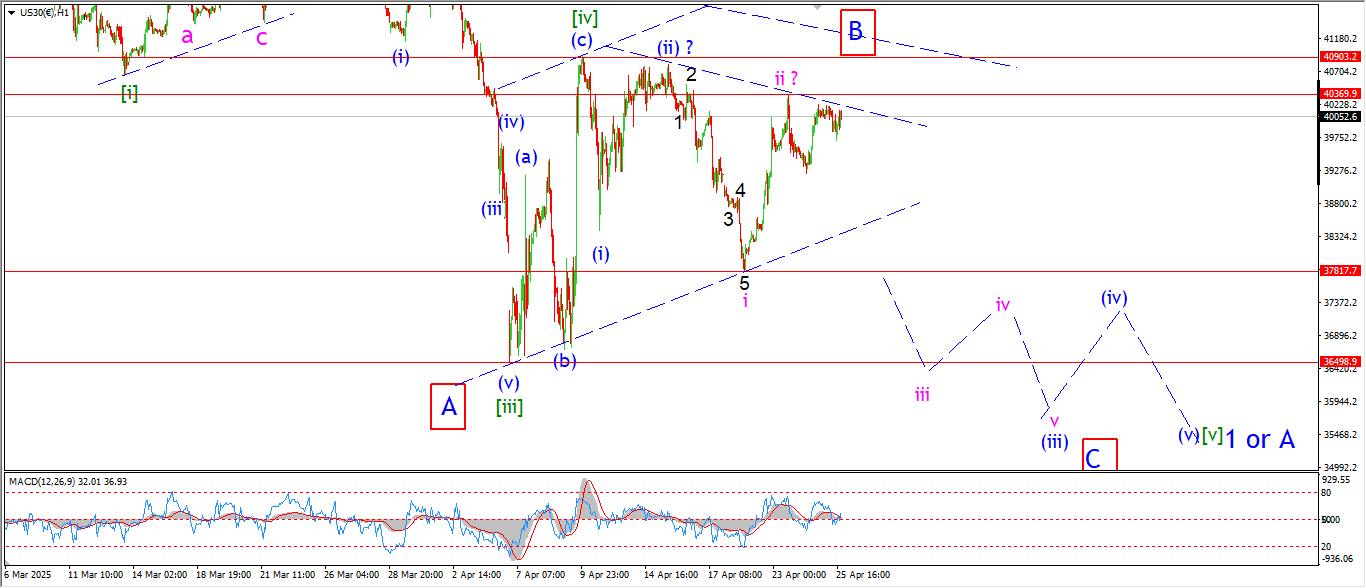
DOW 1hr.
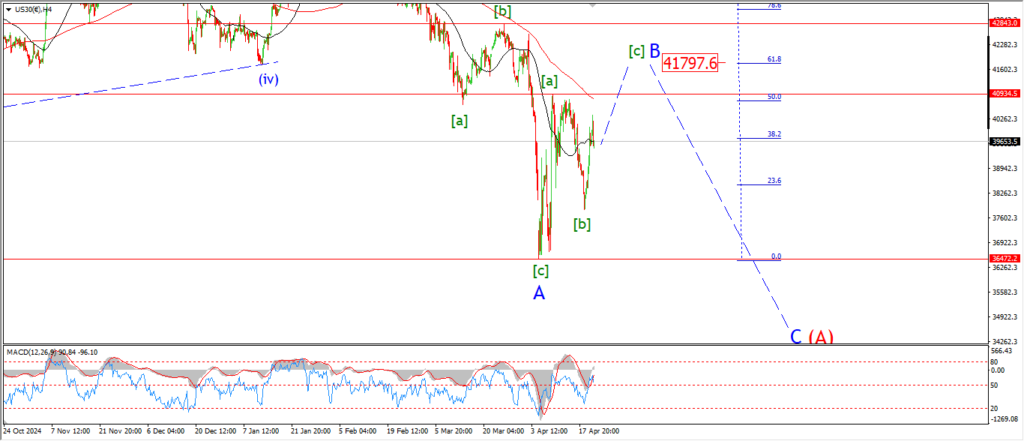
DOW 4hr
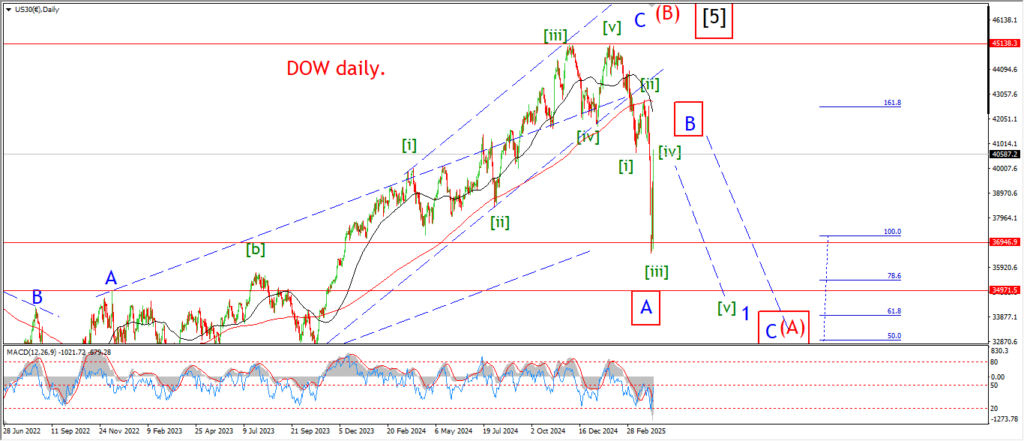
DOW daily.
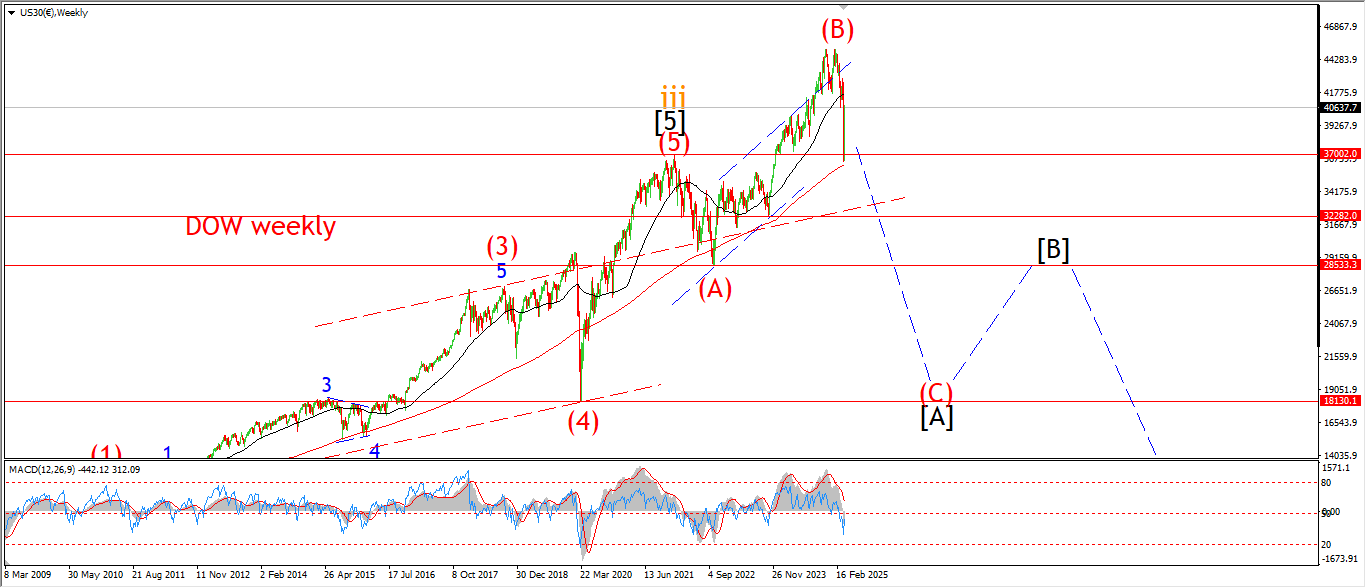
I am not hallucinating here when I suggest a range contraction is taking place on the hourly chart this week.
This action does open up another possibility for the alternate wave ‘B’ now.
This can be viewed as a triangle in wave ‘B’,
with wave ‘C’ to come later next week after another contraction in the triangle.
I think this pattern is one to watch,
especially if the high marked wave ‘ii’ holds on the hourly chart.
The 4hr chart shows a straight forward three wave flat correction higher.
and the main pattern on the hourly chart shows the five waves down un wave [v] idea.
Each one is actually equally valid at the moment.
And if the high at 40370 breaks that will signal out the pattern on the hourly chart as the valid one to go with.
Monday;
Watch for wave ‘iii’ down to take this market lower to confirm the main count.
the triangle idea also suggests a lower open to the week,
and a break of the wave ‘ii’ high at 40370 will confirm the 4hr count.
GOLD
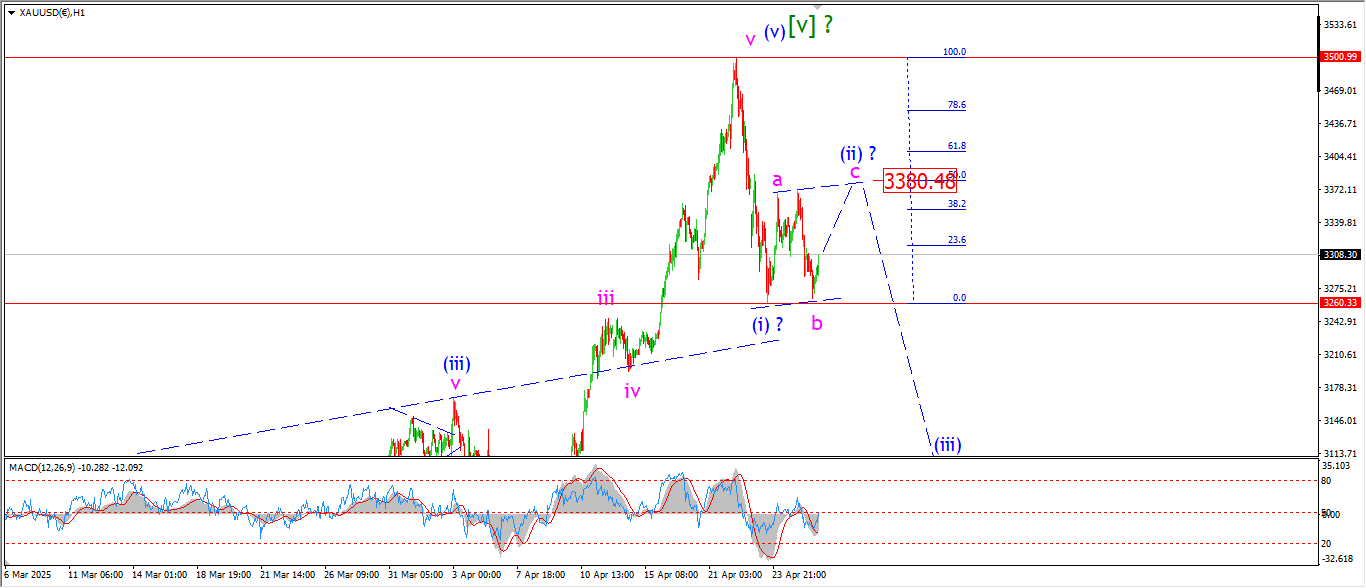
GOLD 1hr.
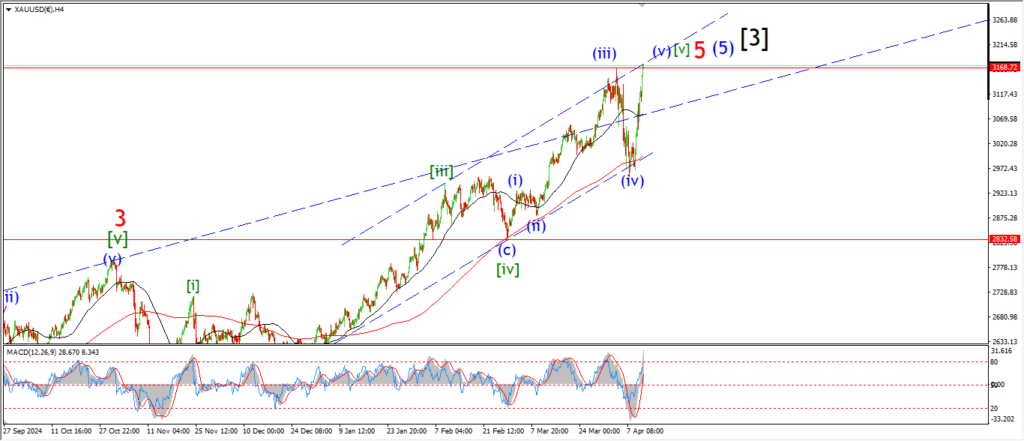
GOLD 4hr.
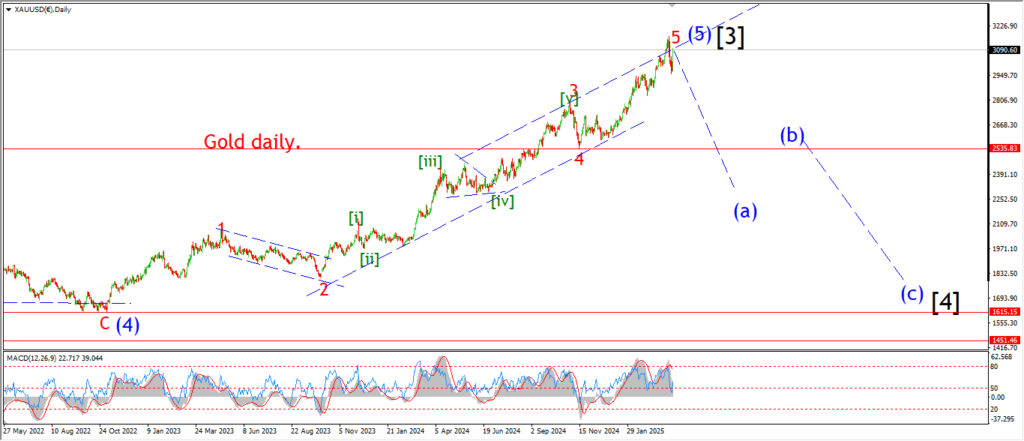
GOLD daily.
I am looking at a (i) (ii) pattern developing here in gold.
the action was lower today but that does fit an expanded flat pattern in wave ‘b’ of (ii).
Wave ‘c’ has turned higher this evening,
and I am looking for a rise into the 50% retracement level on Monday to complete this wave (ii) correction.
Monday;
Watch for wave ‘c’ to hit 3380 to complete this correction.
Wave (iii) down must then take over the for the rest of the week.
CRUDE OIL.
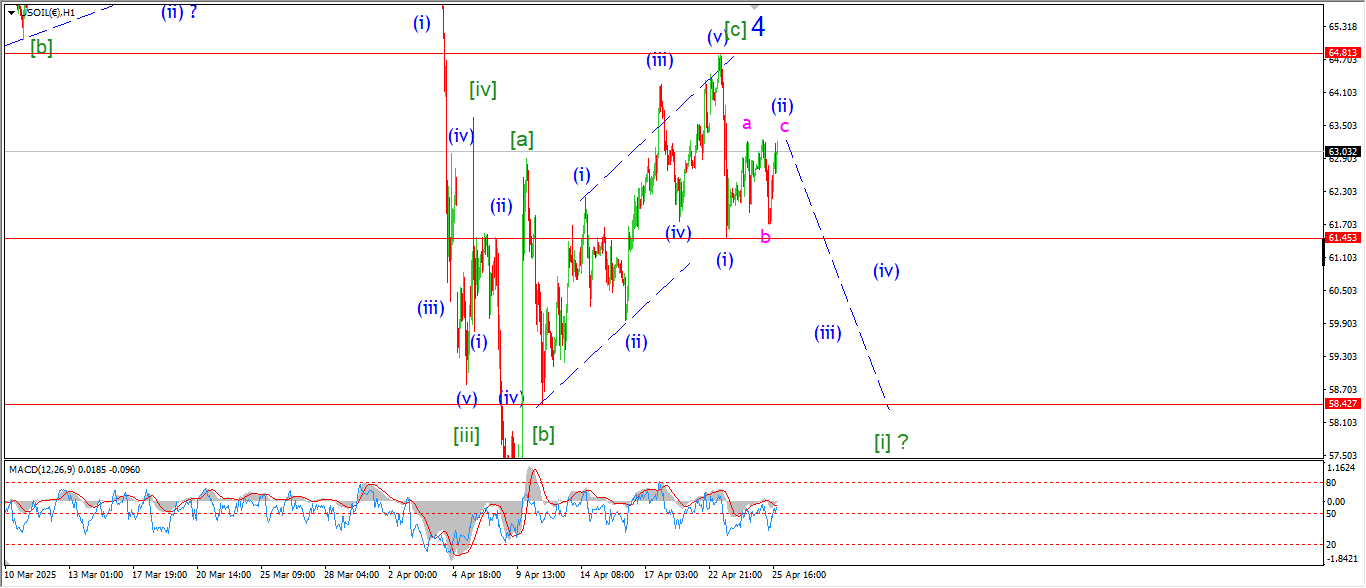
CRUDE OIL 1hr.
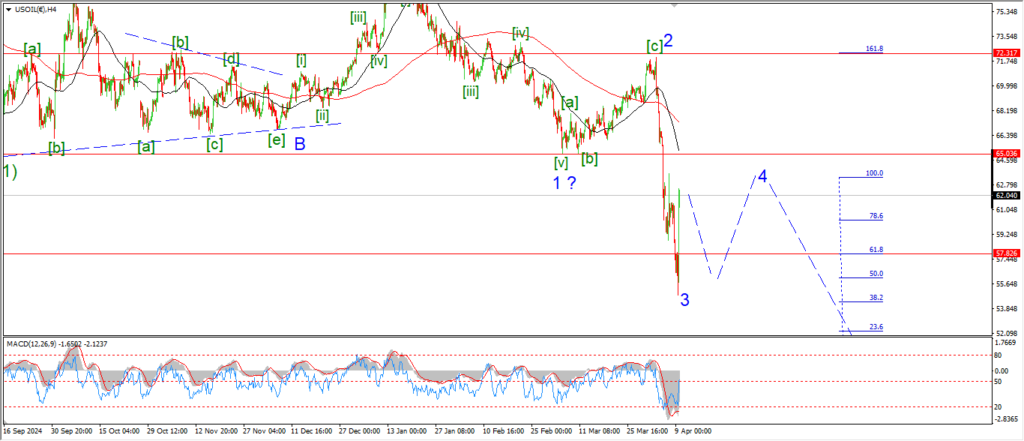
CRUDE OIL 4hr.
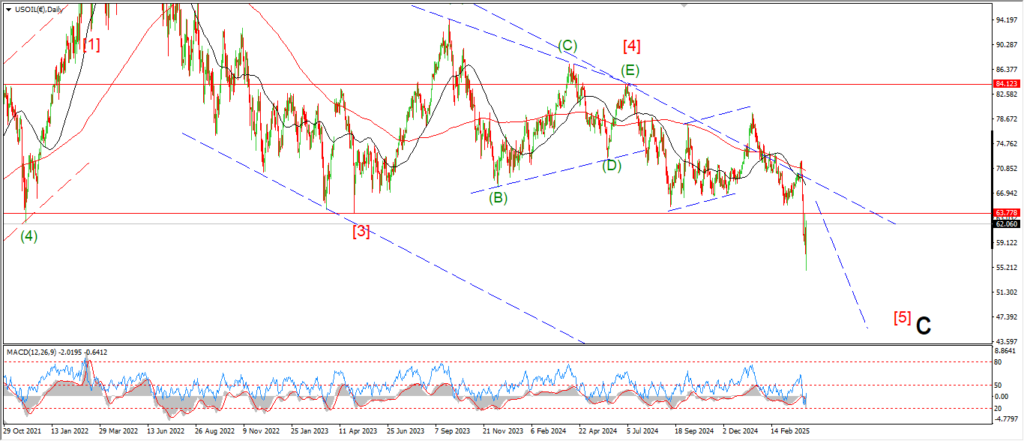
CRUDE OIL daily.
A flat correction is underway in crude oil also today.
the price has created a small higher low in wave ‘b’ this afternoon,
and now wave ‘c’ has bounced back to the highs of wave ‘a’ again as I write.
This complete three waves up in a flat correction pattern.
And wave (ii) should be close to completion now with wave (iii) of [i] set to turn lower again on Monday;
Monday;
watch for wave (ii) to complete that higher low correction,
and wave (iii) will be confirmed with a drop back below 61.45 again at the wave (i) lows.
S&P 500.
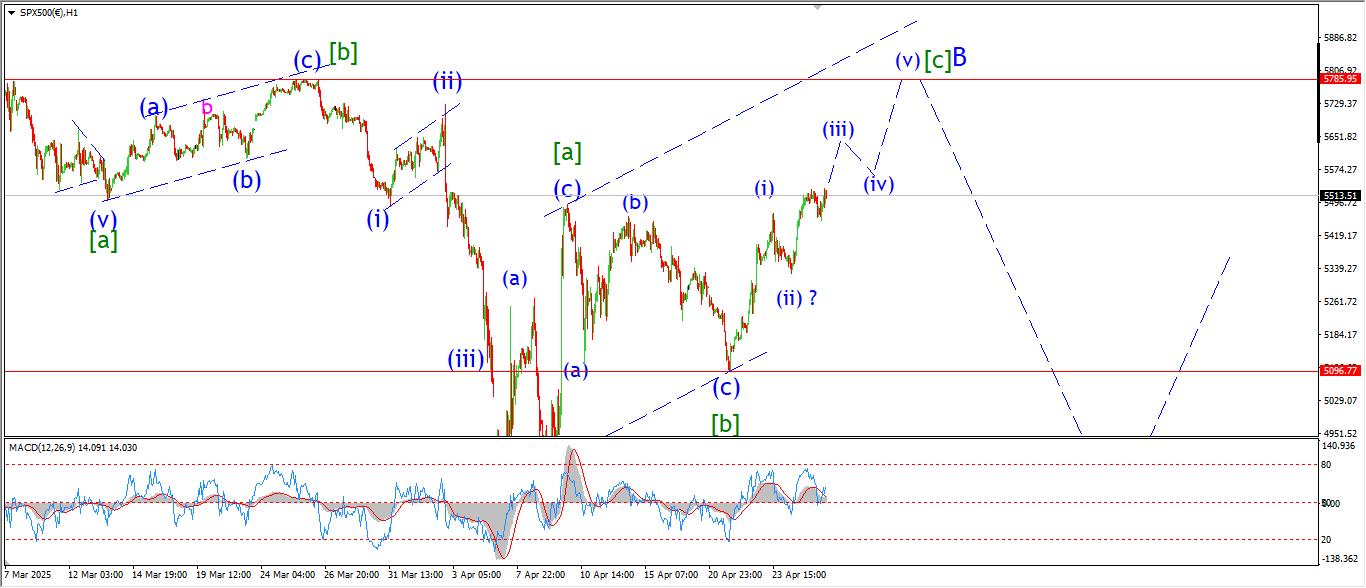
S&P 500 1hr
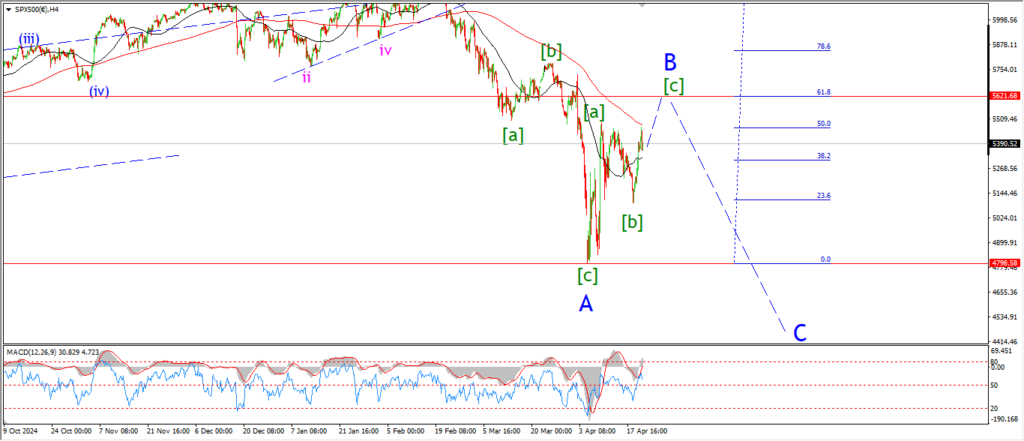
S&P 500 4hr
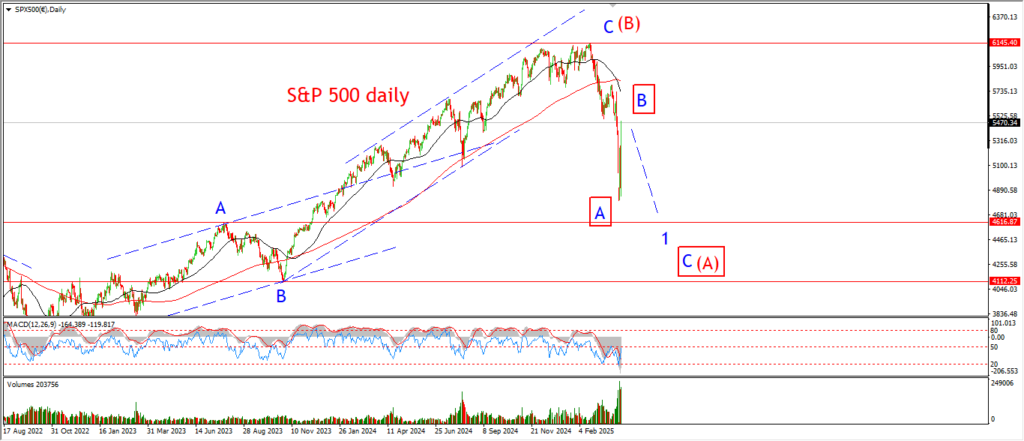
S&P 500 daily.
The overall correction in wave ‘B’ is tracing out a flat correction 3,3,5, pattern.
That was confirmed with the break out above the wave [a] high yesterday.
I am now tracking a five wave rally in wave [c] to complete wave ‘B’.
This rally should complete by midweek near 5800 again.
And from there I will begin to look lower again into wave ‘C’ down.
the rally in wave (iii) of [c] is a bit underwhelming today at least,
and I would expect a bit more upside to complete this wave if this pattern is a standard five waves as shown.
The action no Monday should tell us a lot about how wave [c] is going to complete.
Monday;
Watch for wave [c] to complete five waves up by midweek towards that 5800 target level.
SILVER.
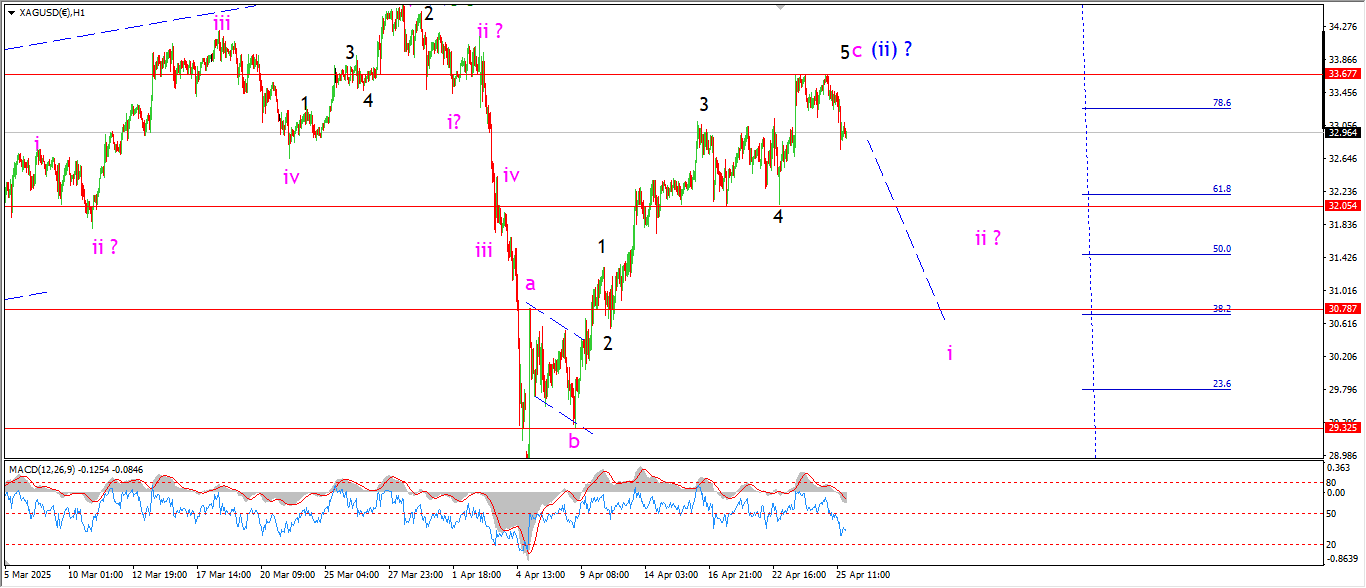
SILVER 1hr
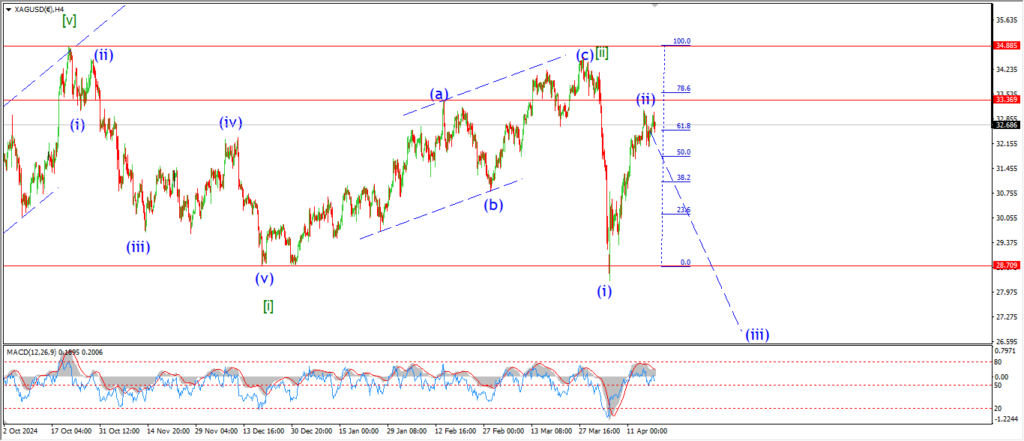
SILVER 4hr.
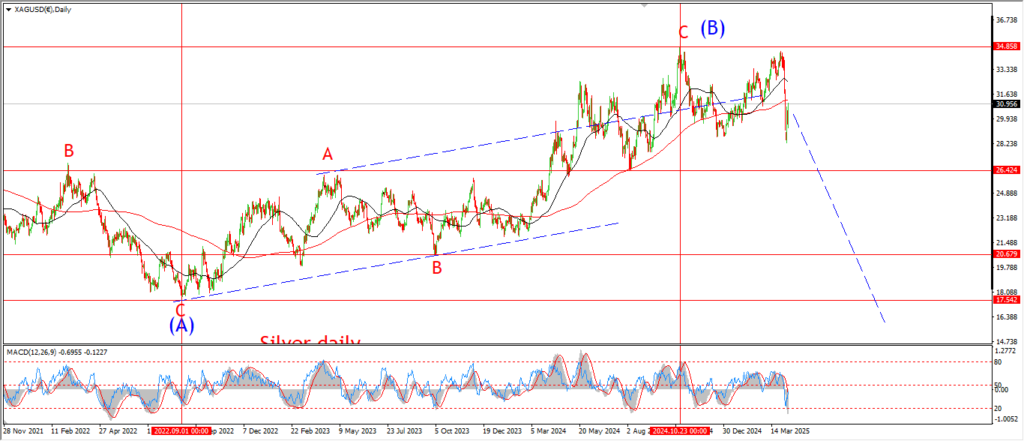
SILVER daily.
Silver turned off the wave (ii) high today to begin the trek lower into wave ‘i’ of (iii).
There is much more required here before I can call this pattern confirmed.
A break below the 32.00 level again will signal wave ‘i’ is underway.
Monday;
Watch for wave ‘i’ down to continue lower as shown towards the target at 30.70.
A break of the wave ‘4’ low will be a good signal that wave ‘i’ is in play.
BITCOIN
BITCOIN 1hr.
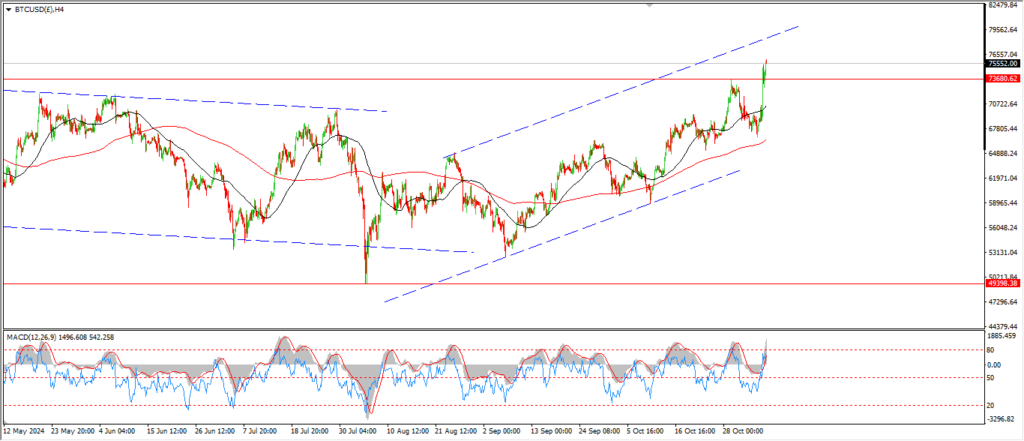
BITCOIN 4hr.
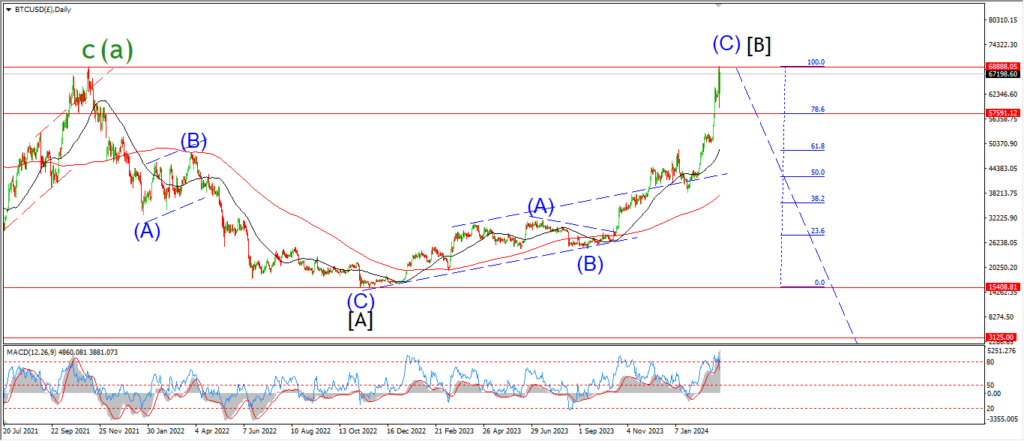
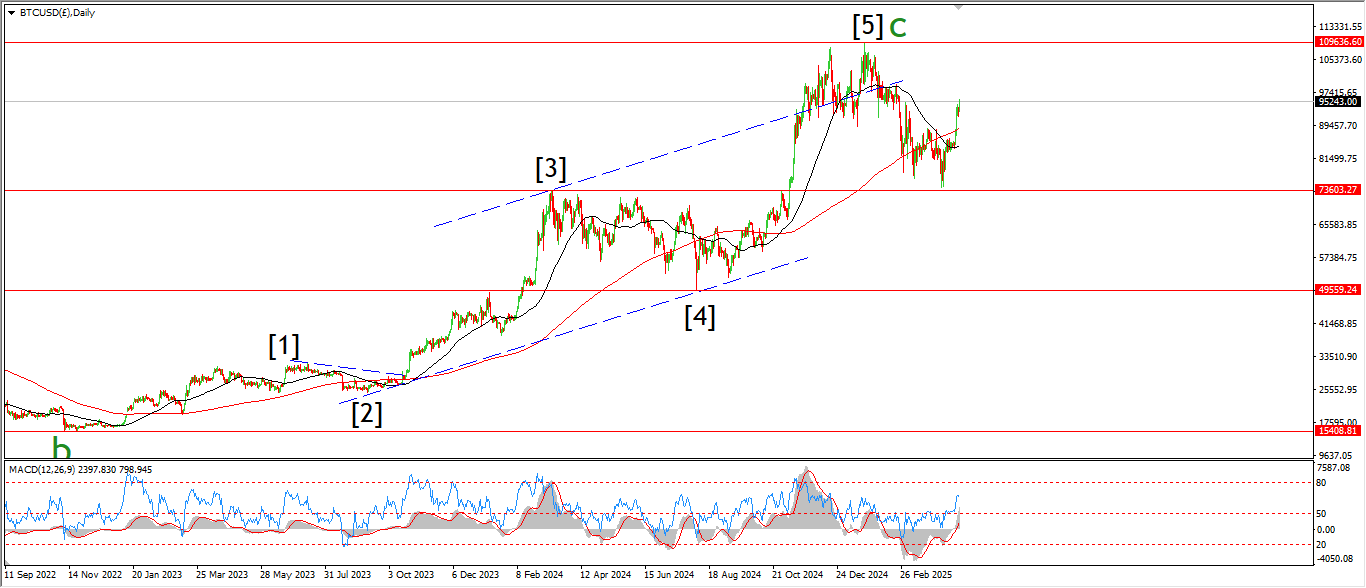
BITCOIN daily.
….
FTSE 100.
FTSE 100 1hr.
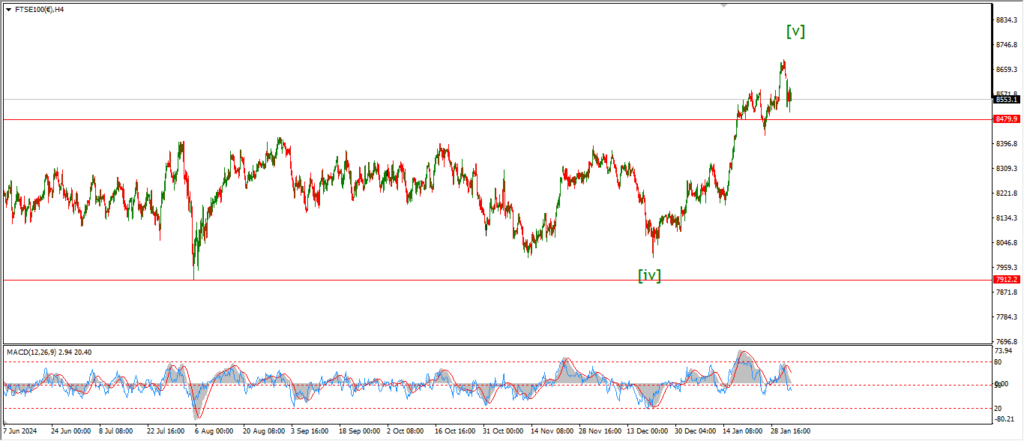
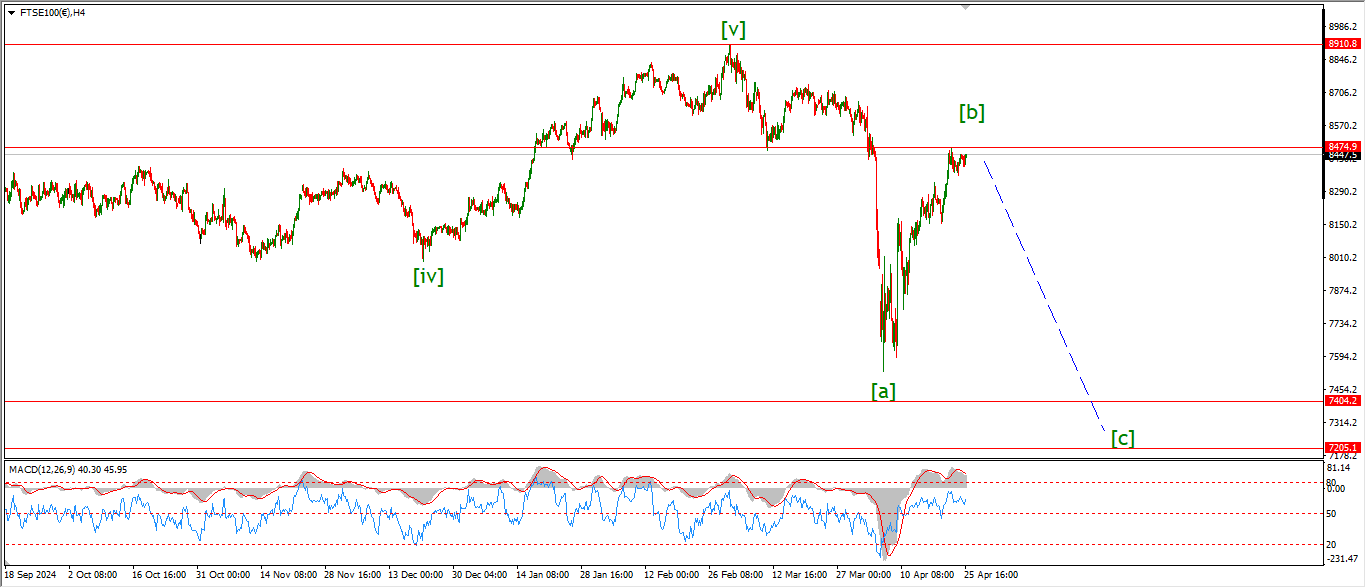
FTSE 100 4hr.
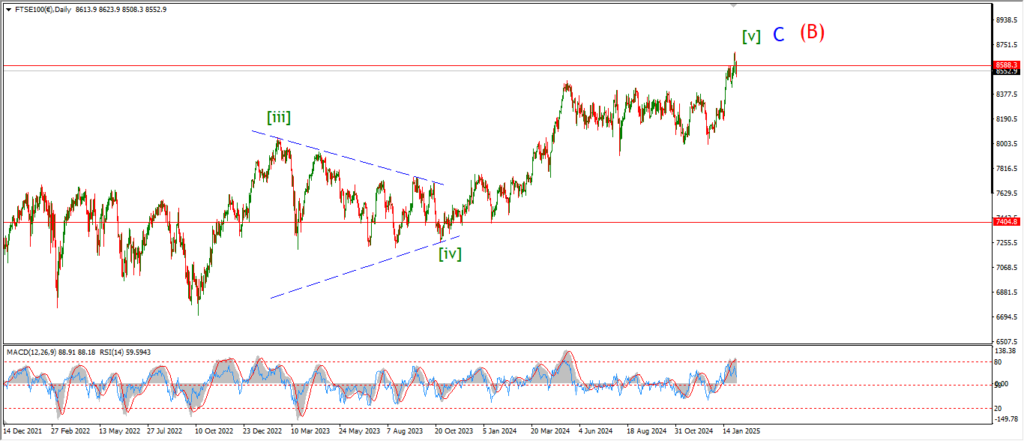
FTSE 100 daily.
….
DAX.
DAX 1hr
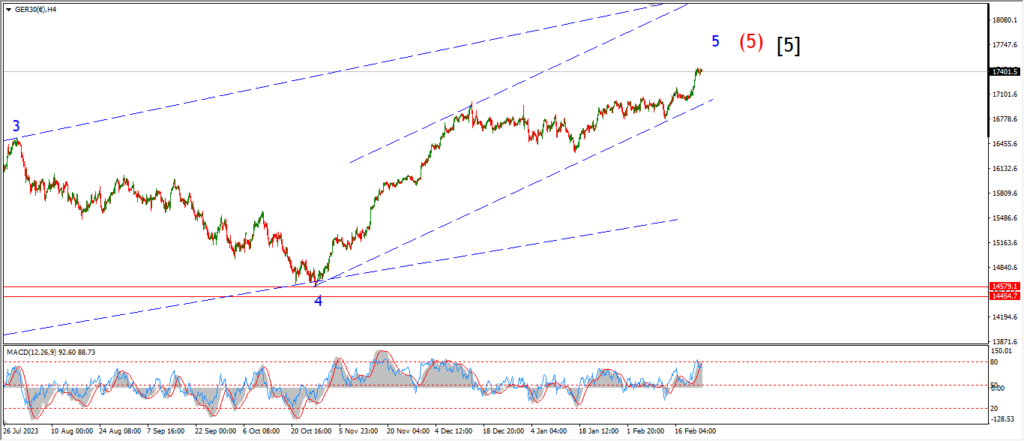
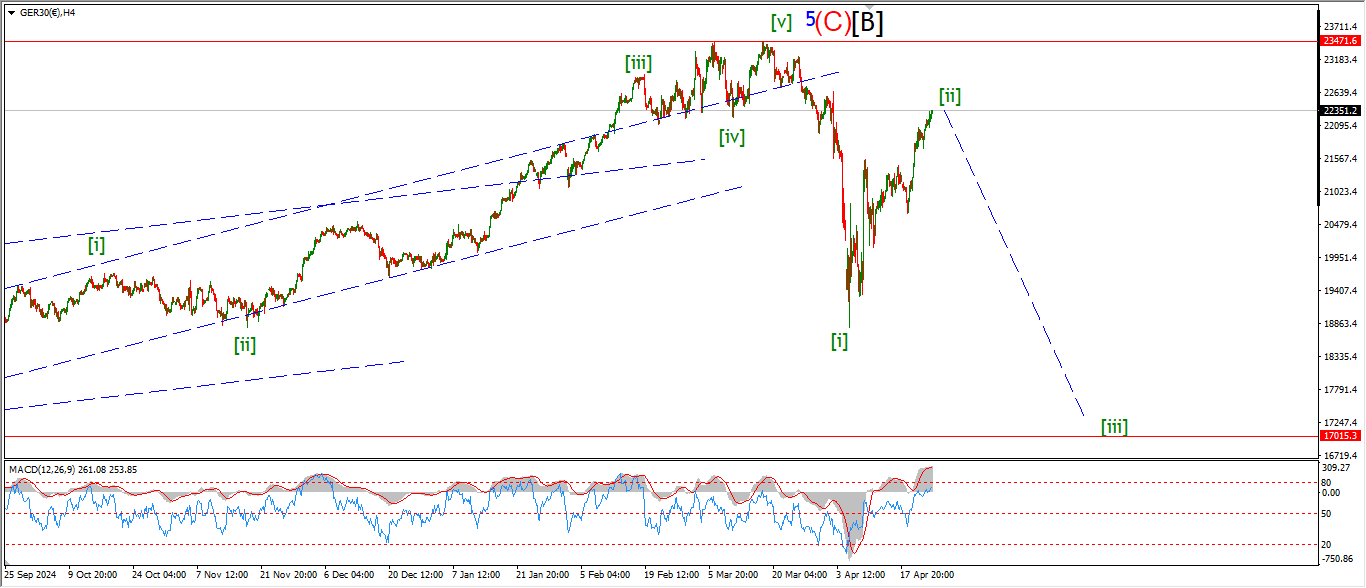
DAX 4hr

DAX daily.
….
NASDAQ 100.
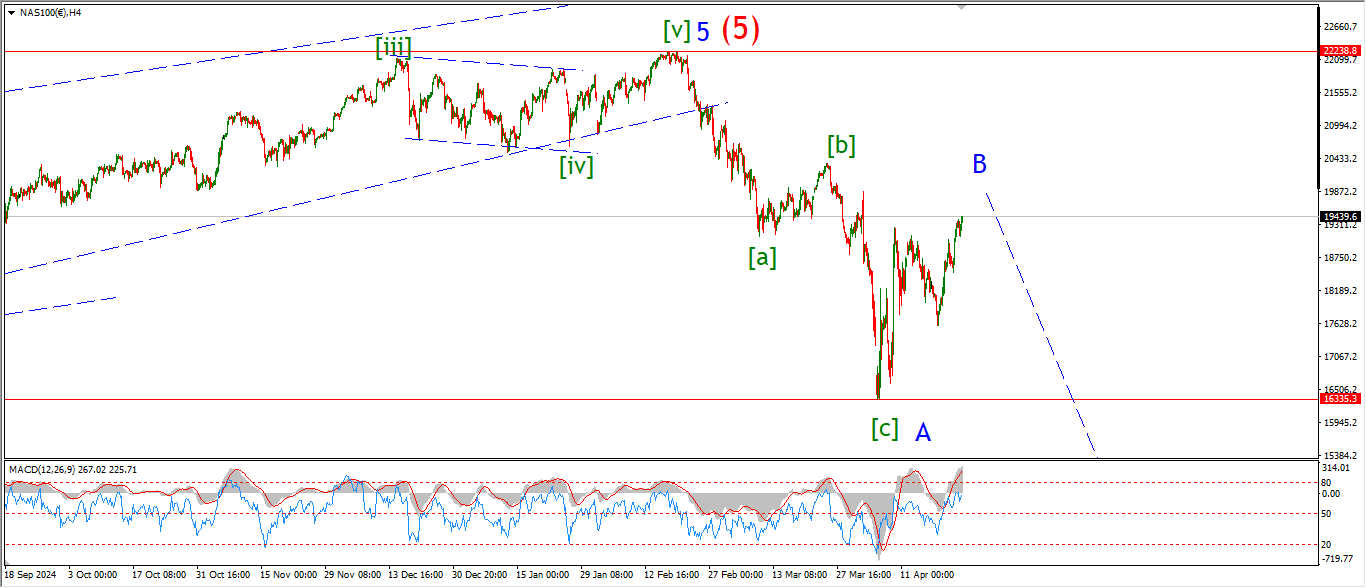
NASDAQ 1hr
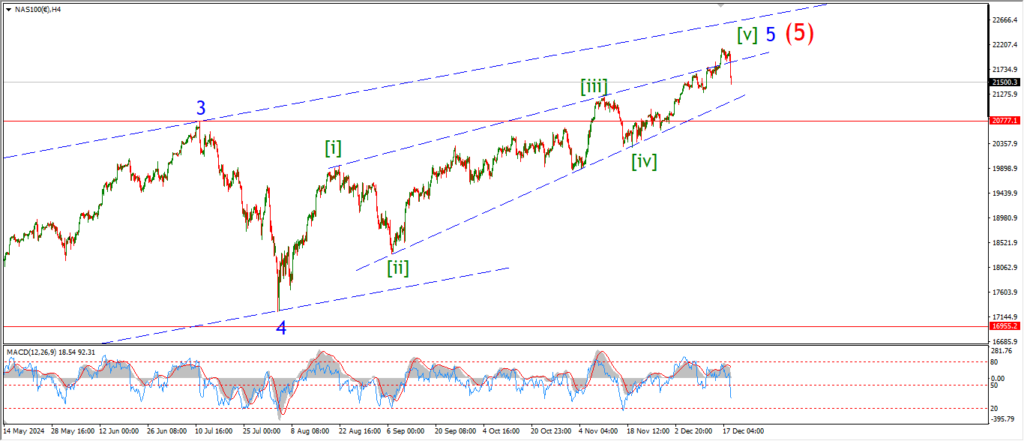
NASDAQ 4hr.
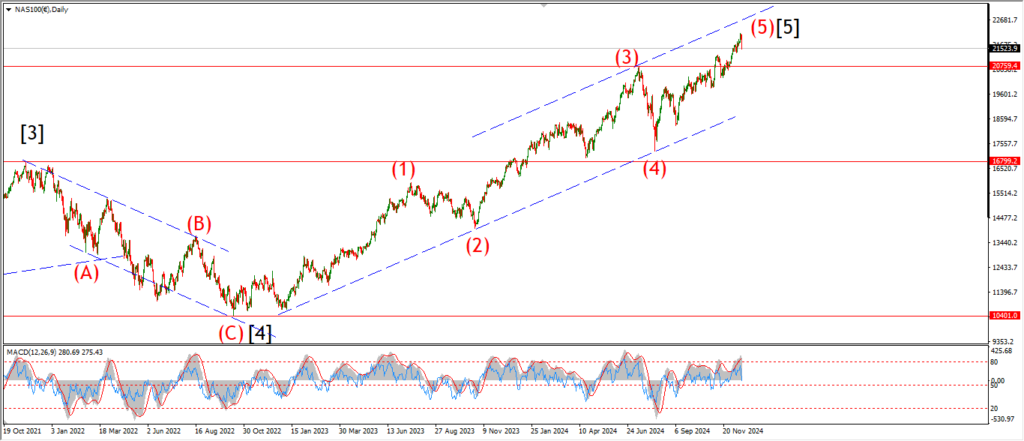
NASDAQ daily.
….