
[vc_row][vc_column][vc_separator border_width=”5″][/vc_column][/vc_row]
[vc_row][vc_column][vc_column_text]
Good evening folks.
[/vc_column_text][/vc_column][/vc_row]
[_s2If current_user_can(access_s2member_ccap_eurusd)]
[vc_row][vc_column][vc_separator border_width=”5″][/vc_column][/vc_row]
[vc_row][vc_column][vc_column_text]
EURUSD
[/vc_column_text][/vc_column][/vc_row]
[vc_row][vc_column][vc_separator border_width=”5″][/vc_column][/vc_row][vc_row][vc_column width=”2/3″][vc_custom_heading text=”1 hr” use_theme_fonts=”yes”][vc_column_text]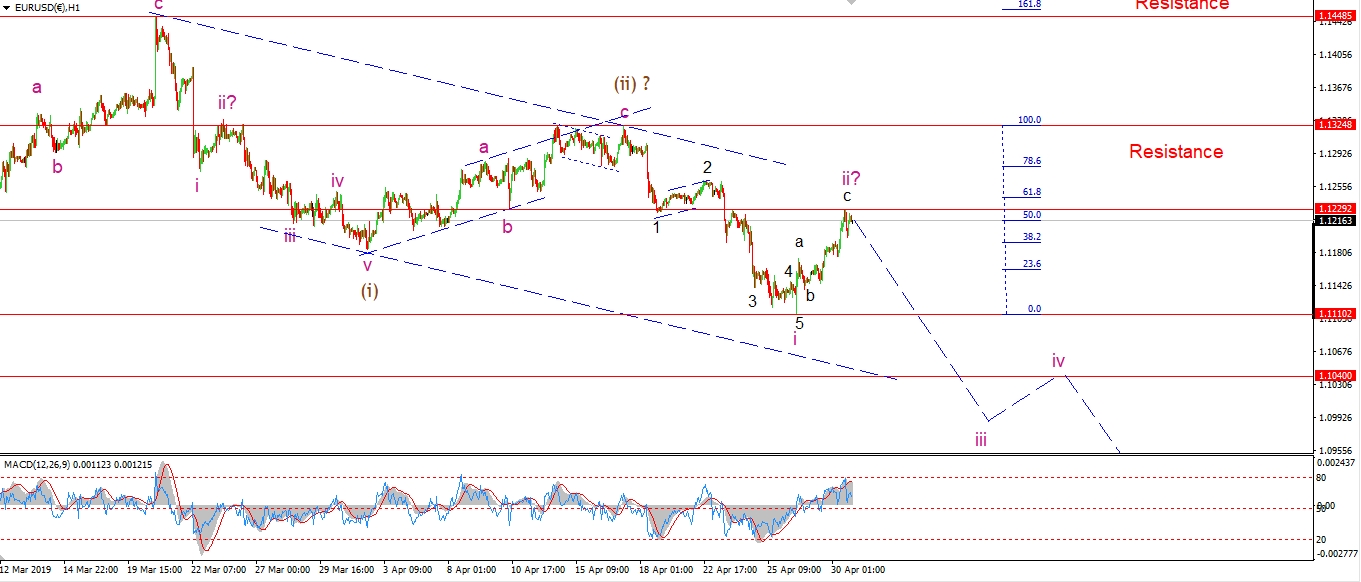 [/vc_column_text][/vc_column][vc_column width=”1/3″][vc_custom_heading text=”4 Hours” use_theme_fonts=”yes”][vc_column_text]
 [/vc_column_text][vc_custom_heading text=”Daily” use_theme_fonts=”yes”][vc_column_text]
 [/vc_column_text][/vc_column][/vc_row]
[vc_row][vc_column][vc_column_text]
The Price rallied again today and pushed just above the 50% retracement level.
I have labelled todays rally as wave ‘c’ of ‘ii’.
Wave ‘c’ has a five wave form into todays high,
so this may well be a zigzag correction in wave ‘ii’.
the key now
is for the price to turn back down again and confirm that the rally was in fact a three wave correction.
That will happen with a break of 1.1110 again.
Tomorrow;
Watch for the price top top in wave ‘ii’
and turn lower again into wave ‘iii’.
[/vc_column_text][/vc_column][/vc_row]
[/_s2If]
[_s2If current_user_can(access_s2member_ccap_gbpusd)]
[vc_row][vc_column][vc_separator border_width=”5″][/vc_column][/vc_row][vc_row][vc_column][vc_column_text]
GBPUSD
[/vc_column_text][/vc_column][/vc_row][vc_row][vc_column][vc_separator border_width=”5″][/vc_column][/vc_row][vc_row][vc_column width=”2/3″][vc_custom_heading text=”1 hr” use_theme_fonts=”yes”][vc_column_text]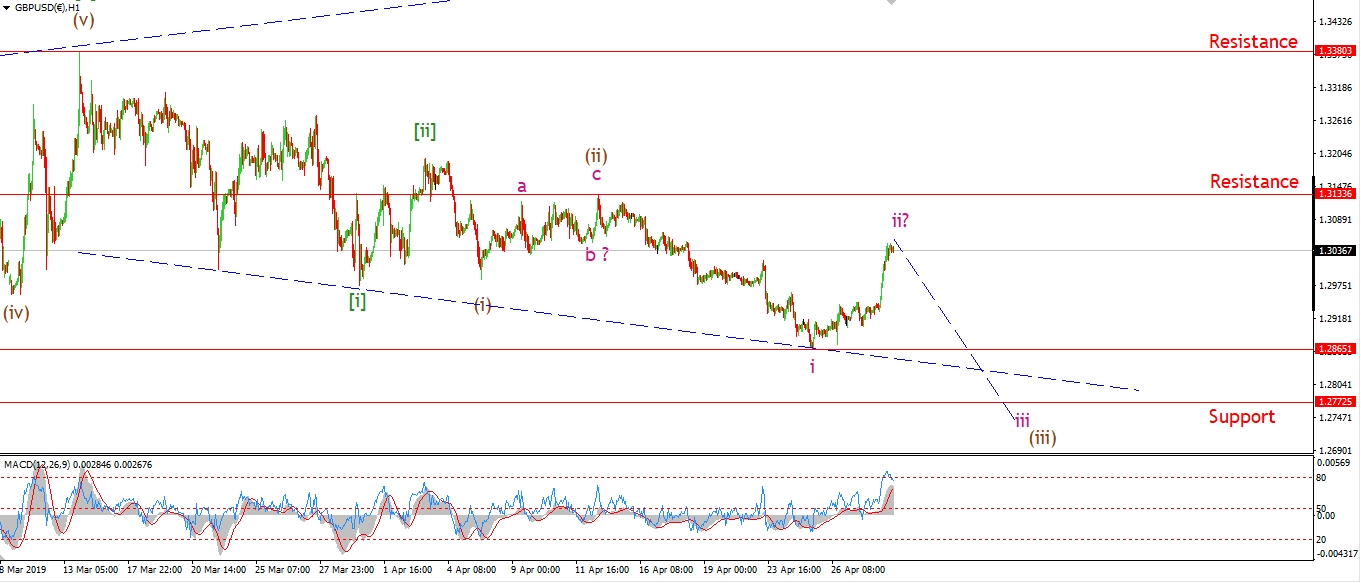 [/vc_column_text][/vc_column][vc_column width=”1/3″][vc_custom_heading text=”4 Hours” use_theme_fonts=”yes”][vc_column_text]
 [/vc_column_text][vc_custom_heading text=”Daily” use_theme_fonts=”yes”][vc_column_text]
 [/vc_column_text][/vc_column][/vc_row]
[vc_row][vc_column][vc_column_text]
Much like EURUSD,
Cable rallied also today which has forced a rethink of the short term wave count.
I have moved up the count by one degree,
This allows for a set of three impulse waves lower.
And that should complete now in wave ‘ii’ pink.
The high at wave (ii) must hold.
Adn price must now turn lower into wave ‘iii’ of (iii).
Tomorrow;
watch for wave ‘ii’ to find a high below 1.3133,
and then turn back down sharply again in wave ‘iii’ of (iii).
[/vc_column_text][/vc_column][/vc_row]
[/_s2If]
[_s2If current_user_can(access_s2member_ccap_usdjpy)]
[vc_row][vc_column][vc_separator border_width=”5″][/vc_column][/vc_row][vc_row][vc_column][vc_column_text]
USDJPY
[/vc_column_text][/vc_column][/vc_row][vc_row][vc_column][vc_separator border_width=”5″][/vc_column][/vc_row][vc_row][vc_column width=”2/3″][vc_custom_heading text=”1 hr” use_theme_fonts=”yes”][vc_column_text]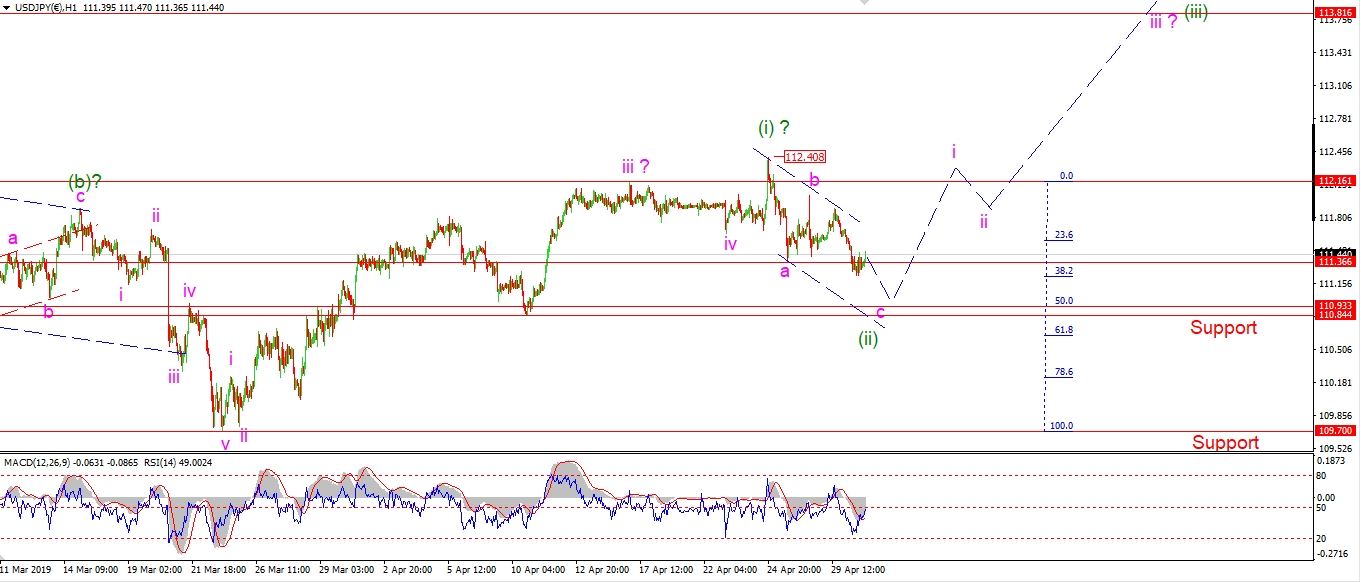 [/vc_column_text][/vc_column][vc_column width=”1/3″][vc_custom_heading text=”4 Hours” use_theme_fonts=”yes”][vc_column_text]
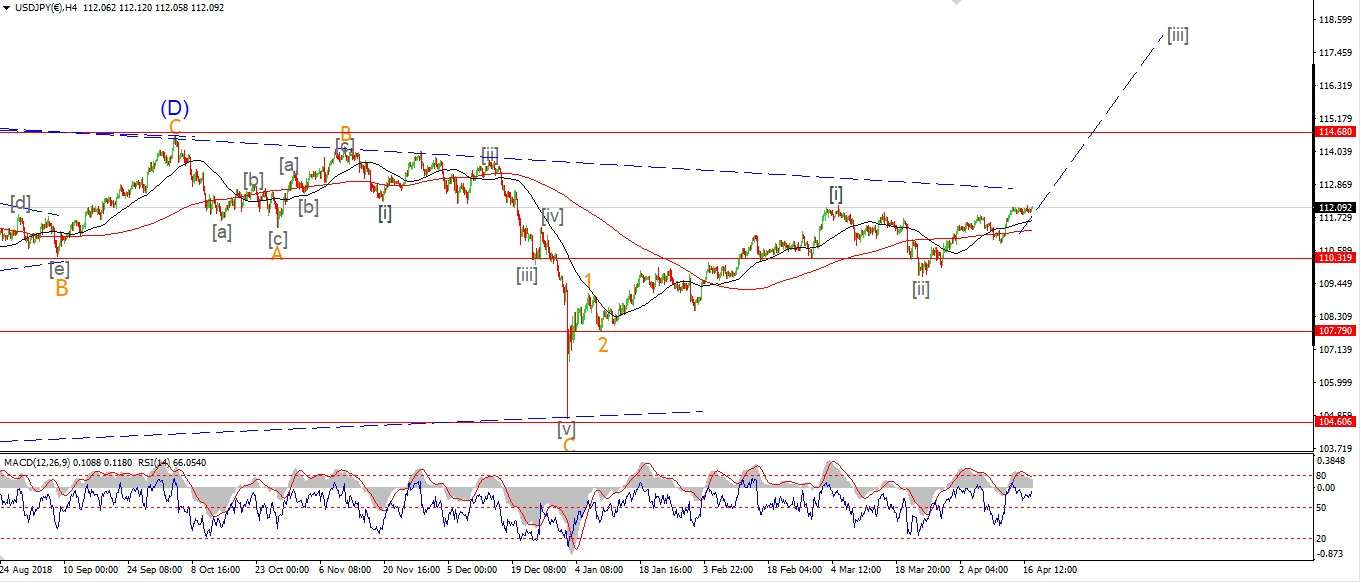 [/vc_column_text][vc_custom_heading text=”Daily” use_theme_fonts=”yes”][vc_column_text]
 [/vc_column_text][/vc_column][/vc_row]
[vc_row][vc_column][vc_column_text]
Well USDJPY confirmed my fears today,
by pushing lower and triggering the alternate count.
It looks like wave (ii) is now set to hit the 50% retracement level at 110.93.
Wave ‘c’ of (ii) should trace out a five wave form
and is on its way to doing just that now.
There is a cluster of targets for wave (ii) shown on the short term chart.
The 50% retracement level as mentioned above,
and the previous fourth wave at 110.84.
Tomorrow;
Watch for wave ‘c’ of (ii) to find a low in that support area.
We should see an initial turn higher into wave (iii) by the end of the week.
[/vc_column_text][/vc_column][/vc_row]
[/_s2If]
[_s2If current_user_can(access_s2member_ccap_dow_jones)]
[vc_row][vc_column][vc_separator border_width=”5″][/vc_column][/vc_row][vc_row][vc_column][vc_column_text]
DOW JONES INDUSTRIALS
[/vc_column_text][/vc_column][/vc_row][vc_row][vc_column][vc_separator border_width=”5″][/vc_column][/vc_row][vc_row][vc_column width=”2/3″][vc_custom_heading text=”1 hr” use_theme_fonts=”yes”][vc_column_text]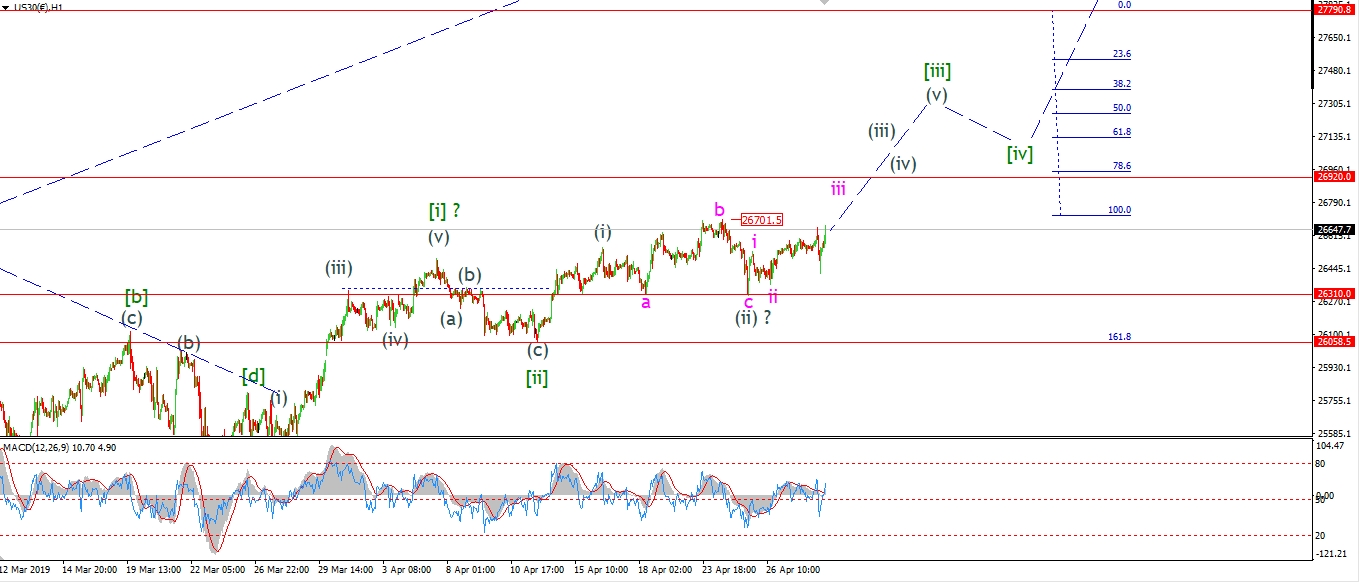 [/vc_column_text][/vc_column][vc_column width=”1/3″][vc_custom_heading text=”4 Hours” use_theme_fonts=”yes”][vc_column_text]
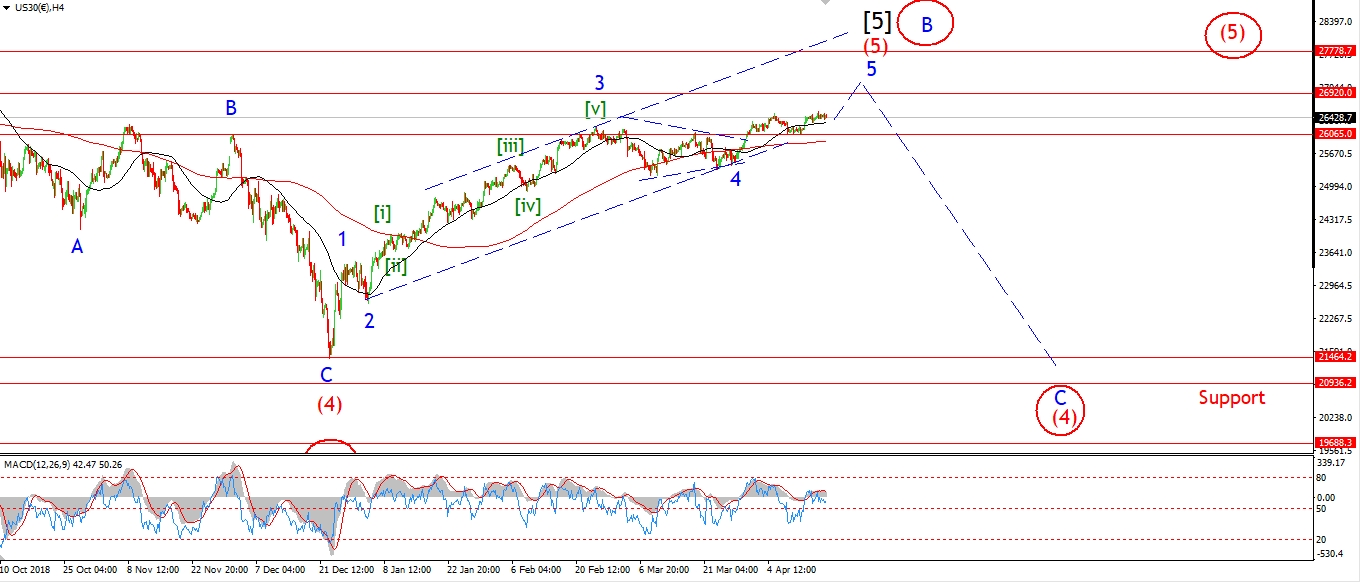 [/vc_column_text][vc_custom_heading text=”Daily” use_theme_fonts=”yes”][vc_column_text]
 [/vc_column_text][/vc_column][/vc_row]
[vc_row][vc_column][vc_column_text]
The DOW opened higher and then traded immediately lower for the next 2 hours this morning.
loosing 230 points or so at the low.
But now we are actually trading positively again at the close.
This is a fractured market,
shaky results from many companies are causing selling,
And then the record optimism is bidding the market right back up again!
I still think the DOW will post a new high this week,
as wave (iii) carries us higher.
The final leg up does not have to hit the upper target at 27790
for this to count as a a completed wave (5) red.
Even a slight new high above 26920 will do the trick.
But I do want to see a new high occur
in order to rule out that messy failed fifth wave idea once and for all.
Tomorrow;
Onward and upward for wave (iii) grey.
watch for 26310 to hold and wave ‘iii’ of (iii) to break above 26700.
[/vc_column_text][/vc_column][/vc_row]
[/_s2If]
[_s2If current_user_can(access_s2member_ccap_gold)]
[vc_row][vc_column][vc_separator border_width=”5″][/vc_column][/vc_row][vc_row][vc_column][vc_column_text]
GOLD
[/vc_column_text][/vc_column][/vc_row][vc_row][vc_column][vc_separator border_width=”5″][/vc_column][/vc_row][vc_row][vc_column width=”2/3″][vc_custom_heading text=”1 hr” use_theme_fonts=”yes”][vc_column_text]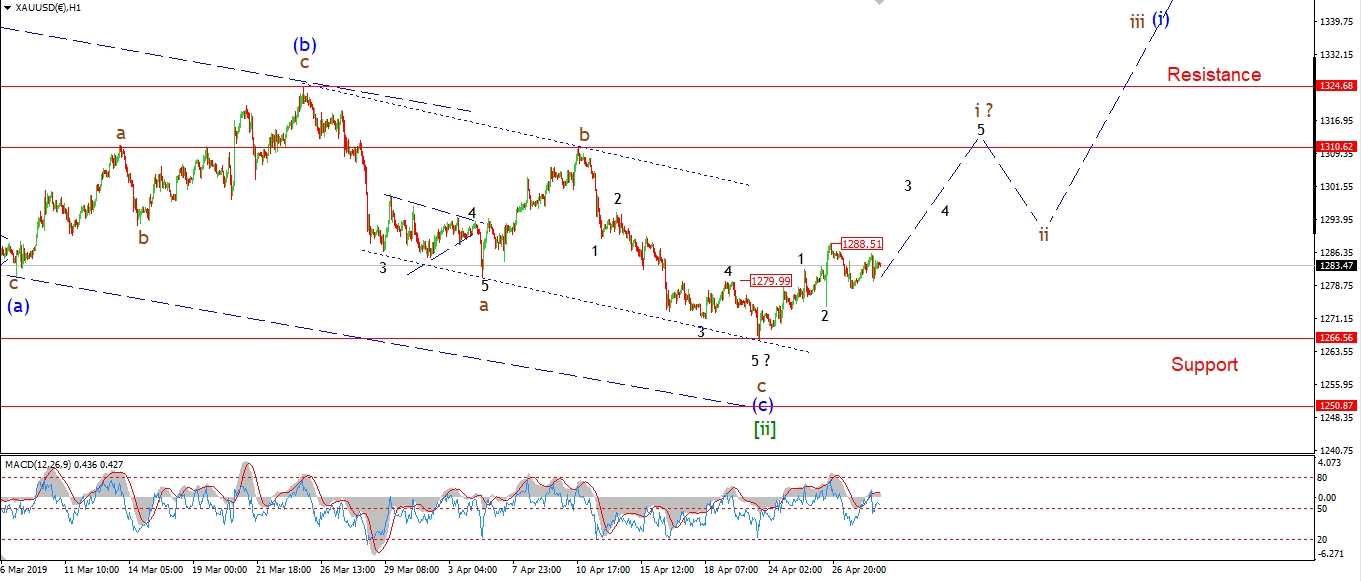 [/vc_column_text][/vc_column][vc_column width=”1/3″][vc_custom_heading text=”4 Hours” use_theme_fonts=”yes”][vc_column_text]
 [/vc_column_text][vc_custom_heading text=”Daily” use_theme_fonts=”yes”][vc_column_text]
 [/vc_column_text][/vc_column][/vc_row]
[vc_row][vc_column][vc_column_text]
Despite inching higher today,
GOLD has not brought us closer the the desired five wave pattern higher yet.
The internal structure is getting messy,
so I want to see a rally form pretty quickly in a third wave.
A break of 1288.50 should confirm wave ‘3’ of ‘i’.
Tomorrow;
Watch for wave ‘3’ to make the break of 1288 and push towards 1300 again.
1266.56 must hold.
[/vc_column_text][/vc_column][/vc_row]
[/_s2If]
[_s2If current_user_can(access_s2member_ccap_crude)]
[vc_row][vc_column][vc_separator border_width=”5″][/vc_column][/vc_row][vc_row][vc_column][vc_column_text]
U.S CRUDE OIL
[/vc_column_text][/vc_column][/vc_row][vc_row][vc_column][vc_separator border_width=”5″][/vc_column][/vc_row][vc_row][vc_column width=”2/3″][vc_custom_heading text=”1 hr” use_theme_fonts=”yes”][vc_column_text]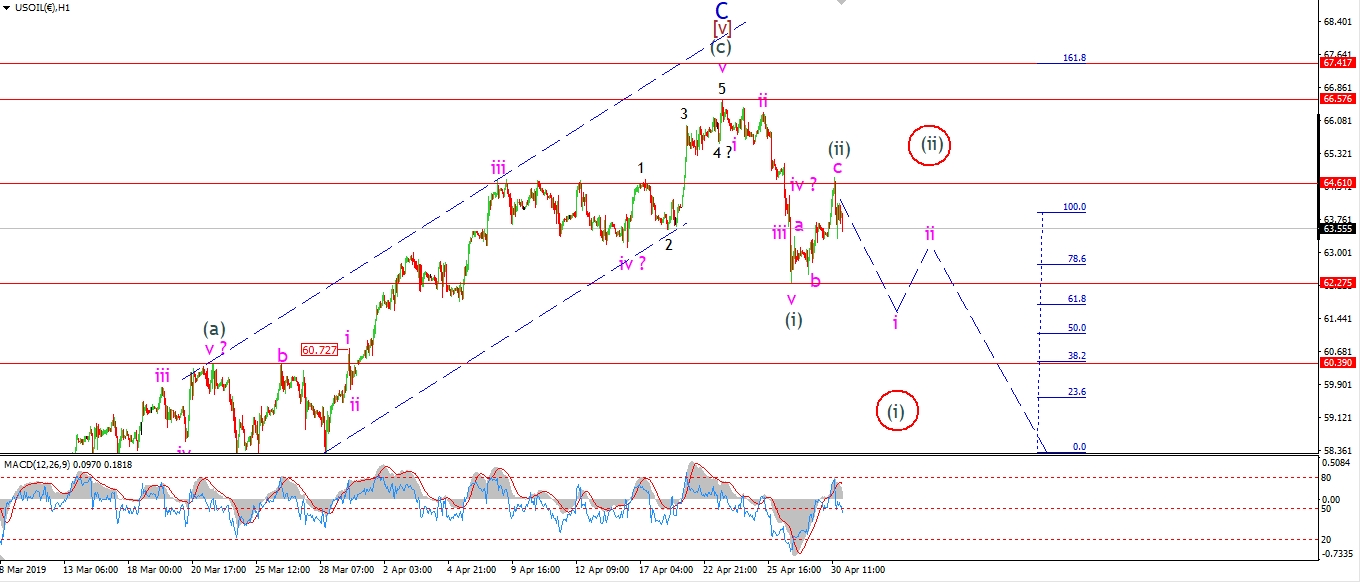 [/vc_column_text][/vc_column][vc_column width=”1/3″][vc_custom_heading text=”4 Hours” use_theme_fonts=”yes”][vc_column_text]
 [/vc_column_text][vc_custom_heading text=”Daily” use_theme_fonts=”yes”][vc_column_text]
 [/vc_column_text][/vc_column][/vc_row]
[vc_row][vc_column][vc_column_text]
The action in crude is getting more interesting by the day.
The rally in wave (ii) has come earlier than expected.
I would have preferred to see a bigger correction in wave ‘iv’ and then drop to a new low in wave ‘v’.
But the market has other ideas.
The rally today pushed right back the that left shoulder at 64.60,
and then sold off sharply again this evening.
This may be the beginning of a third wave down over the rest of the week.
Tomorrow;
If we see the decline continue tomorrow,
and the price breaks the recent low at 62.28,
then we are on for a decline in a possible wave (iii) grey.
Wave (iii) grey should break the 60.00 handle again with ease.
[/vc_column_text][/vc_column][/vc_row]
[/_s2If]
[_s2If current_user_can(access_s2member_ccap_us10yr)]
[vc_row][vc_column][vc_separator border_width=”5″][/vc_column][/vc_row][vc_row][vc_column][vc_column_text]
US 10 yr Treasuries.
[/vc_column_text][/vc_column][/vc_row][vc_row][vc_column][vc_separator border_width=”5″][/vc_column][/vc_row][vc_row][vc_column width=”2/3″][vc_custom_heading text=”1 hr” use_theme_fonts=”yes”][vc_column_text]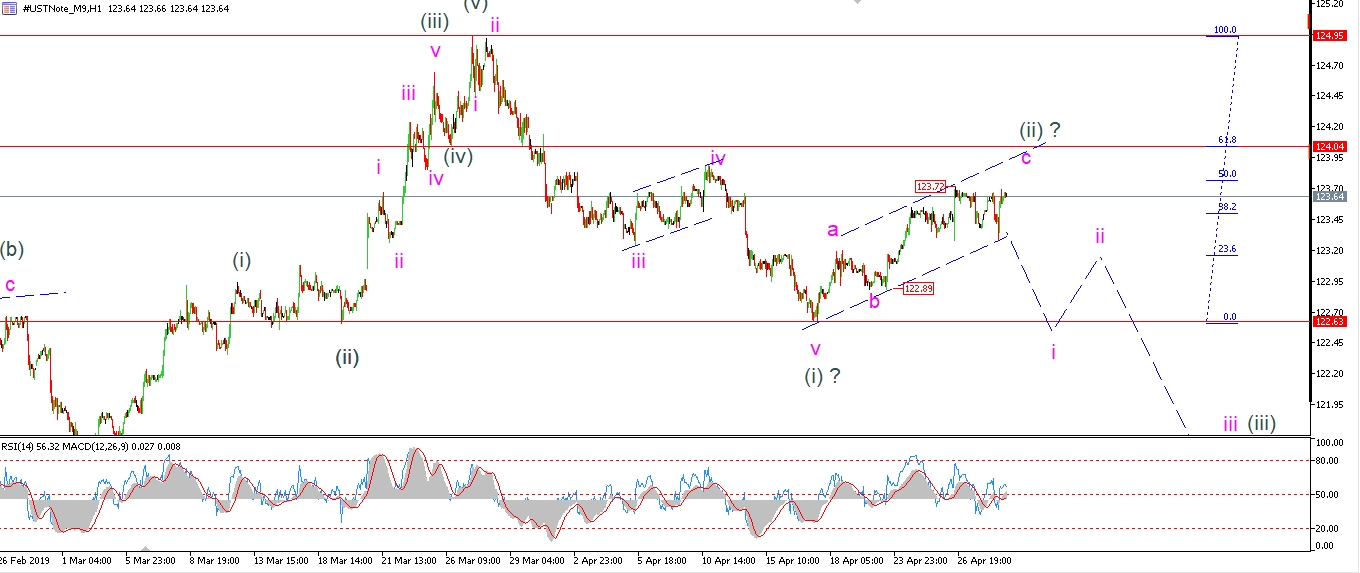 [/vc_column_text][/vc_column][vc_column width=”1/3″][vc_custom_heading text=”4 Hours” use_theme_fonts=”yes”][vc_column_text]
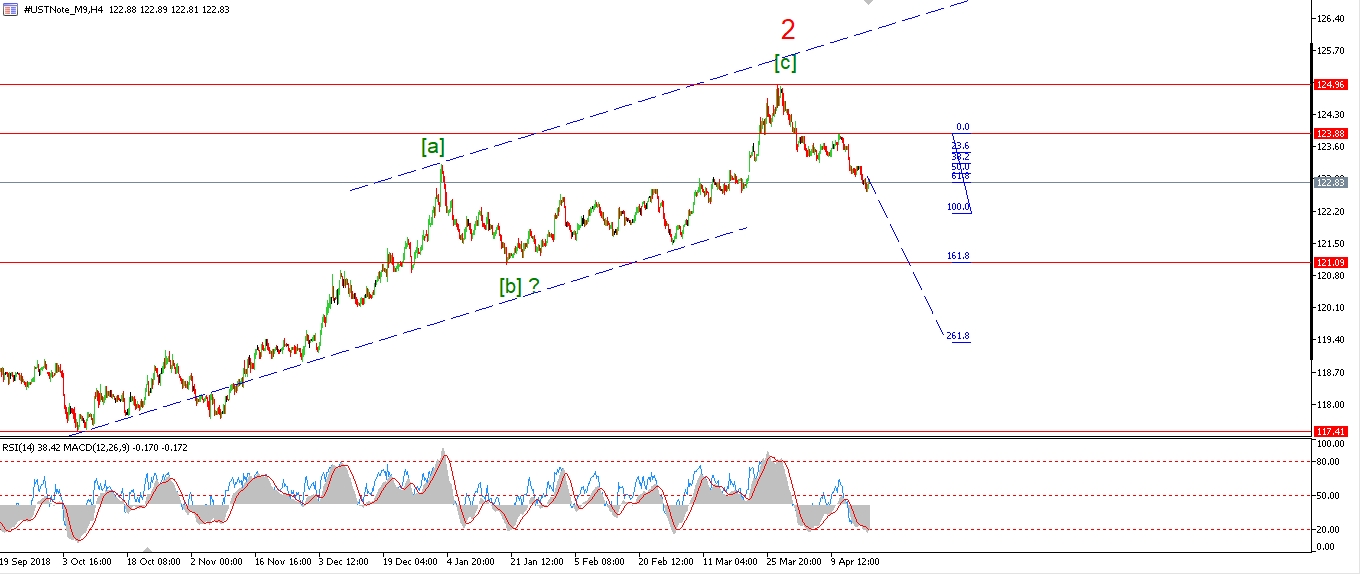 [/vc_column_text][vc_custom_heading text=”Daily” use_theme_fonts=”yes”][vc_column_text]
 [/vc_column_text][/vc_column][/vc_row]
[vc_row][vc_column][vc_column_text]
It seems that wave ‘c’ of (ii) is going to push to a new high above 123.72.
Teh choppy action over the last few days traced out a three wave decline,
before the price rallied again today.
The 62% retracement of wave (i) lies at 124.04.
This is the next likely target for wave (ii) to complete.
Tomorrow;
watch for this bearish signal to complete finally in wave (ii).
A sharp turn down off wave (ii) will signal that wave (iii) has begun.
[/vc_column_text][/vc_column][/vc_row]
[/_s2If]
[_s2If current_user_can(access_s2member_ccap_silver)]
[vc_row][vc_column][vc_separator border_width=”5″][/vc_column][/vc_row][vc_row][vc_column][vc_column_text]
SILVER
[/vc_column_text][/vc_column][/vc_row][vc_row][vc_column][vc_separator border_width=”5″][/vc_column][/vc_row][vc_row][vc_column width=”2/3″][vc_custom_heading text=”1 hr” use_theme_fonts=”yes”][vc_column_text]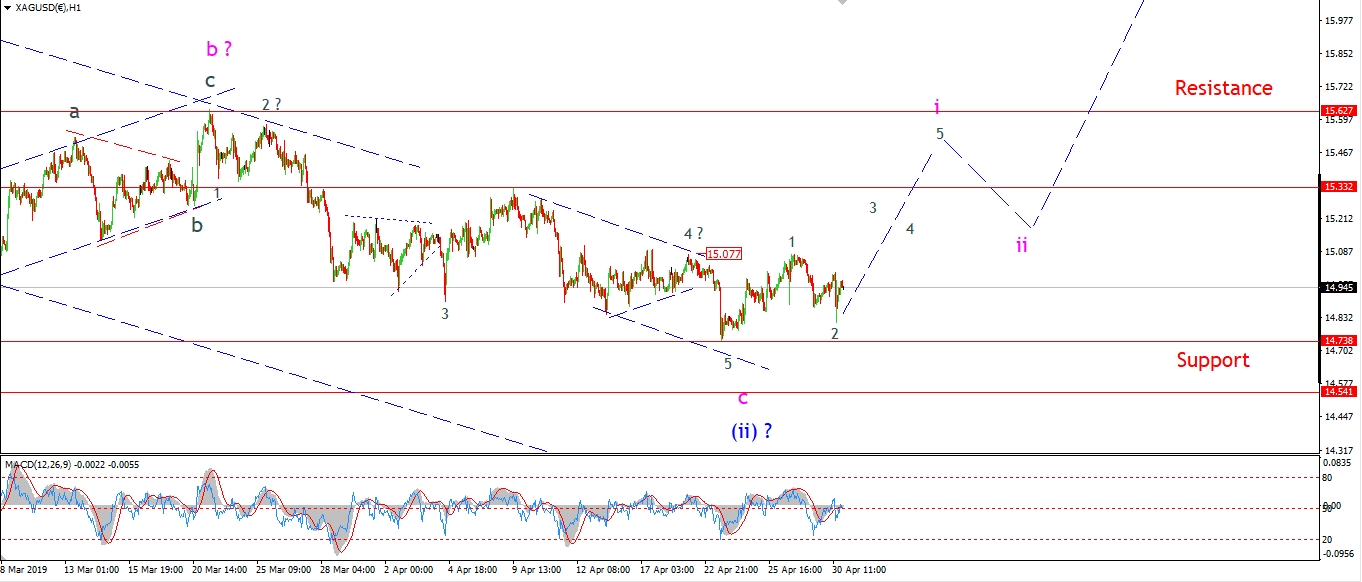 [/vc_column_text][/vc_column][vc_column width=”1/3″][vc_custom_heading text=”4 Hours” use_theme_fonts=”yes”][vc_column_text]
 [/vc_column_text][vc_custom_heading text=”Daily” use_theme_fonts=”yes”][vc_column_text]
 [/vc_column_text][/vc_column][/vc_row]
[vc_row][vc_column][vc_column_text]
Silver is hanging on by a thread to the bullish structure this evening.
Wave ‘2’ black has declined into todays lows in a three wave form.
Although we came very close to a break of support at the lows.
The price has rallied again this evening.
But we now need to see a sharp move higher and a break of 15.00 again to confirm wave ‘3’ of ‘i’ is on.
Tomorrow;
Watch for 14.74 to hold again.
Wave ‘3’ must push higher tomorrow to stay with the bullish short term pattern.
[/vc_column_text][/vc_column][/vc_row]
[/_s2If]
[_s2If current_user_can(access_s2member_ccap_sp500)]
[vc_row][vc_column][vc_separator border_width=”5″][/vc_column][/vc_row][vc_row][vc_column][vc_column_text]
S&P 500.
[/vc_column_text][/vc_column][/vc_row][vc_row][vc_column][vc_separator border_width=”5″][/vc_column][/vc_row][vc_row][vc_column width=”2/3″][vc_custom_heading text=”1 hr” use_theme_fonts=”yes”][vc_column_text]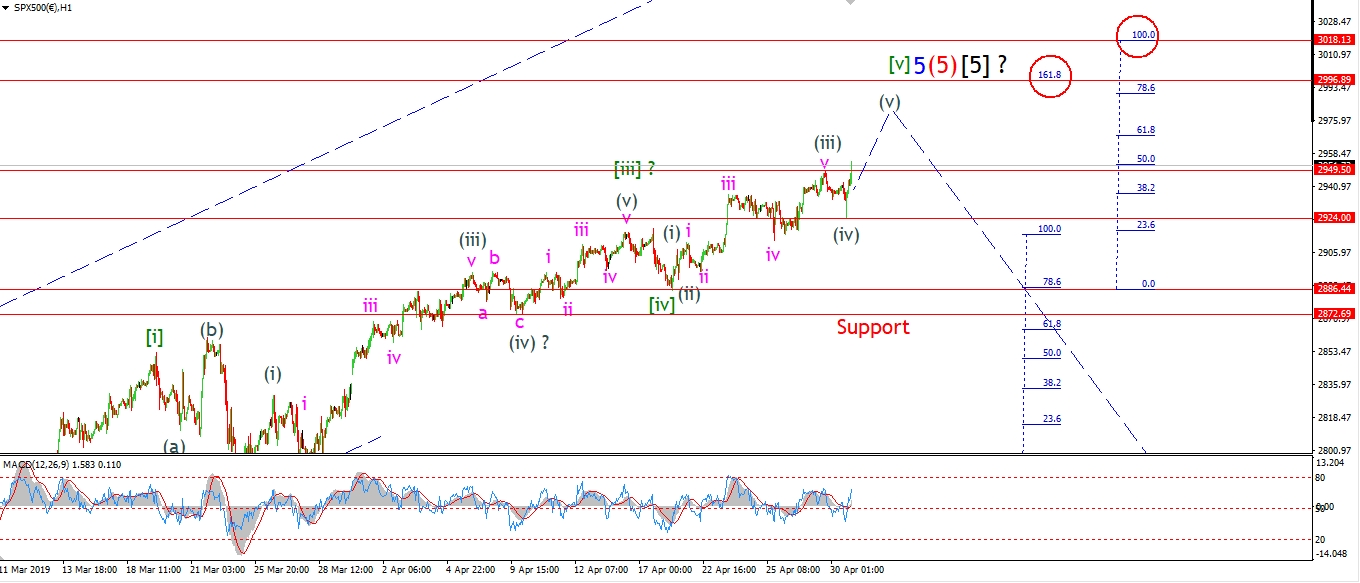 [/vc_column_text][/vc_column][vc_column width=”1/3″][vc_custom_heading text=”4 Hours” use_theme_fonts=”yes”][vc_column_text]
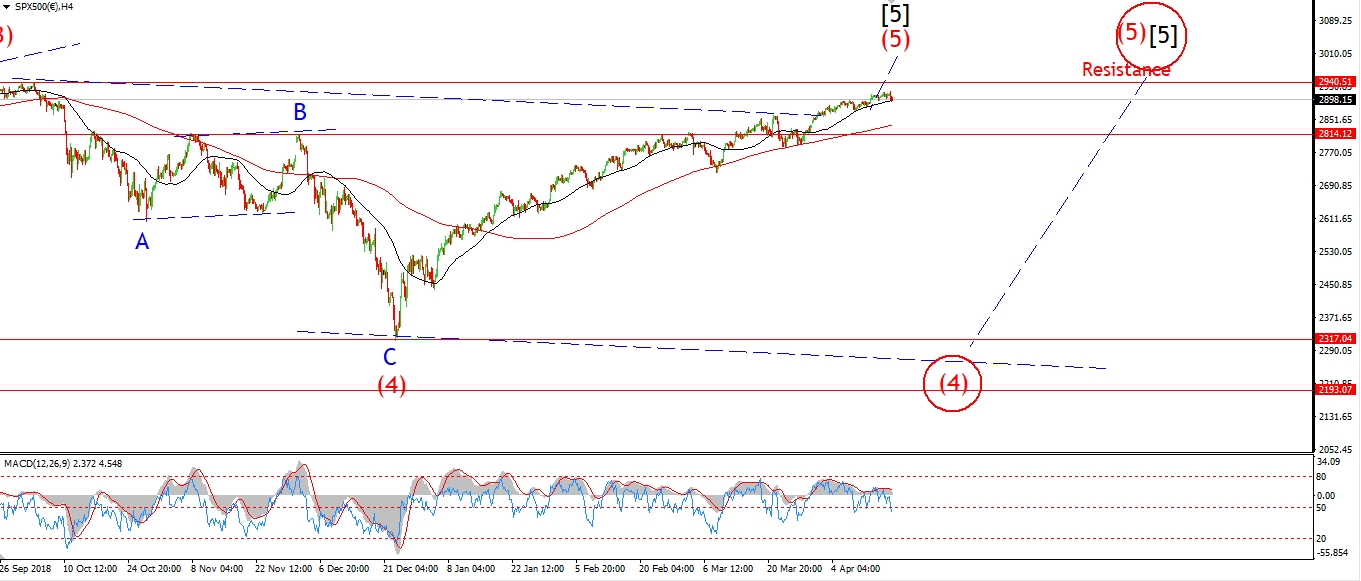 [/vc_column_text][vc_custom_heading text=”Daily” use_theme_fonts=”yes”][vc_column_text]
 [/vc_column_text][/vc_column][/vc_row]
[vc_row][vc_column][vc_column_text]
The choppy pattern that has developed in the S&P over the last few sessions
lends itself to a series of fourth wave corrections.
This is now shown on the short term chart as wave ‘iv’ of (iii) on last Thursdays low.
And then todays low at wave (iv) of [v].
The market is rallying again this evening and this should begin wave (v) of [v].
And this rally in wave [v] may well be the last rally for a while.
Tomorrow;
Wave (v) is likely to trace out a five wave structure itself over the coming days.
the Fibonacci target at 2996 is still possible.
Watch for 2924 to hold and a push back up towards the 2996 level to complete wave [v] green.
[/vc_column_text][/vc_column][/vc_row]
[/_s2If]
[vc_row][vc_column][vc_column_text]
[/vc_column_text][/vc_column][/vc_row]
[vc_row][vc_column][vc_separator border_width=”5″][/vc_column][/vc_row]