
[vc_row][vc_column][vc_separator border_width=”5″][/vc_column][/vc_row]
[vc_row][vc_column][vc_column_text]
Good evening folks.
[/vc_column_text][/vc_column][/vc_row]
[_s2If current_user_can(access_s2member_ccap_eurusd)]
[vc_row][vc_column][vc_separator border_width=”5″][/vc_column][/vc_row]
[vc_row][vc_column][vc_column_text]
EURUSD
[/vc_column_text][/vc_column][/vc_row]
[vc_row][vc_column][vc_separator border_width=”5″][/vc_column][/vc_row][vc_row][vc_column width=”2/3″][vc_custom_heading text=”1 hr” use_theme_fonts=”yes”][vc_column_text]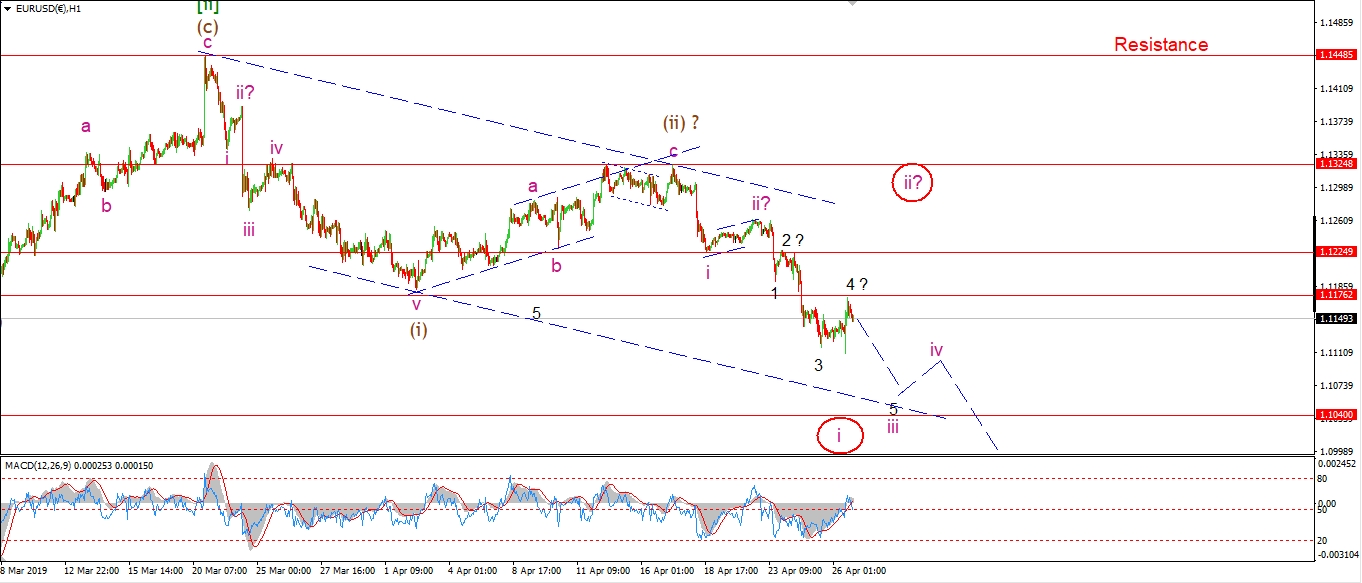 [/vc_column_text][/vc_column][vc_column width=”1/3″][vc_custom_heading text=”4 Hours” use_theme_fonts=”yes”][vc_column_text]
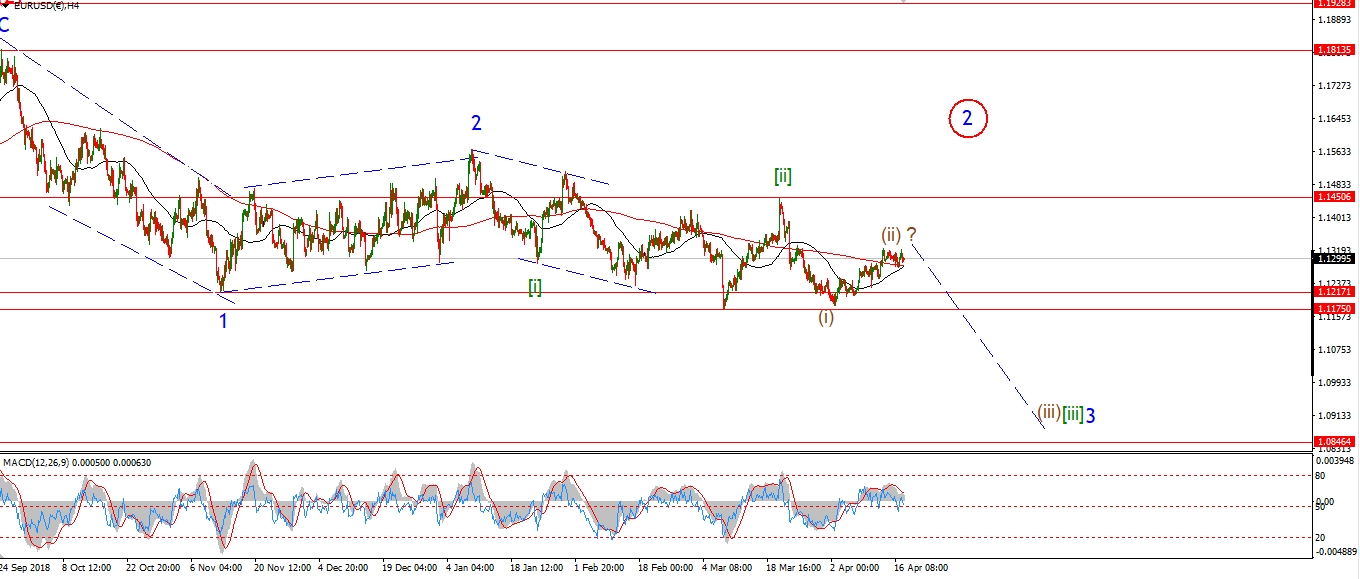 [/vc_column_text][vc_custom_heading text=”Daily” use_theme_fonts=”yes”][vc_column_text]
 [/vc_column_text][/vc_column][/vc_row]
[vc_row][vc_column][vc_column_text]
I am looking at the alternate count in EURUSD with interest this evening.
Todays small rally is viewed as wave ‘4’ of ‘iii’,
but this can also be viewed as wave ‘4’ of ‘i’ if the alternate count is used.
Both wave counts are signalling a decline is underway in a large degree third wave.
only the alternate count will allow for a retracement higher in wave ‘ii’ early next week, before going lower in wave (iii) proper.
Monday;
Watch for wave ‘iii’ to continue lower to the lower trend channel line.
Any correction higher must hold below 1.1200.
[/vc_column_text][/vc_column][/vc_row]
[/_s2If]
[_s2If current_user_can(access_s2member_ccap_gbpusd)]
[vc_row][vc_column][vc_separator border_width=”5″][/vc_column][/vc_row][vc_row][vc_column][vc_column_text]
GBPUSD
[/vc_column_text][/vc_column][/vc_row][vc_row][vc_column][vc_separator border_width=”5″][/vc_column][/vc_row][vc_row][vc_column width=”2/3″][vc_custom_heading text=”1 hr” use_theme_fonts=”yes”][vc_column_text]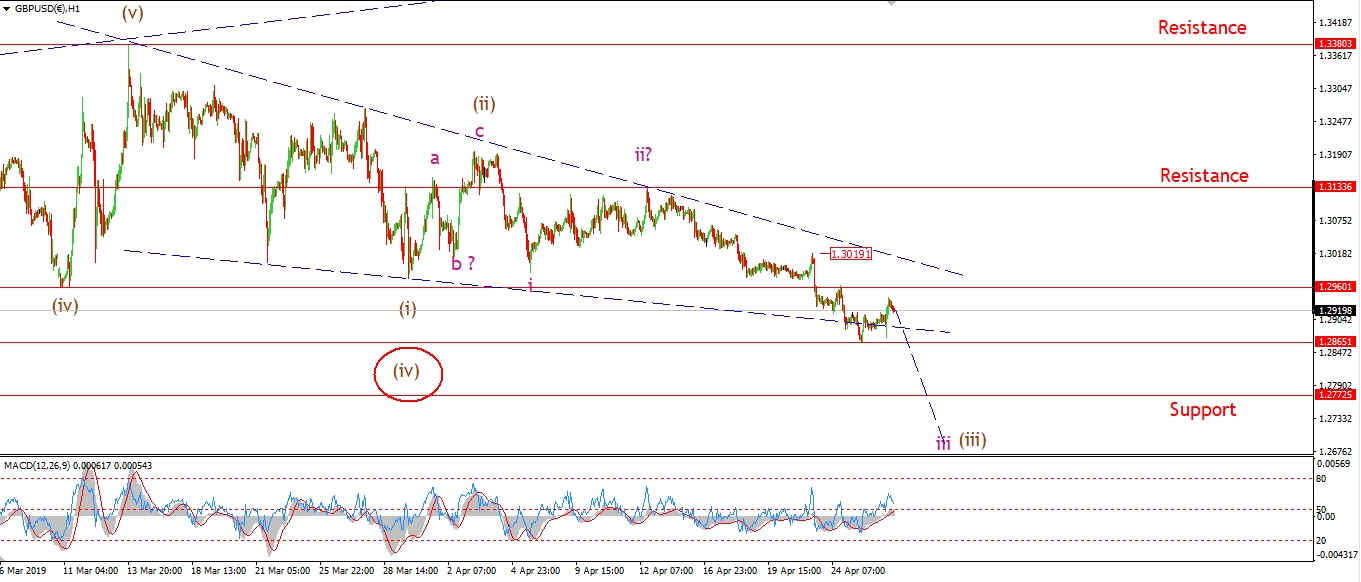 [/vc_column_text][/vc_column][vc_column width=”1/3″][vc_custom_heading text=”4 Hours” use_theme_fonts=”yes”][vc_column_text]
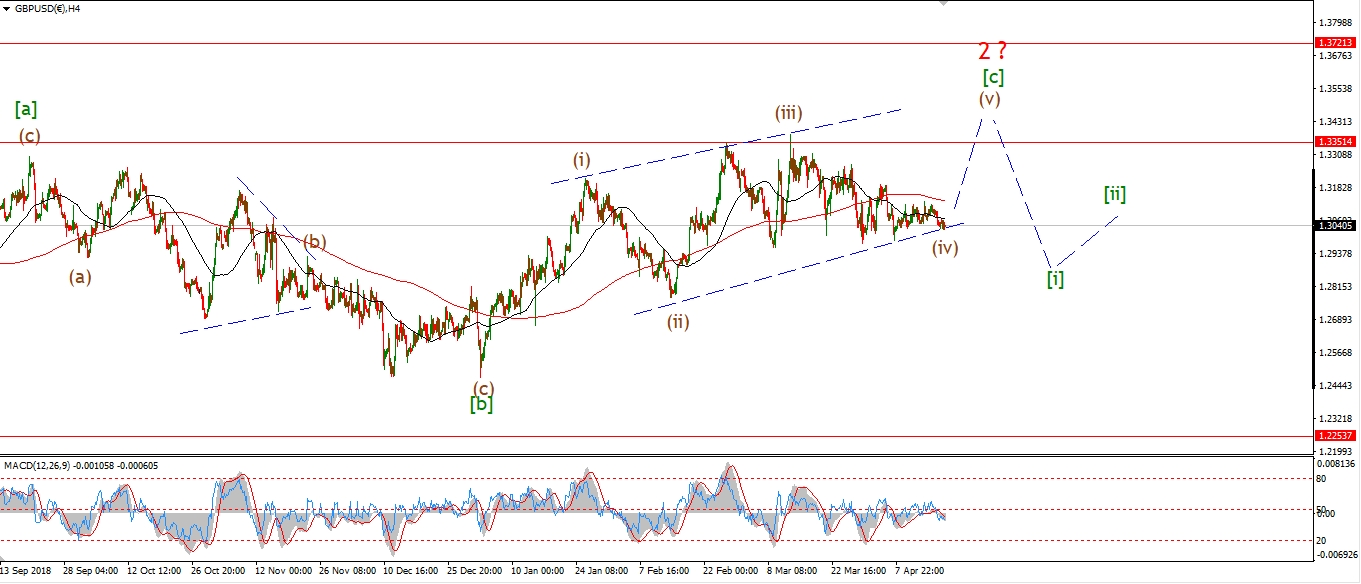 [/vc_column_text][vc_custom_heading text=”Daily” use_theme_fonts=”yes”][vc_column_text]
 [/vc_column_text][/vc_column][/vc_row]
[vc_row][vc_column][vc_column_text]
The general downward grind is still in force in cable today.
the slight rise off the recent low at 1.2865 is in three waves again,
so this low should be taken out again on Monday.
A break of 1.2865 should begin a larger impulsive move lower in wave (iii).
The market must begin to make some ground to the downside now.
Monday;
1.3019 should continue to form resistance.
Watch for a break of 1.2865.
[/vc_column_text][/vc_column][/vc_row]
[/_s2If]
[_s2If current_user_can(access_s2member_ccap_usdjpy)]
[vc_row][vc_column][vc_separator border_width=”5″][/vc_column][/vc_row][vc_row][vc_column][vc_column_text]
USDJPY
[/vc_column_text][/vc_column][/vc_row][vc_row][vc_column][vc_separator border_width=”5″][/vc_column][/vc_row][vc_row][vc_column width=”2/3″][vc_custom_heading text=”1 hr” use_theme_fonts=”yes”][vc_column_text]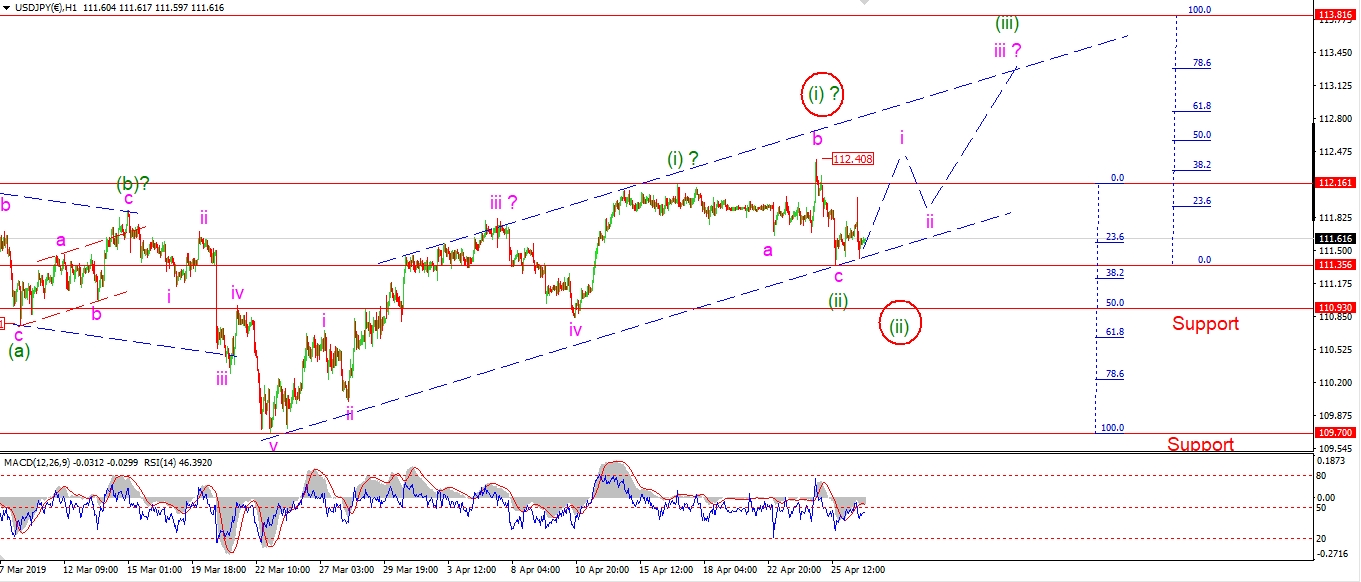 [/vc_column_text][/vc_column][vc_column width=”1/3″][vc_custom_heading text=”4 Hours” use_theme_fonts=”yes”][vc_column_text]
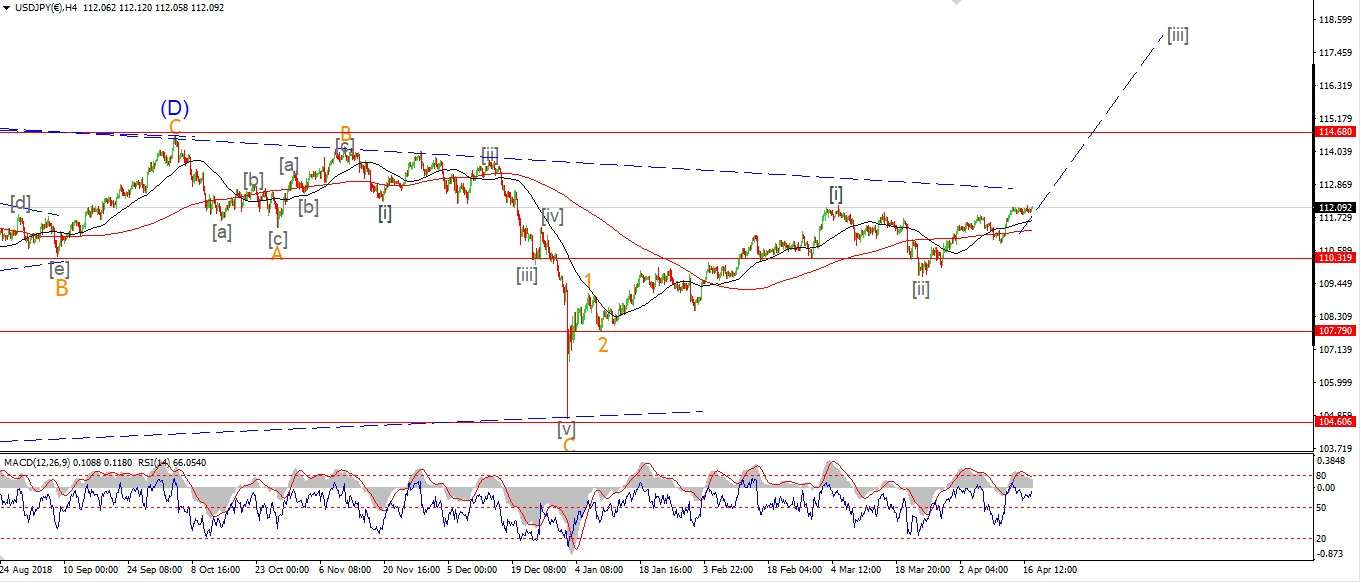 [/vc_column_text][vc_custom_heading text=”Daily” use_theme_fonts=”yes”][vc_column_text]
 [/vc_column_text][/vc_column][/vc_row]
[vc_row][vc_column][vc_column_text]
I have shown a possible alternate view on the recent spike lower this week.
It may be part of a larger zigzag wave (ii).
If so,
wave (ii) will likely bottom at 110.93 at the 50% retracement level.
For the moment,
the expanded flat idea for wave (ii) still holds.
So we could still see an early rally in wave (iii) next week.
Monday;
Watch for wave (ii) to clear up.
If the price rallies from here and breaks 112.40 again,
then wave (iii) will be confirmed.
[/vc_column_text][/vc_column][/vc_row]
[/_s2If]
[_s2If current_user_can(access_s2member_ccap_dow_jones)]
[vc_row][vc_column][vc_separator border_width=”5″][/vc_column][/vc_row][vc_row][vc_column][vc_column_text]
DOW JONES INDUSTRIALS
[/vc_column_text][/vc_column][/vc_row][vc_row][vc_column][vc_separator border_width=”5″][/vc_column][/vc_row][vc_row][vc_column width=”2/3″][vc_custom_heading text=”1 hr” use_theme_fonts=”yes”][vc_column_text]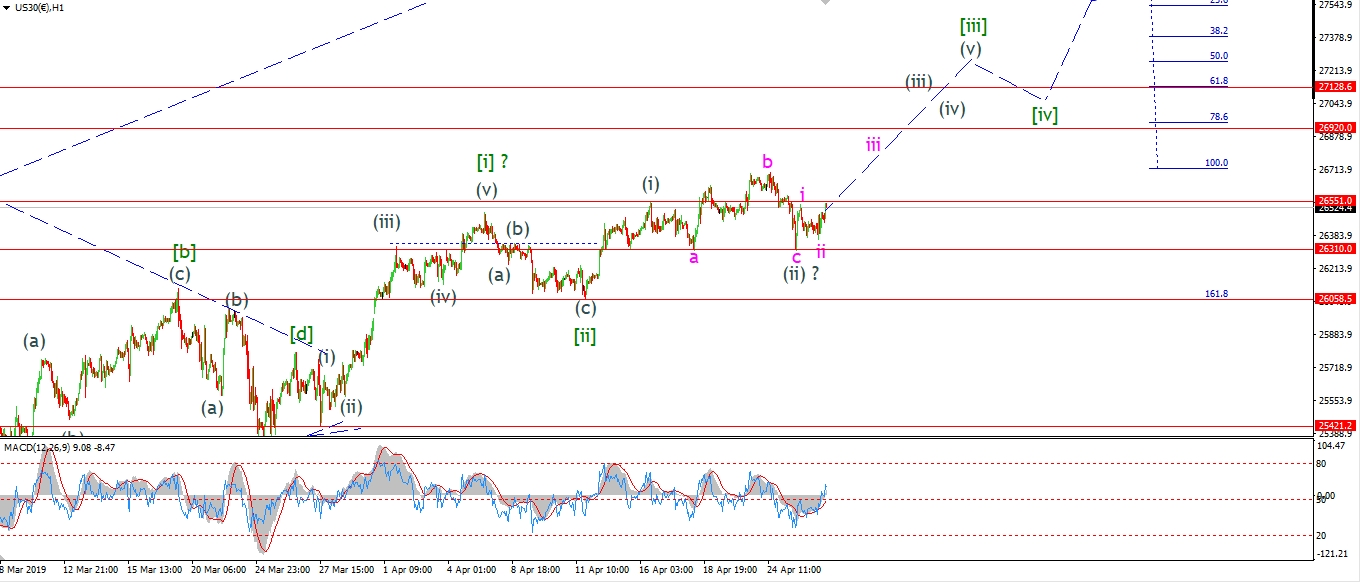 [/vc_column_text][/vc_column][vc_column width=”1/3″][vc_custom_heading text=”4 Hours” use_theme_fonts=”yes”][vc_column_text]
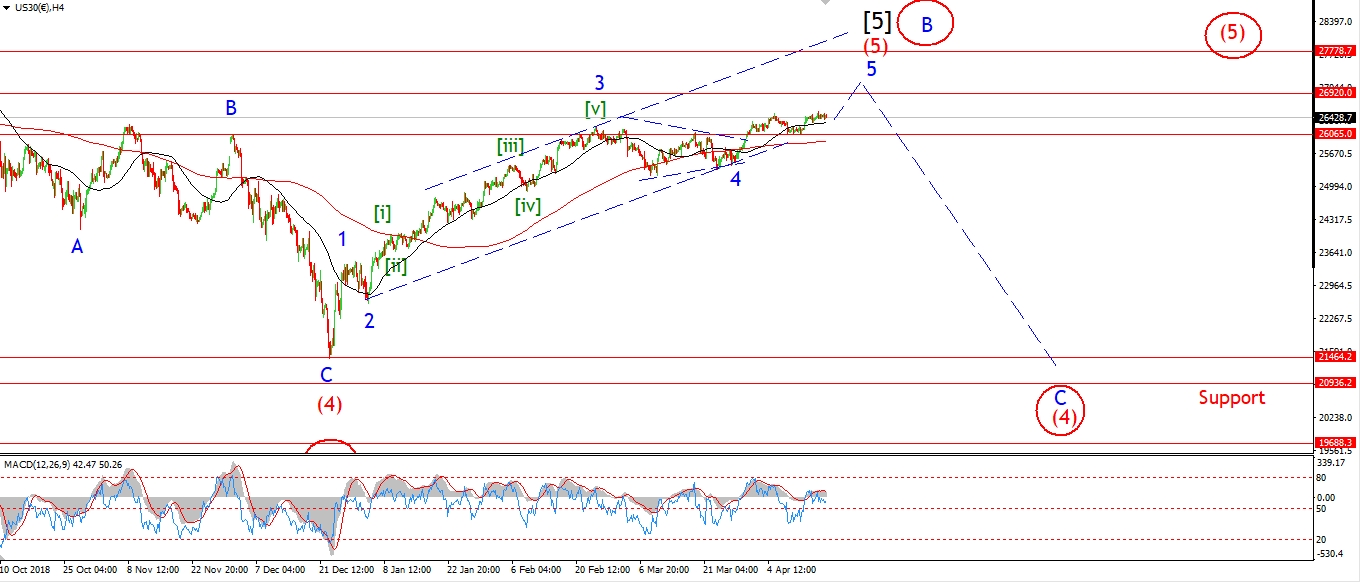 [/vc_column_text][vc_custom_heading text=”Daily” use_theme_fonts=”yes”][vc_column_text]
 [/vc_column_text][/vc_column][/vc_row]
[vc_row][vc_column][vc_column_text]
The DOW is regaining the losses today as part of the early satge of wave (iii).
Ideally the market should continue higher for the next few weeks,
to finish out a five wave rally in wave ‘5’ blue.
The target area for wave ‘5’ lies at about 27500.
I went through the Fibonacci projections on the video earlier this evening,
so you can check that out.
The price must hold above 26310 at wave (ii) for the current short term count to remain valid.
Monday;
Watch for a rally in wave ‘iii’ of (iii) of [iii] over the course of the next week.
This should carry us to a new all time high.
[/vc_column_text][/vc_column][/vc_row]
[/_s2If]
[_s2If current_user_can(access_s2member_ccap_gold)]
[vc_row][vc_column][vc_separator border_width=”5″][/vc_column][/vc_row][vc_row][vc_column][vc_column_text]
GOLD
[/vc_column_text][/vc_column][/vc_row][vc_row][vc_column][vc_separator border_width=”5″][/vc_column][/vc_row][vc_row][vc_column width=”2/3″][vc_custom_heading text=”1 hr” use_theme_fonts=”yes”][vc_column_text]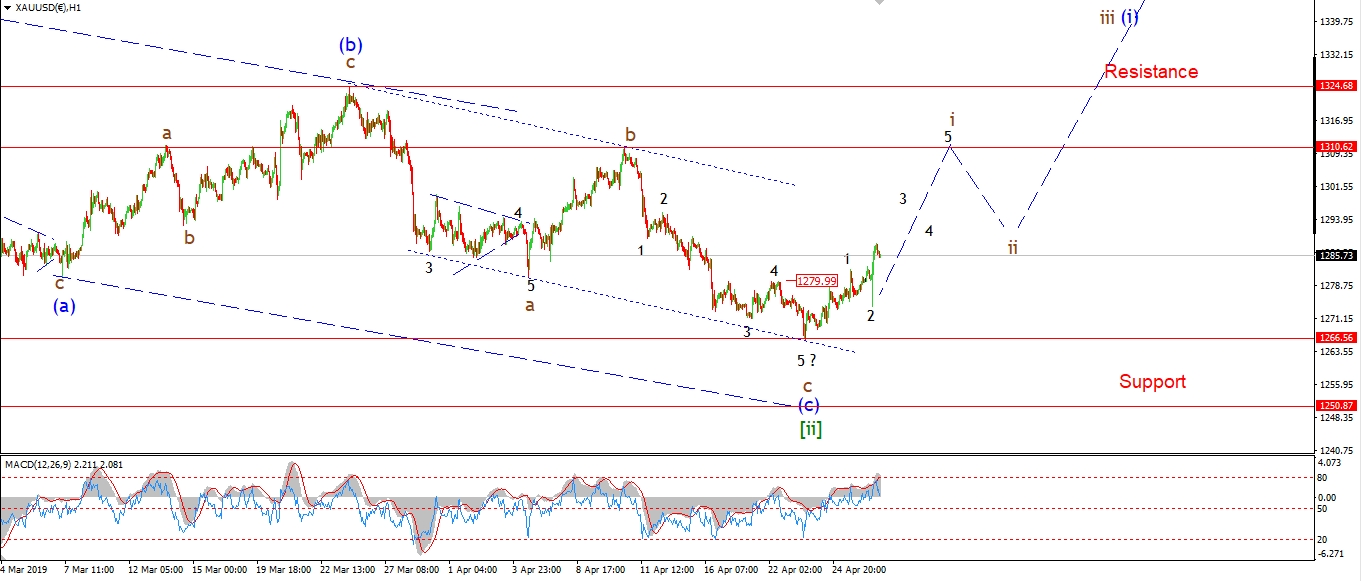 [/vc_column_text][/vc_column][vc_column width=”1/3″][vc_custom_heading text=”4 Hours” use_theme_fonts=”yes”][vc_column_text]
 [/vc_column_text][vc_custom_heading text=”Daily” use_theme_fonts=”yes”][vc_column_text]
 [/vc_column_text][/vc_column][/vc_row]
[vc_row][vc_column][vc_column_text]
Gold spiked higher today which is in line with the idea that we are putting in a bottom now at wave [ii].
We still need a five wave move higher off the 1266 low to confirm the turn.
That should occur next week.
A break of 1310 will be a big vote in favor of the bullish count.
And will signal that wave [ii] is in.
Then a rally should begin in wave [iii].
Tomorrow;
Watch for wave ‘i’ to continue higher early next week with an eye on 1310.
[/vc_column_text][/vc_column][/vc_row]
[/_s2If]
[_s2If current_user_can(access_s2member_ccap_crude)]
[vc_row][vc_column][vc_separator border_width=”5″][/vc_column][/vc_row][vc_row][vc_column][vc_column_text]
U.S CRUDE OIL
[/vc_column_text][/vc_column][/vc_row][vc_row][vc_column][vc_separator border_width=”5″][/vc_column][/vc_row][vc_row][vc_column width=”2/3″][vc_custom_heading text=”1 hr” use_theme_fonts=”yes”][vc_column_text] [/vc_column_text][/vc_column][vc_column width=”1/3″][vc_custom_heading text=”4 Hours” use_theme_fonts=”yes”][vc_column_text]
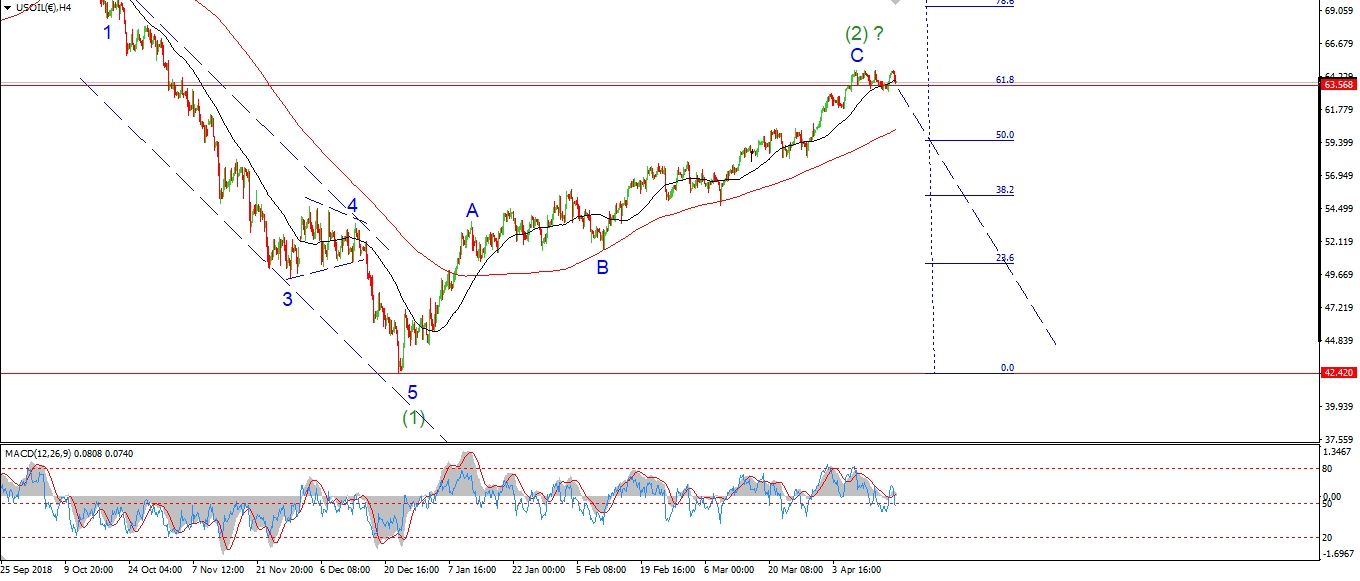 [/vc_column_text][vc_custom_heading text=”Daily” use_theme_fonts=”yes”][vc_column_text]
 [/vc_column_text][/vc_column][/vc_row]
[vc_row][vc_column][vc_column_text]
Crude oil took a nose dive today to signal that the final high is in for wave ‘C’ and wave (2).
The price has broken initial support level at 63.00.
This is a good start to creating a bearish signal off the high next week.
I want to see five waves down in wave (i),
followed by a corrective lower high in wave (ii).
If we get this signal,
that should confirm that wave (3) down has begun.
And the bearish potential for wave (3) is significant.
With the minimum target for wave (3) at 31.00,
this is where wave (1) and (3) reach equality.
Monday;
Lets see if we get a clear bearish impulse wave next week to set us up for a decline in wave ‘1’ of (3).
[/vc_column_text][/vc_column][/vc_row]
[/_s2If]
[_s2If current_user_can(access_s2member_ccap_us10yr)]
[vc_row][vc_column][vc_separator border_width=”5″][/vc_column][/vc_row][vc_row][vc_column][vc_column_text]
US 10 yr Treasuries.
[/vc_column_text][/vc_column][/vc_row][vc_row][vc_column][vc_separator border_width=”5″][/vc_column][/vc_row][vc_row][vc_column width=”2/3″][vc_custom_heading text=”1 hr” use_theme_fonts=”yes”][vc_column_text]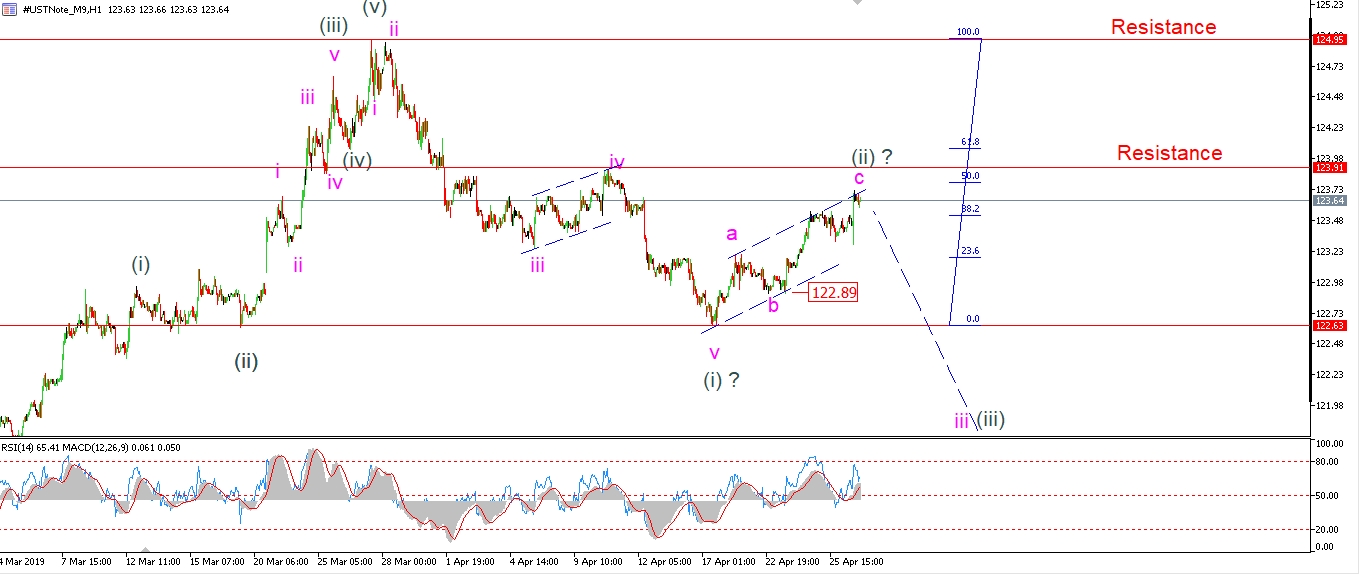 [/vc_column_text][/vc_column][vc_column width=”1/3″][vc_custom_heading text=”4 Hours” use_theme_fonts=”yes”][vc_column_text]
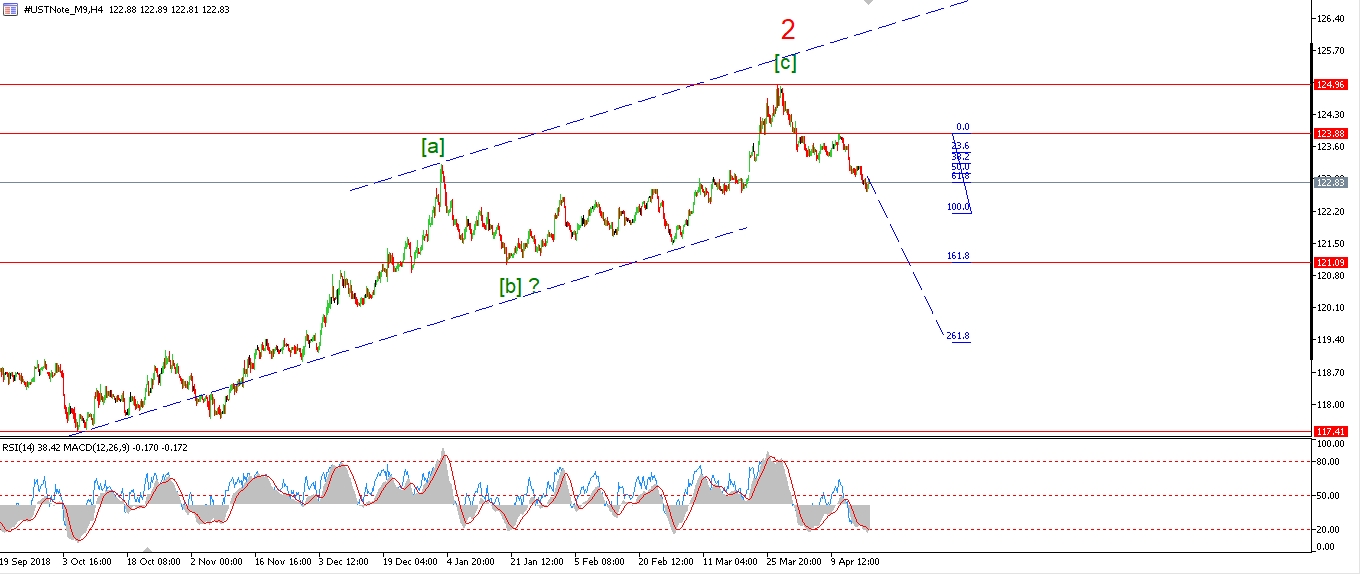 [/vc_column_text][vc_custom_heading text=”Daily” use_theme_fonts=”yes”][vc_column_text]
 [/vc_column_text][/vc_column][/vc_row]
[vc_row][vc_column][vc_column_text]
I have switched to the alternate count in the 10YR this evening.
The rally today seems to fit a larger three wave correction in wave (ii).
The price is pushing the highs of the previous wave ‘iv’ now,
and todays high topped just below the 50% retracement level of the whole decline in wave (i).
So the odds are that wave (i) and (ii) are now complete,
With the expected decline into wave (iii) just days away.
Monday;
Watch for wave ‘i’ of (iii) to begin with a break of 122.89.
[/vc_column_text][/vc_column][/vc_row]
[/_s2If]
[_s2If current_user_can(access_s2member_ccap_silver)]
[vc_row][vc_column][vc_separator border_width=”5″][/vc_column][/vc_row][vc_row][vc_column][vc_column_text]
SILVER
[/vc_column_text][/vc_column][/vc_row][vc_row][vc_column][vc_separator border_width=”5″][/vc_column][/vc_row][vc_row][vc_column width=”2/3″][vc_custom_heading text=”1 hr” use_theme_fonts=”yes”][vc_column_text]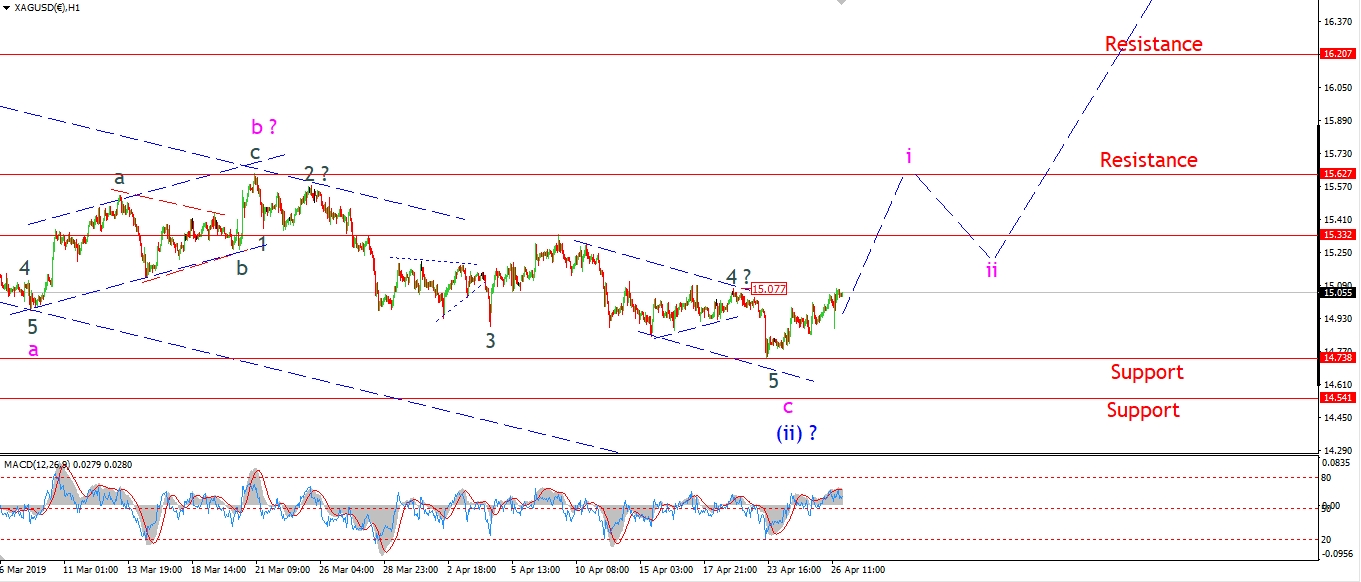 [/vc_column_text][/vc_column][vc_column width=”1/3″][vc_custom_heading text=”4 Hours” use_theme_fonts=”yes”][vc_column_text]
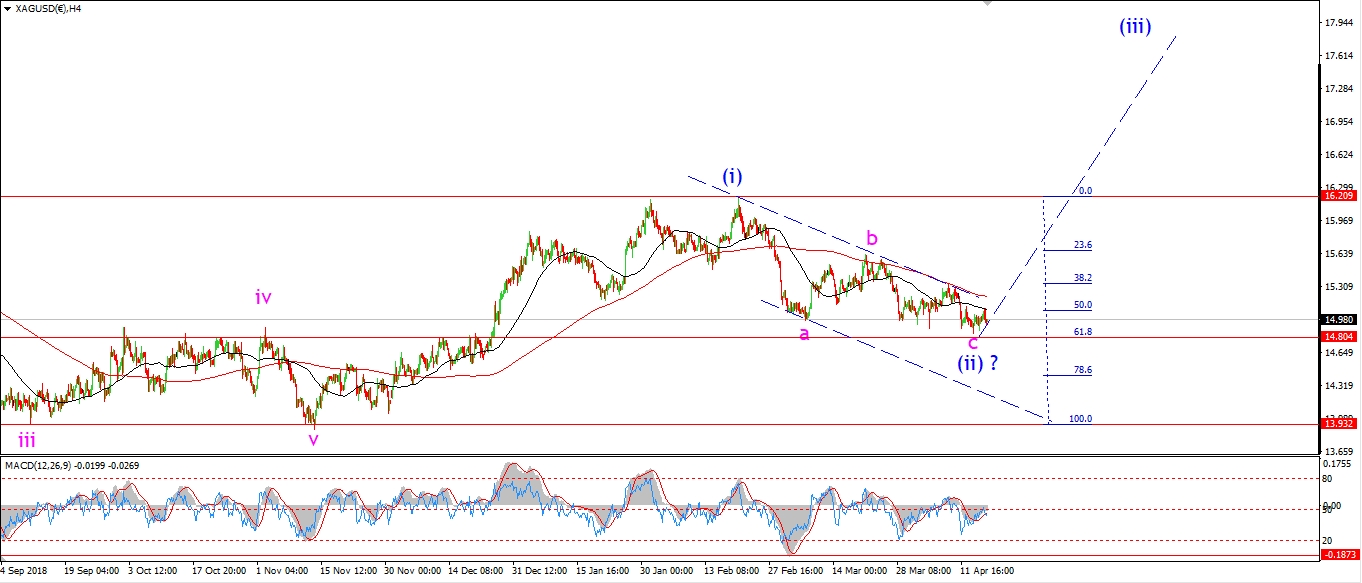 [/vc_column_text][vc_custom_heading text=”Daily” use_theme_fonts=”yes”][vc_column_text]
 [/vc_column_text][/vc_column][/vc_row]
[vc_row][vc_column][vc_column_text]
Silver is up again today which supports the idea of a low in place.
Although the pattern has not developed impulsively just yet.
The price is closing above 15.00 again,
so wave ‘i’ is taking out the previous fourth wave now.
The next significant resistance level lies at 15.62,
The high of wave ‘b’.
If that level breaks after a five wave rally next week,
we can confirm the turn is in.
Monday,
watch for wave ‘i’ to continue higher a take out 15.33 to start.
[/vc_column_text][/vc_column][/vc_row]
[/_s2If]
[_s2If current_user_can(access_s2member_ccap_sp500)]
[vc_row][vc_column][vc_separator border_width=”5″][/vc_column][/vc_row][vc_row][vc_column][vc_column_text]
S&P 500.
[/vc_column_text][/vc_column][/vc_row][vc_row][vc_column][vc_separator border_width=”5″][/vc_column][/vc_row][vc_row][vc_column width=”2/3″][vc_custom_heading text=”1 hr” use_theme_fonts=”yes”][vc_column_text]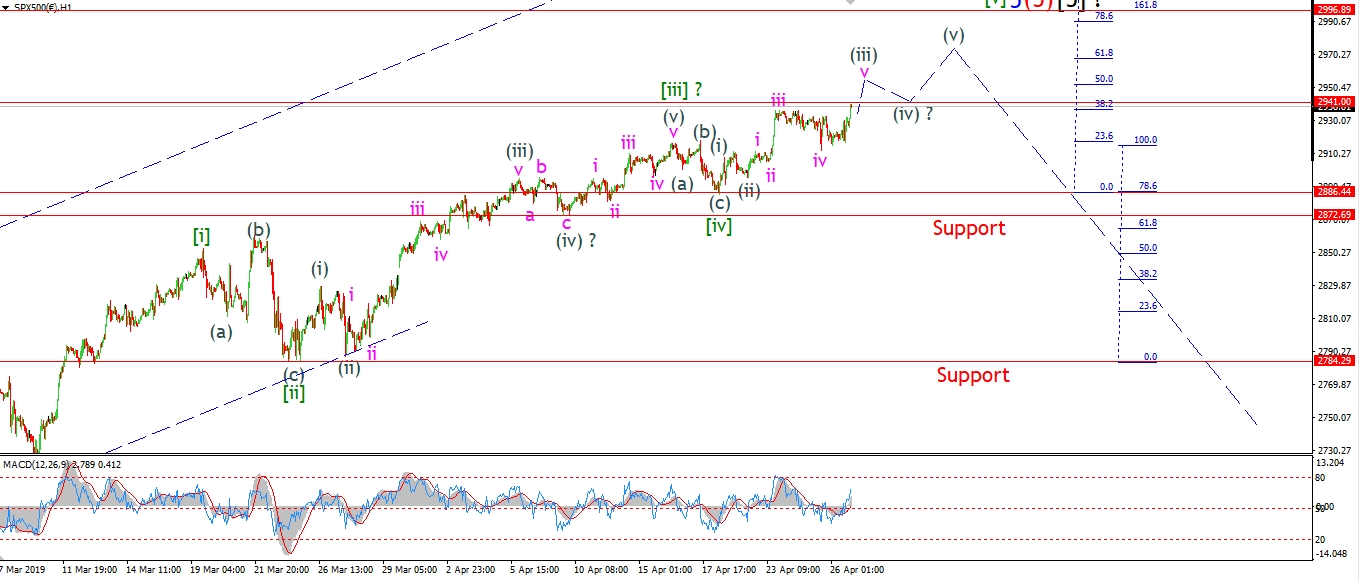 [/vc_column_text][/vc_column][vc_column width=”1/3″][vc_custom_heading text=”4 Hours” use_theme_fonts=”yes”][vc_column_text]
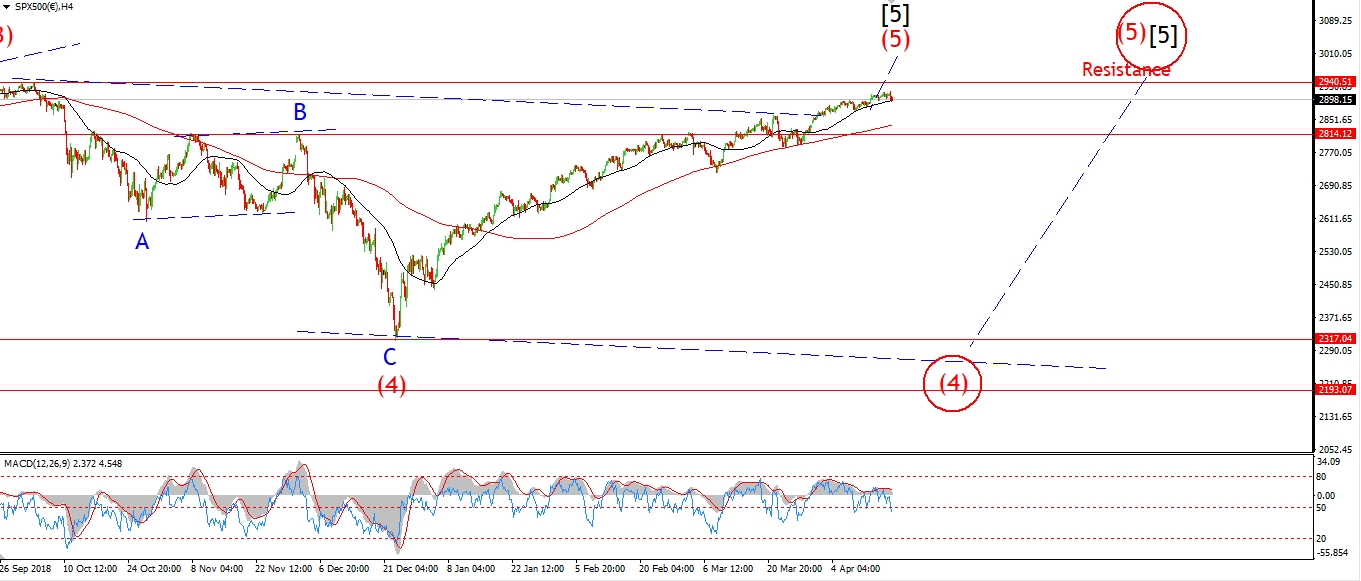 [/vc_column_text][vc_custom_heading text=”Daily” use_theme_fonts=”yes”][vc_column_text]
 [/vc_column_text][/vc_column][/vc_row]
[vc_row][vc_column][vc_column_text]
We are heading to the close now and the S&P is just 6 points off that all time high.
2941 should be broken early next week,
and that should bring us within a few weeks at most
of the final top in this 10 year long bull market in wave (5) red.
The initial target for wave (5) lies at 2996.
This is where wave [v] reaches the 162% extension line shown on the short term chart.
So this is the outlook for the next week.
Monday;
watch for wave (iii) of [v] to carry us to a new all time high and close to the next major turning point.
[/vc_column_text][/vc_column][/vc_row]
[/_s2If]
[vc_row][vc_column][vc_column_text]
That about wraps up the week here.
Have a great weekend everyone.
God’s speed,
See you Monday evening again.
[/vc_column_text][/vc_column][/vc_row]
[vc_row][vc_column][vc_separator border_width=”5″][/vc_column][/vc_row]