
[vc_row][vc_column][vc_separator border_width=”5″][/vc_column][/vc_row]
[vc_row][vc_column][vc_column_text]
“This is the end, Beautiful friend
This is the end, My only friend, The end.
Jim Morrison sang that song in 1966, interesting timing that!
The idea that there is a huge rally ahead of us now is absurd to me!
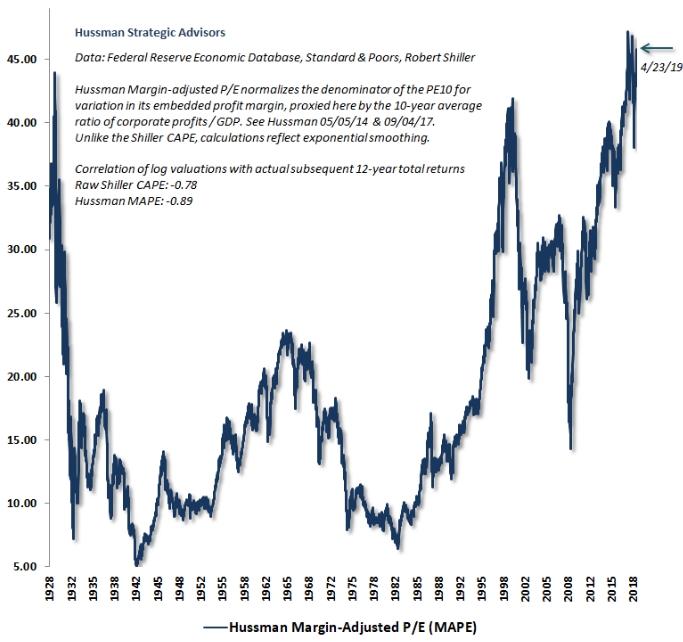
Stock valuations as measured by John Hussmans margin adjusted PE,
are now well above 2007, 2000, 1987, 1966,
and of course we have pipped above 1929 also in this rolling top formation over the last year.
The market is sitting at 45 times earnings now.
You are not paying for a revenue stream of cash flows when buying a stock at these valuations.
No one could live long enough now to make the average dividend yield worth paying for now!
If you are looking for a quick way to destroy your wealth,
buy stocks……
by the way,
Significant lows occur in the region of between 5 and 15 times earnings.
Look out below.
[/vc_column_text][/vc_column][/vc_row]
[_s2If current_user_can(access_s2member_ccap_eurusd)]
[vc_row][vc_column][vc_separator border_width=”5”][/vc_column][/vc_row]
[vc_row][vc_column][vc_column_text]
EURUSD
[/vc_column_text][/vc_column][/vc_row]
[vc_row][vc_column][vc_separator border_width=”5″][/vc_column][/vc_row][vc_row][vc_column width=”2/3″][vc_custom_heading text=”1 hr” use_theme_fonts=”yes”][vc_column_text]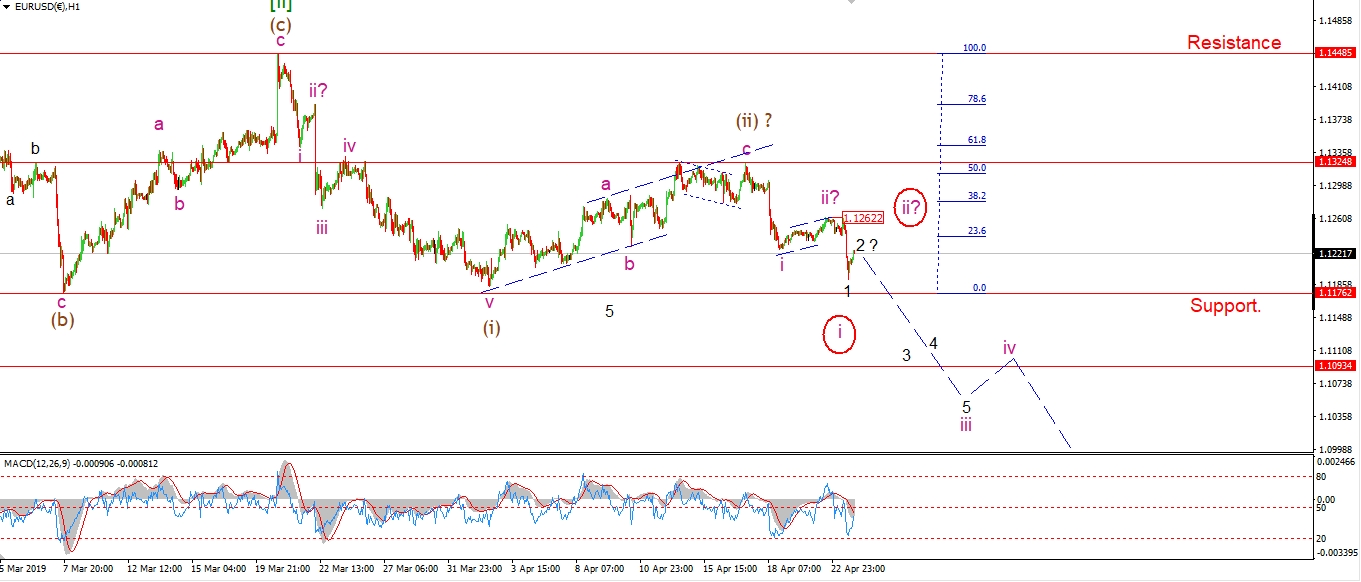 [/vc_column_text][/vc_column][vc_column width=”1/3″][vc_custom_heading text=”4 Hours” use_theme_fonts=”yes”][vc_column_text]
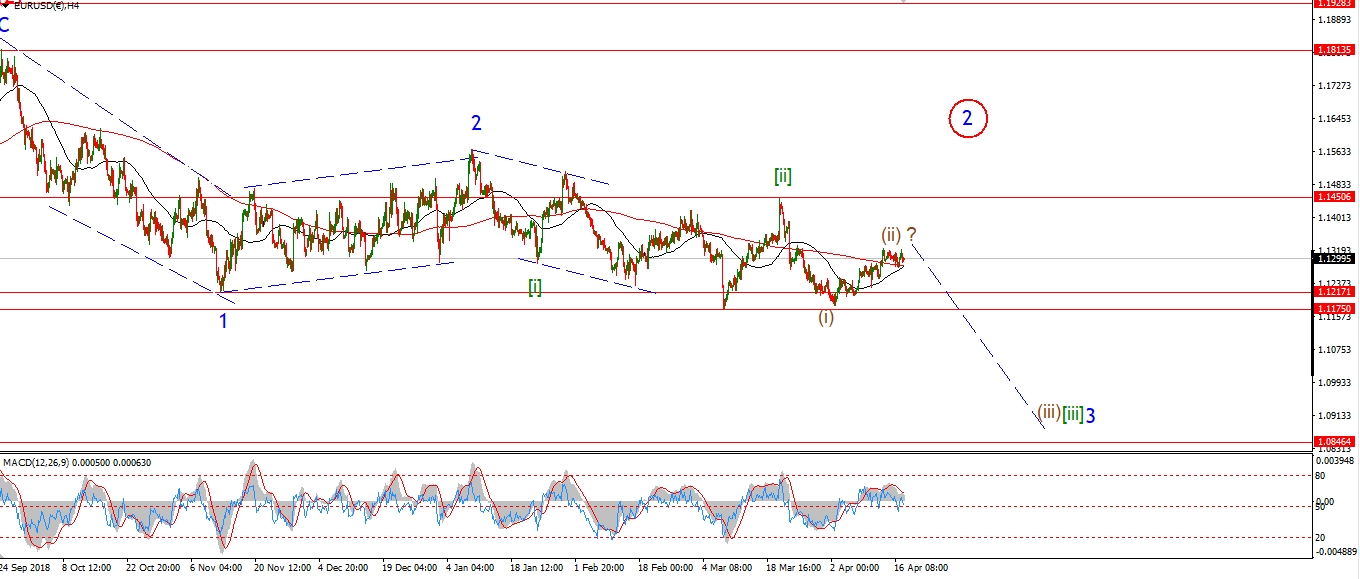 [/vc_column_text][vc_custom_heading text=”Daily” use_theme_fonts=”yes”][vc_column_text]
 [/vc_column_text][/vc_column][/vc_row]
[vc_row][vc_column][vc_column_text]
The sharp spike lower this afternoon in EURUSD has confirmed
the corrective nature of the recent rise.
The price has not yet broken through support at 1.1176,
todays low reached 1.1192,
but the price should break support in wave ‘iii’ down.
It is still hard to know if todays drop is the beginning of wave ‘iii’ as labelled,
or just the end of wave ‘i’ as per the alternate count.
The size of the correction from here will that up.
Tomorrow;
Watch for a possible acceleration lower in wave ‘iii’ of (iii).
Price must hold below 1.1260 from now on.
[/vc_column_text][/vc_column][/vc_row]
[/_s2If]
[_s2If current_user_can(access_s2member_ccap_gbpusd)]
[vc_row][vc_column][vc_separator border_width=”5″][/vc_column][/vc_row][vc_row][vc_column][vc_column_text]
GBPUSD
[/vc_column_text][/vc_column][/vc_row][vc_row][vc_column][vc_separator border_width=”5″][/vc_column][/vc_row][vc_row][vc_column width=”2/3″][vc_custom_heading text=”1 hr” use_theme_fonts=”yes”][vc_column_text]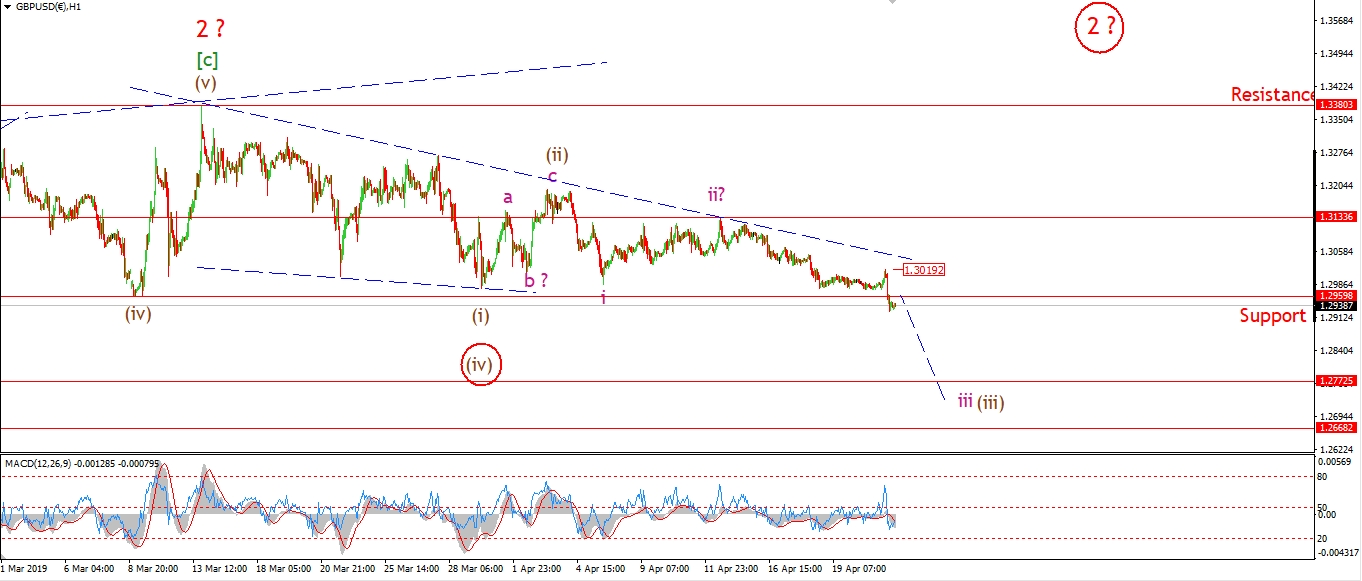 [/vc_column_text][/vc_column][vc_column width=”1/3″][vc_custom_heading text=”4 Hours” use_theme_fonts=”yes”][vc_column_text]
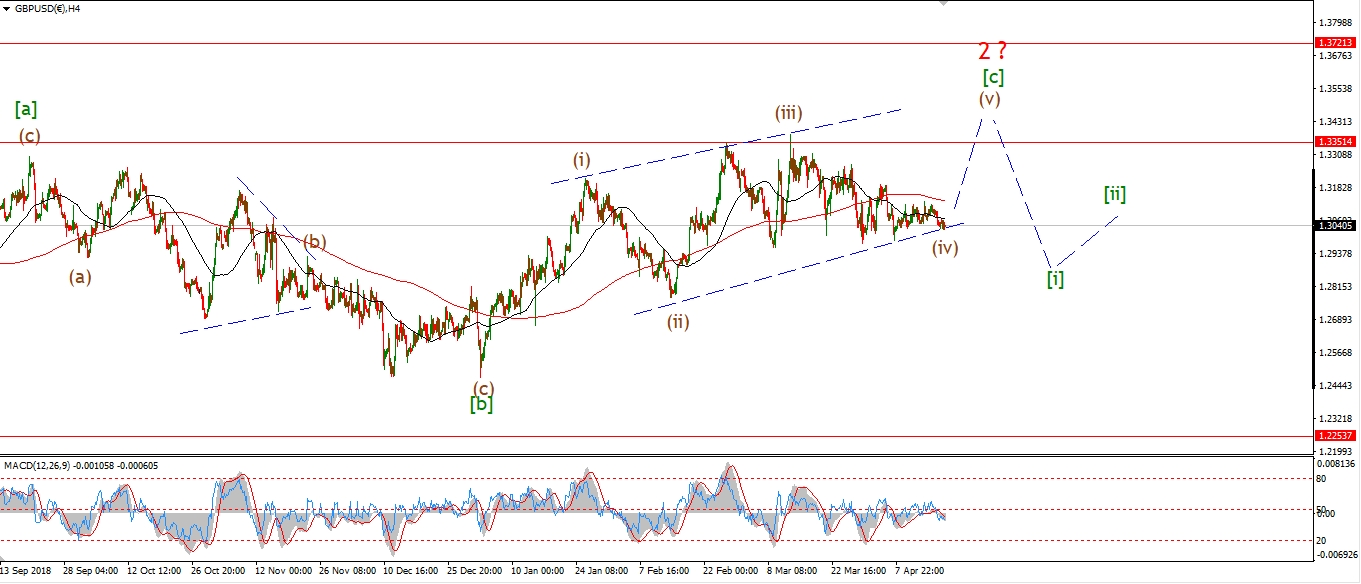 [/vc_column_text][vc_custom_heading text=”Daily” use_theme_fonts=”yes”][vc_column_text]
 [/vc_column_text][/vc_column][/vc_row]
[vc_row][vc_column][vc_column_text]
Cable has again broken short term support today.
The previous wave (iv) at 1.2959 gave way this afternoon,
and the next support below that level lies at 1.2772.
That level marks wave (ii) of the previous rally as seen on the 4hr chart.
One by one support is breaking,
This adds weight to the idea that wave (iii) has begun.
If wave (iii) is now underway,
then we should see an acceleration lower over the coming week.
Tomorrow;
Watch for 1.3019 to hold and wave ‘iii’ of (iii) to progress to the downside.
[/vc_column_text][/vc_column][/vc_row]
[/_s2If]
[_s2If current_user_can(access_s2member_ccap_usdjpy)]
[vc_row][vc_column][vc_separator border_width=”5″][/vc_column][/vc_row][vc_row][vc_column][vc_column_text]
USDJPY
[/vc_column_text][/vc_column][/vc_row][vc_row][vc_column][vc_separator border_width=”5″][/vc_column][/vc_row][vc_row][vc_column width=”2/3″][vc_custom_heading text=”1 hr” use_theme_fonts=”yes”][vc_column_text]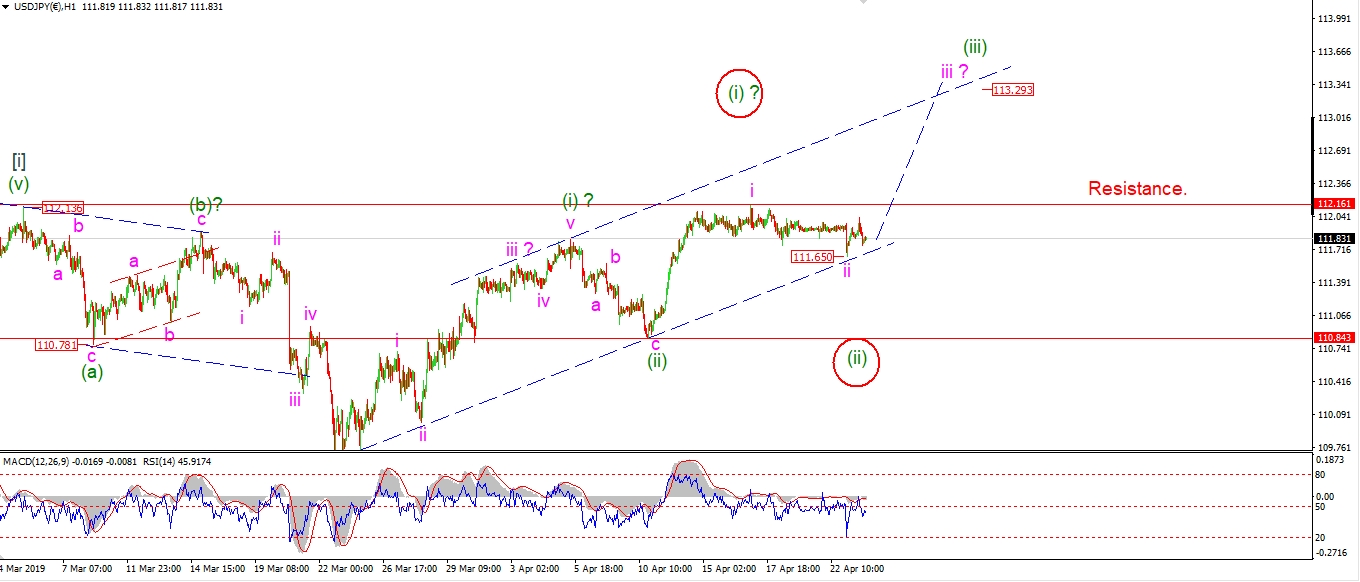 [/vc_column_text][/vc_column][vc_column width=”1/3″][vc_custom_heading text=”4 Hours” use_theme_fonts=”yes”][vc_column_text]
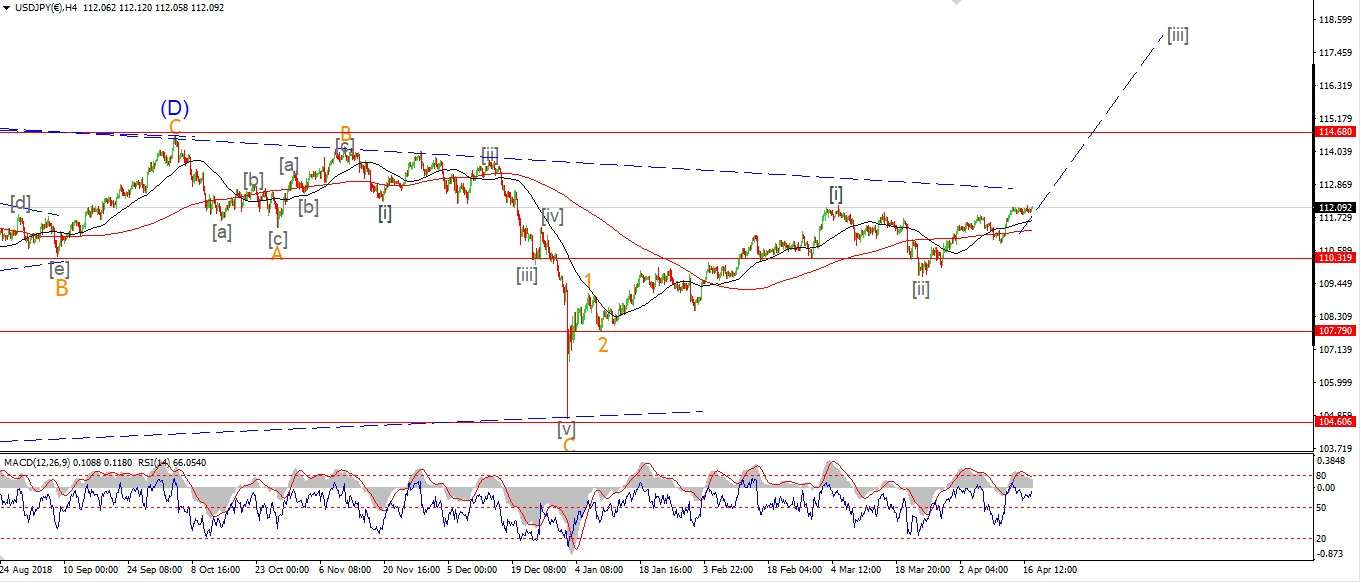 [/vc_column_text][vc_custom_heading text=”Daily” use_theme_fonts=”yes”][vc_column_text]
 [/vc_column_text][/vc_column][/vc_row]
[vc_row][vc_column][vc_column_text]
USDJPY dropped into the lower trend channel line today
as a possible completing move in wave ‘ii’ pink.
The price did react higher also,
but so far that rise is in three waves.
So we must watch for the possibility that wave ‘ii’ is still in force.
If the low at 111.65 holds and we see a rally above resistance at 112.16,
that will be a good sign that wave ‘ii’ is in fact done,
and wave ‘iii’ of (iii) has begun.
A break below 111.00 from here will trigger the alternate count.
Tomorrow;
Watch for price to push above 112.16 again and confirm that wave ‘iii’ has begun.
[/vc_column_text][/vc_column][/vc_row]
[/_s2If]
[_s2If current_user_can(access_s2member_ccap_dow_jones)]
[vc_row][vc_column][vc_separator border_width=”5″][/vc_column][/vc_row][vc_row][vc_column][vc_column_text]
DOW JONES INDUSTRIALS
[/vc_column_text][/vc_column][/vc_row][vc_row][vc_column][vc_separator border_width=”5″][/vc_column][/vc_row][vc_row][vc_column width=”2/3″][vc_custom_heading text=”1 hr” use_theme_fonts=”yes”][vc_column_text]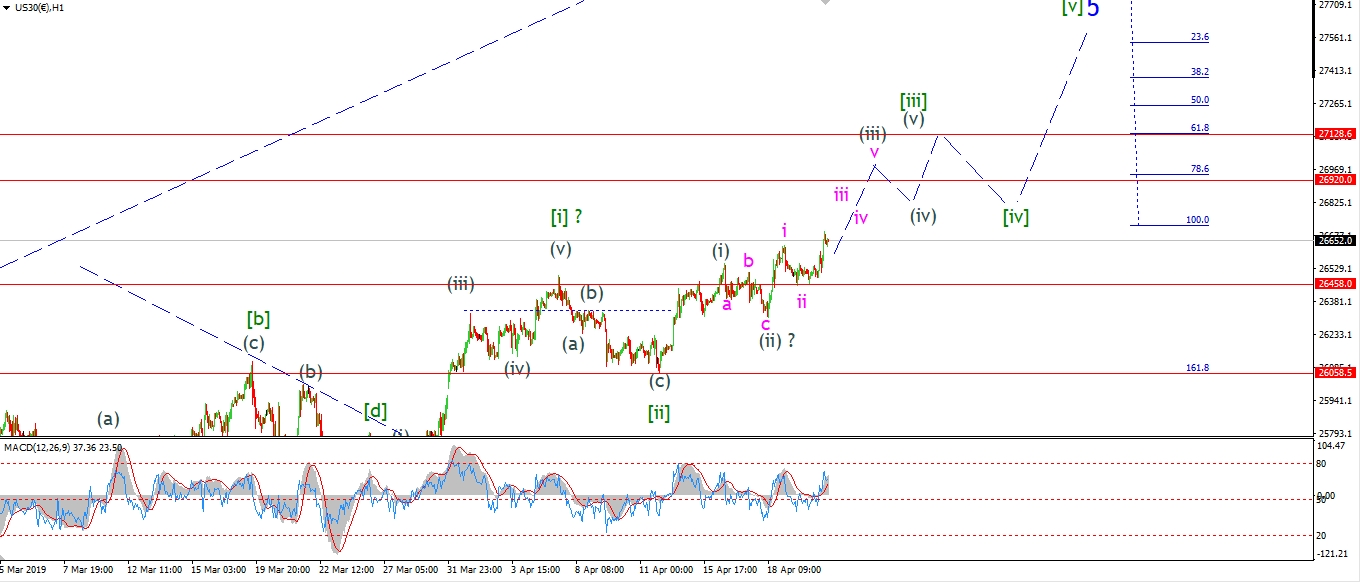 [/vc_column_text][/vc_column][vc_column width=”1/3″][vc_custom_heading text=”4 Hours” use_theme_fonts=”yes”][vc_column_text]
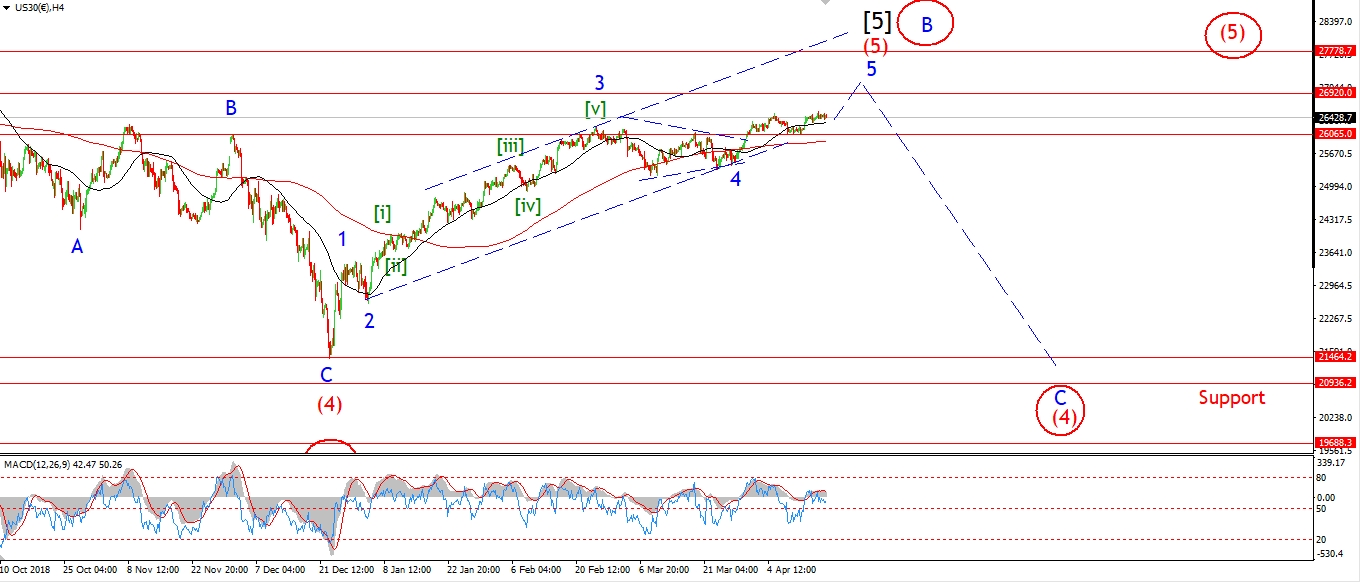 [/vc_column_text][vc_custom_heading text=”Daily” use_theme_fonts=”yes”][vc_column_text]
 [/vc_column_text][/vc_column][/vc_row]
[vc_row][vc_column][vc_column_text]
Todays rally above 26602 is viewed as wave ‘iii’ of (iii) of [iii] of a final top in wave ‘5’.
the rise off wave (ii) is still in three waves,
so we must see a further rally tomorrow
to rule out a larger wave (ii) formation.
Mondays low at wave ‘ii’ pink hit 26458.
This low must hold as wave ‘iii’ develops.
Tomorrow;
The minimum target for this rally to complete lies at the all time high of 26920.
I do expect this level to be broken in wave ‘5’.
But it should offer enough resistance to stall the rally for a period,
while this series of fourth and fifth waves complete.
The eventual high in wave ‘5’ may not even pull significantly higher.
All the problems that halted the last all time high have not gone away.
In fact,
all our problems are now bigger and more menacing than ever before.
Tomorrow;
Watch for wave ‘iii’ to hold above 26458 and continue higher.
[/vc_column_text][/vc_column][/vc_row]
[/_s2If]
[_s2If current_user_can(access_s2member_ccap_gold)]
[vc_row][vc_column][vc_separator border_width=”5″][/vc_column][/vc_row][vc_row][vc_column][vc_column_text]
GOLD
[/vc_column_text][/vc_column][/vc_row][vc_row][vc_column][vc_separator border_width=”5″][/vc_column][/vc_row][vc_row][vc_column width=”2/3″][vc_custom_heading text=”1 hr” use_theme_fonts=”yes”][vc_column_text]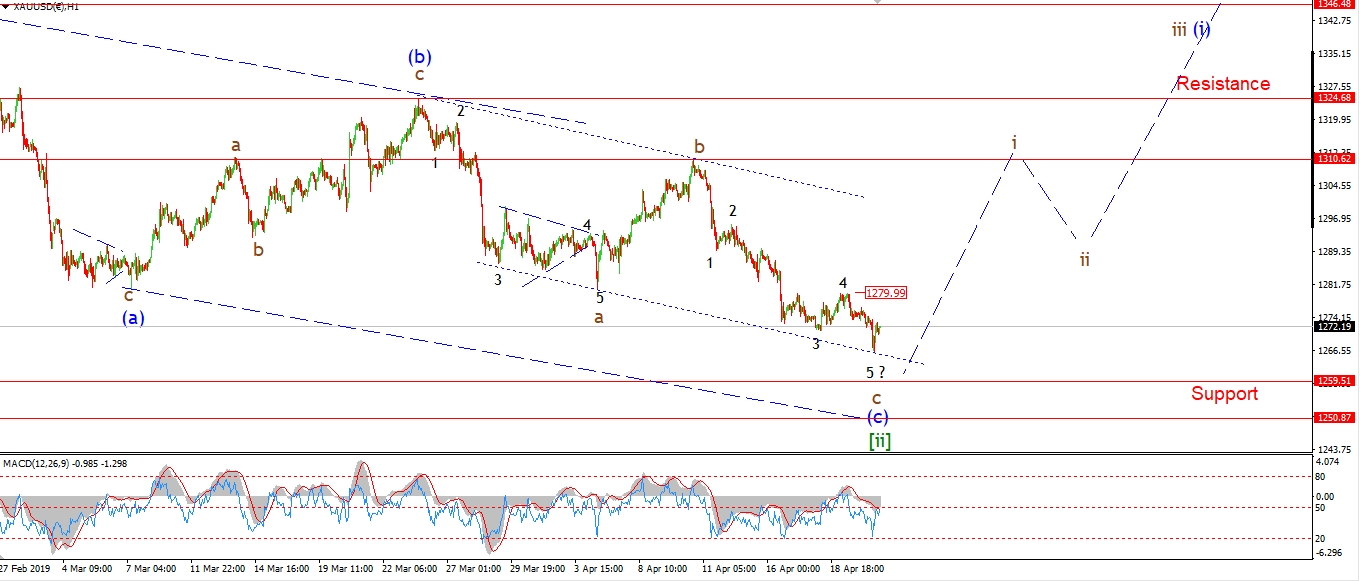 [/vc_column_text][/vc_column][vc_column width=”1/3″][vc_custom_heading text=”4 Hours” use_theme_fonts=”yes”][vc_column_text]
 [/vc_column_text][vc_custom_heading text=”Daily” use_theme_fonts=”yes”][vc_column_text]
 [/vc_column_text][/vc_column][/vc_row]
[vc_row][vc_column][vc_column_text]
It is tempting to call wave ‘c’ complete at todays lows,
Wave ‘5’ of ‘c’ has a five wave structure to it on a 10 minute chart.
The price hit the lower trend channel line again today,
and so far the price has bounced off that low.
The only fly in the ointment right now,
is that the price has not hit support at 1259.50.
This is the point where wave (a) and (c) of [ii] reach equality.
Tomorrow;
So at the moment I am looking again for a possible turn higher in an impulsive wave.
A five wave rally that breaks through 1310 again
will be the best sign yet that the corrective agony is over!
[/vc_column_text][/vc_column][/vc_row]
[/_s2If]
[_s2If current_user_can(access_s2member_ccap_crude)]
[vc_row][vc_column][vc_separator border_width=”5″][/vc_column][/vc_row][vc_row][vc_column][vc_column_text]
U.S CRUDE OIL
[/vc_column_text][/vc_column][/vc_row][vc_row][vc_column][vc_separator border_width=”5″][/vc_column][/vc_row][vc_row][vc_column width=”2/3″][vc_custom_heading text=”1 hr” use_theme_fonts=”yes”][vc_column_text]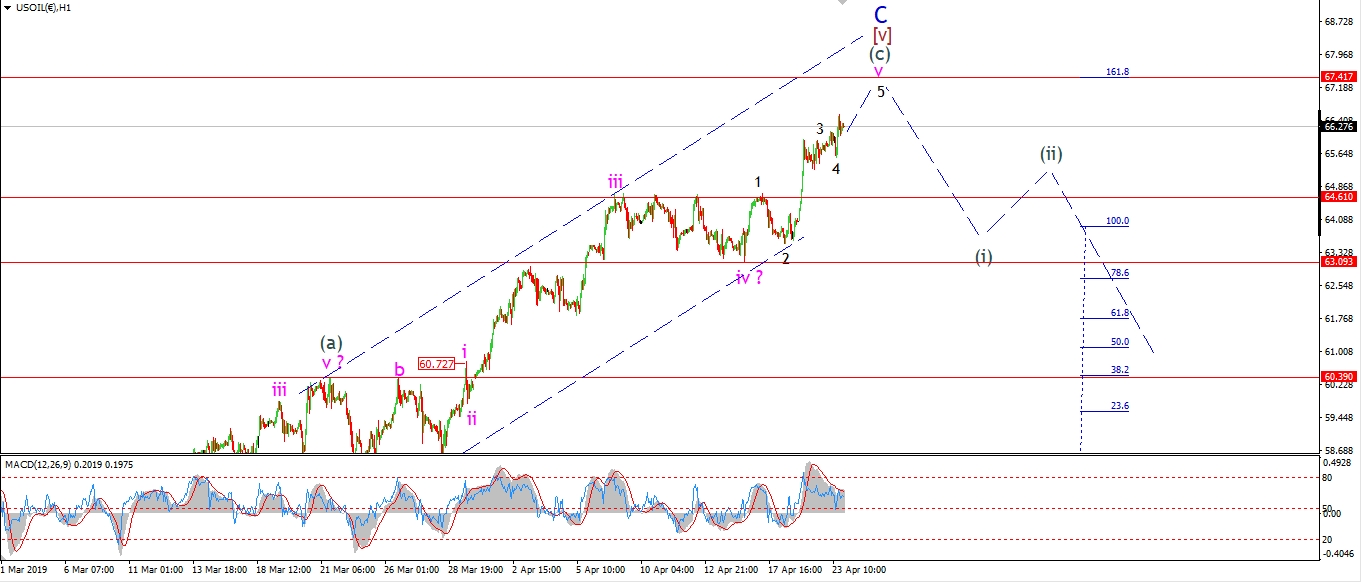 [/vc_column_text][/vc_column][vc_column width=”1/3″][vc_custom_heading text=”4 Hours” use_theme_fonts=”yes”][vc_column_text]
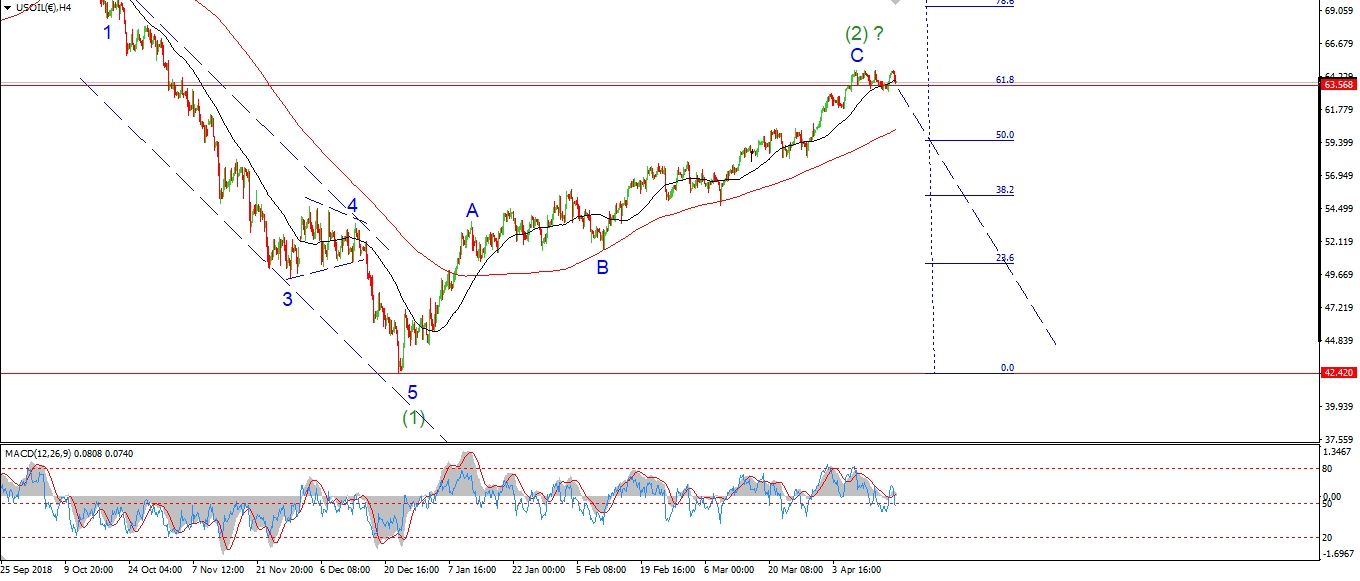 [/vc_column_text][vc_custom_heading text=”Daily” use_theme_fonts=”yes”][vc_column_text]
 [/vc_column_text][/vc_column][/vc_row]
[vc_row][vc_column][vc_column_text]
Crude is so close to a top now that I can almost taste it!
Traders are as bullish now as they were last September,
and this rally will end the very same way.
Wave (2) is taking its time coming to a close,
but as always,
the market is doing a great job at fooling everyone into a bullish position at the worst time.
Wave ‘v’ is now in its final stage after another rally today.
Wave ‘4’ of ‘v’ can be labelled as a running flat correction.
and now wave ‘5’ of ‘v’ is in force.
The upside potential is extremely limited now.
The upper extension target for wave (c) lies at 67.40,
that level should exhaust this over bought rally
and bring in a five wave decline to begin wave (3) down.
Tomorrow;
Watch for wave ‘v’ to reach a final high soon.
We might see the initial turn down into wave (3) before the end of this week.
[/vc_column_text][/vc_column][/vc_row]
[/_s2If]
[_s2If current_user_can(access_s2member_ccap_us10yr)]
[vc_row][vc_column][vc_separator border_width=”5″][/vc_column][/vc_row][vc_row][vc_column][vc_column_text]
US 10 yr Treasuries.
[/vc_column_text][/vc_column][/vc_row][vc_row][vc_column][vc_separator border_width=”5″][/vc_column][/vc_row][vc_row][vc_column width=”2/3″][vc_custom_heading text=”1 hr” use_theme_fonts=”yes”][vc_column_text]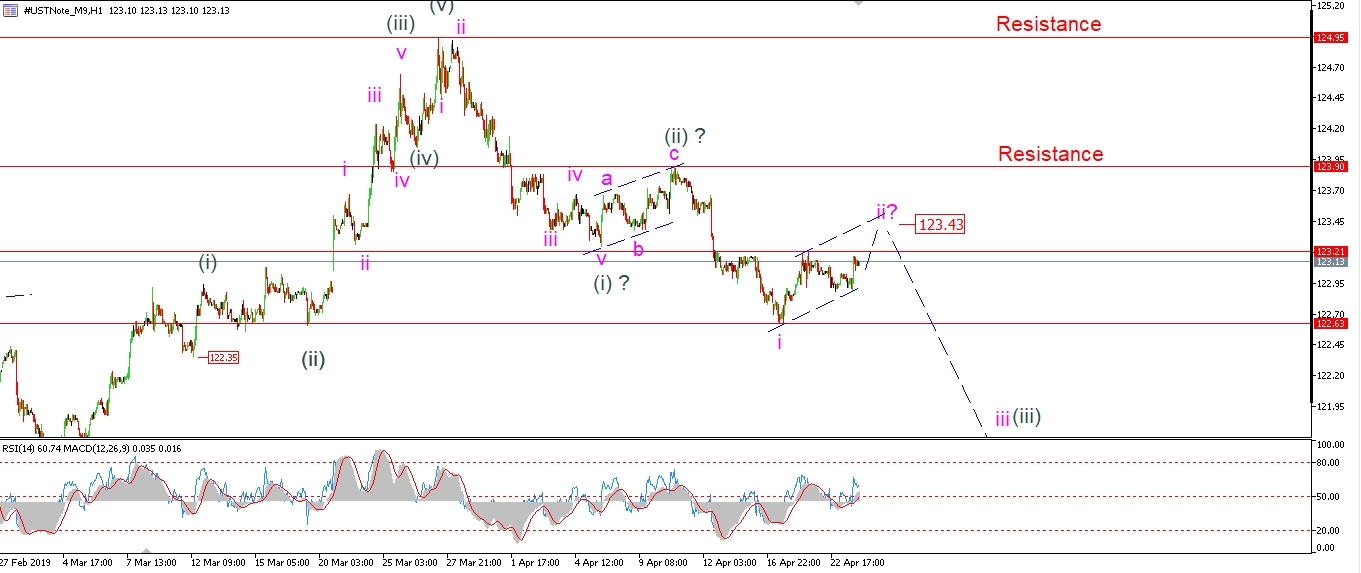 [/vc_column_text][/vc_column][vc_column width=”1/3″][vc_custom_heading text=”4 Hours” use_theme_fonts=”yes”][vc_column_text]
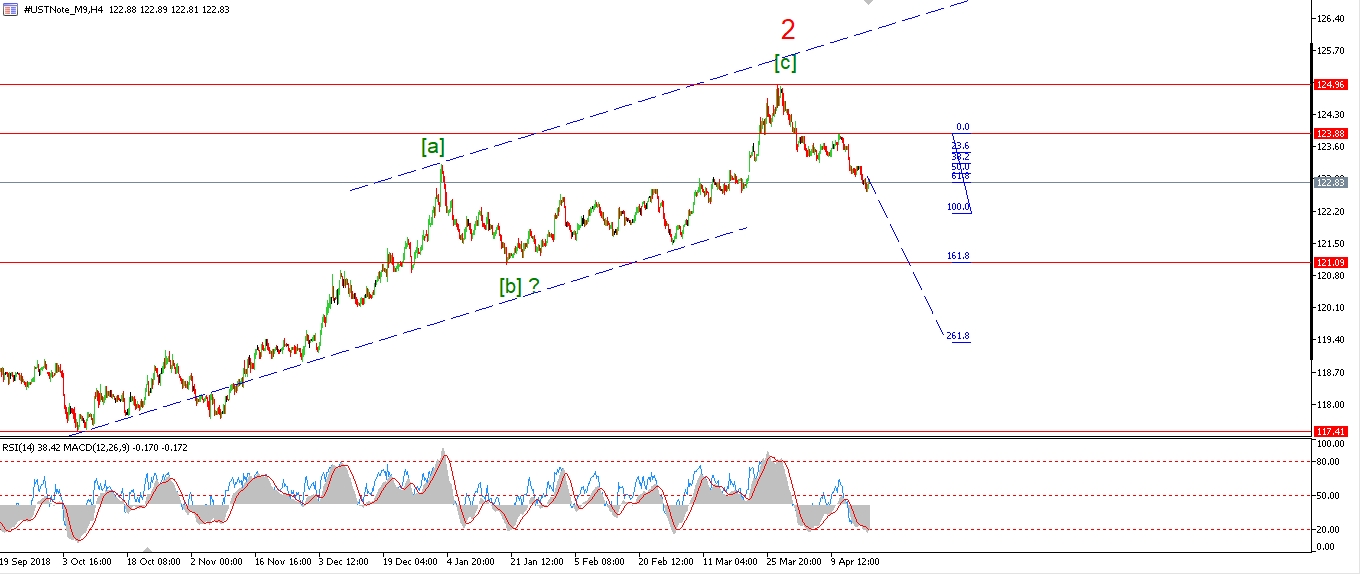 [/vc_column_text][vc_custom_heading text=”Daily” use_theme_fonts=”yes”][vc_column_text]
 [/vc_column_text][/vc_column][/vc_row]
[vc_row][vc_column][vc_column_text]
The 10YR is still correcting higher in wave ‘ii’ pink today after a spike higher ruled out the recent high.
The price should continue above 123.21 tomorrow in wave ‘c’ of ‘ii’ to complete a three wave correction.
The trend channel suggests a high for wave ‘ii’ at about 123.43.
At that point we will be set for a large decline in wave ‘iii’ of (iii).
Tomorrow;
Watch for wave ‘ii’ to complete at 123.43.
A break below 122.63 again will confirm wave ‘iii’ down has begun.
[/vc_column_text][/vc_column][/vc_row]
[/_s2If]
[_s2If current_user_can(access_s2member_ccap_silver)]
[vc_row][vc_column][vc_separator border_width=”5″][/vc_column][/vc_row][vc_row][vc_column][vc_column_text]
SILVER
[/vc_column_text][/vc_column][/vc_row][vc_row][vc_column][vc_separator border_width=”5″][/vc_column][/vc_row][vc_row][vc_column width=”2/3″][vc_custom_heading text=”1 hr” use_theme_fonts=”yes”][vc_column_text]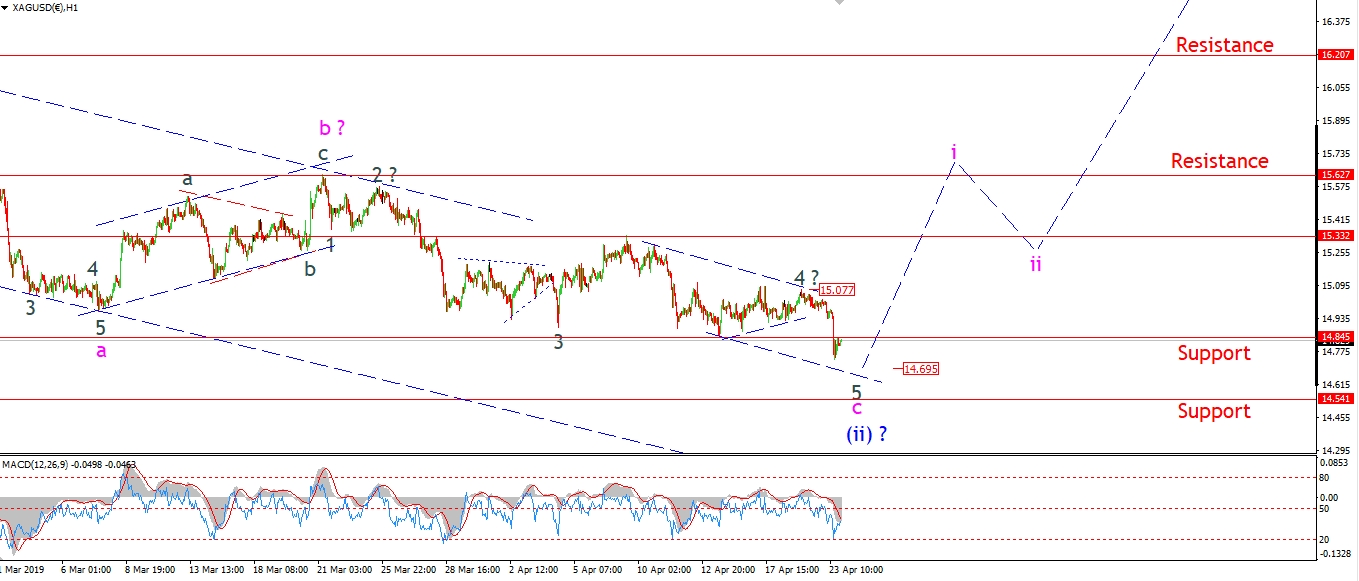 [/vc_column_text][/vc_column][vc_column width=”1/3″][vc_custom_heading text=”4 Hours” use_theme_fonts=”yes”][vc_column_text]
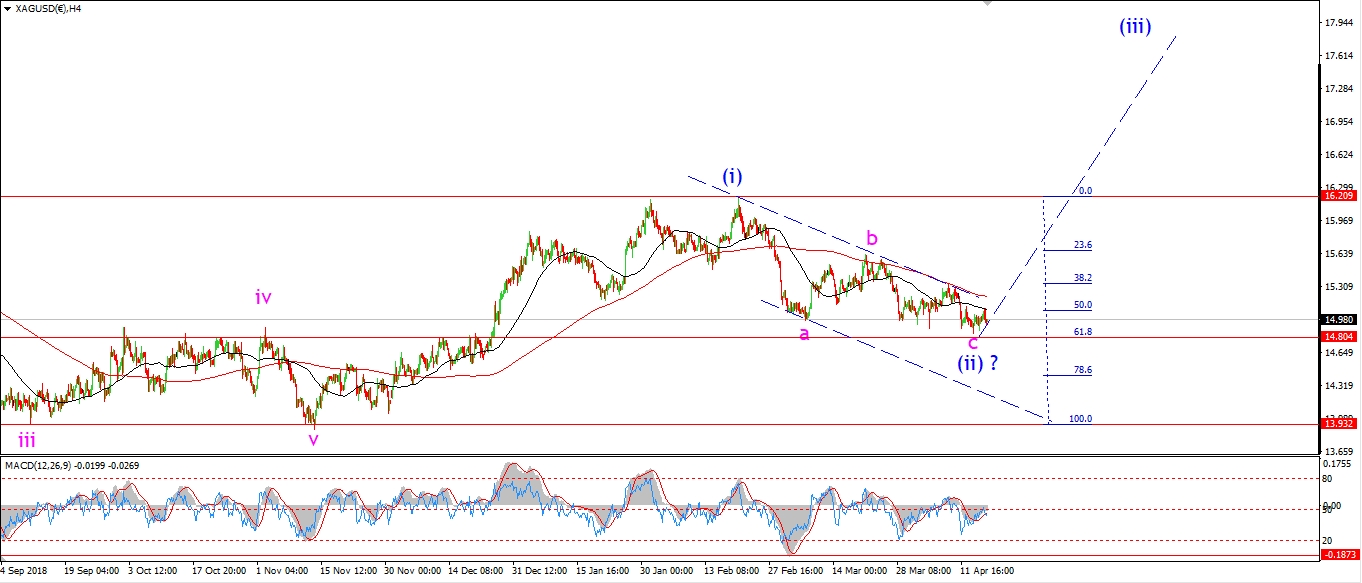 [/vc_column_text][vc_custom_heading text=”Daily” use_theme_fonts=”yes”][vc_column_text]
 [/vc_column_text][/vc_column][/vc_row]
[vc_row][vc_column][vc_column_text]
Silver is near to completing wave ‘5’ of ‘c’
after todays drop towards the lower trend channel line
I can now count a five wave pattern within wave ‘c’ of (c).
A touch off the lower trend line tomorrow,
will bring the price right into the center of that band of support between 14.54 and 14.84.
And that should complete the larger correction in wave (ii).
Tomorrow;
Watch for a final low in wave ‘c’ at about 14.69.
A reaction higher off this level to break above 15.00 again will signal that wave ‘i’ of (iii) has begun.
[/vc_column_text][/vc_column][/vc_row]
[/_s2If]
[_s2If current_user_can(access_s2member_ccap_sp500)]
[vc_row][vc_column][vc_separator border_width=”5″][/vc_column][/vc_row][vc_row][vc_column][vc_column_text]
S&P 500.
[/vc_column_text][/vc_column][/vc_row][vc_row][vc_column][vc_separator border_width=”5″][/vc_column][/vc_row][vc_row][vc_column width=”2/3″][vc_custom_heading text=”1 hr” use_theme_fonts=”yes”][vc_column_text]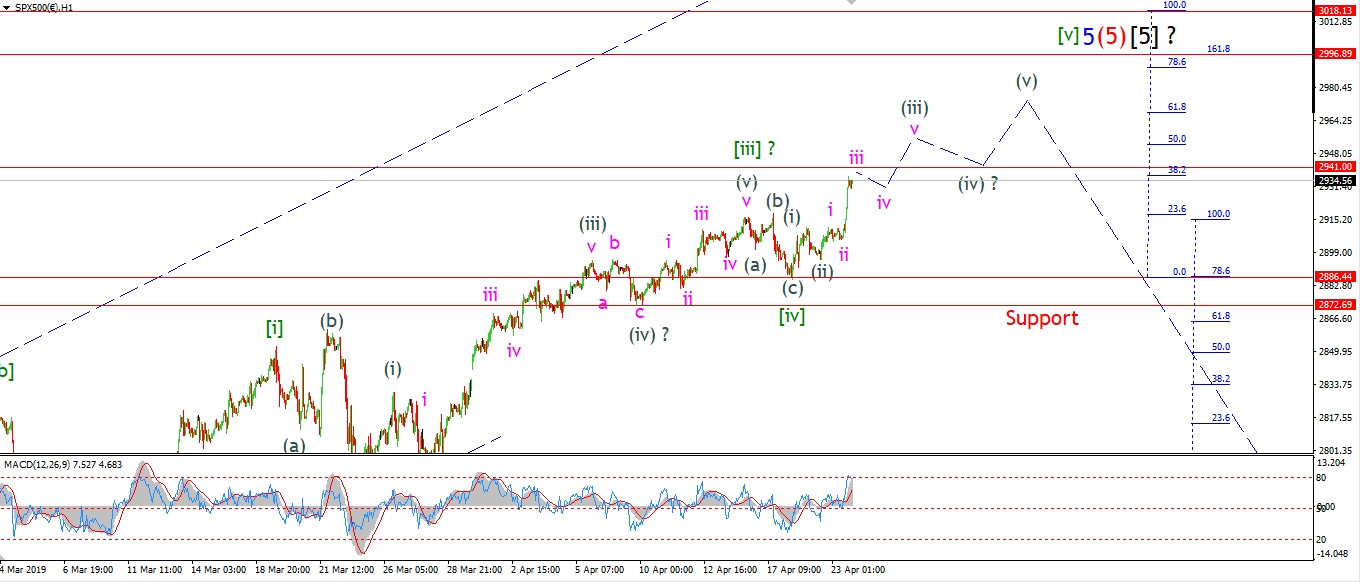 [/vc_column_text][/vc_column][vc_column width=”1/3″][vc_custom_heading text=”4 Hours” use_theme_fonts=”yes”][vc_column_text]
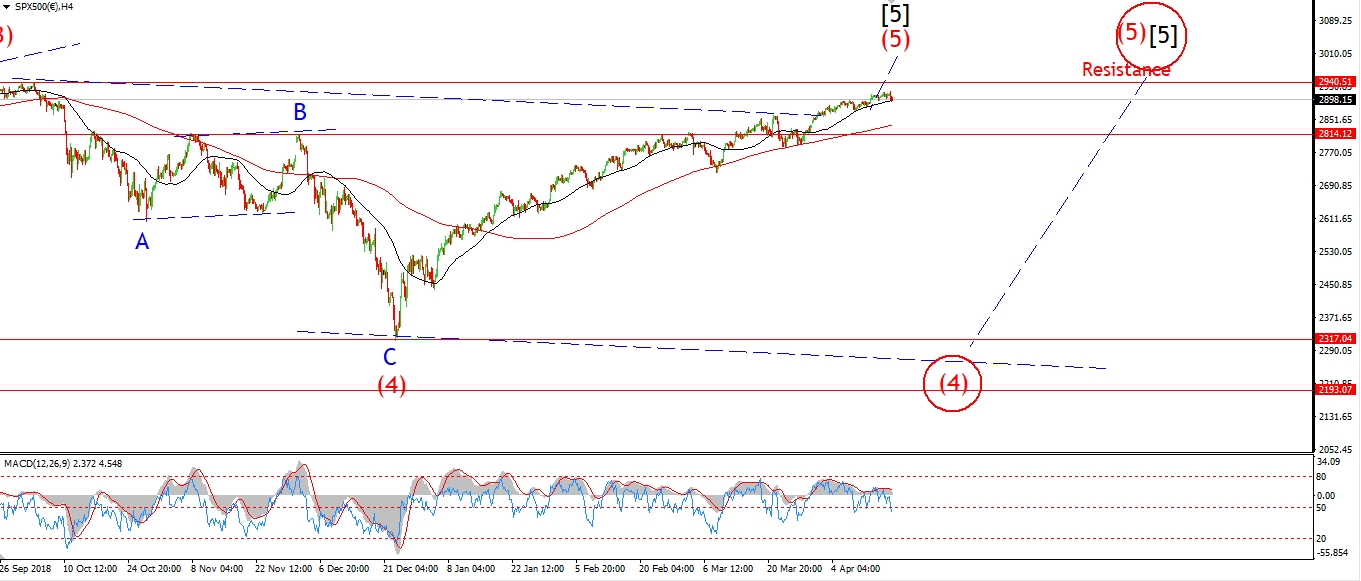 [/vc_column_text][vc_custom_heading text=”Daily” use_theme_fonts=”yes”][vc_column_text]
 [/vc_column_text][/vc_column][/vc_row]
[vc_row][vc_column][vc_column_text]
The S&P went vertical today
and pushed within 5 points of a new all time high.
This rally has confirmed the idea that we are running higher in wave ‘iii’ of (iii) of [v].
the price should now hold above 2911 at wave (i) for the remainder of this rally.
And the market should break to a new all time high this week,
as wave (iii) closes out at about 2955.
The end is very near now!
Tomorrow;
The market may well break to a new all time high to complete wave ‘iii’ of (iii).
If not now,
then wave ‘v’ of (iii) will do it.
We should begin to correct in wave ‘iv’ pink by tomorrow evening.
[/vc_column_text][/vc_column][/vc_row]
[/_s2If]
[vc_row][vc_column][vc_column_text]
[/vc_column_text][/vc_column][/vc_row]
[vc_row][vc_column][vc_separator border_width=”5″][/vc_column][/vc_row]