
Good evening folks.
EURUSD.
EURUSD 1hr.
EURUSD 4hr.
EURUSD daily.
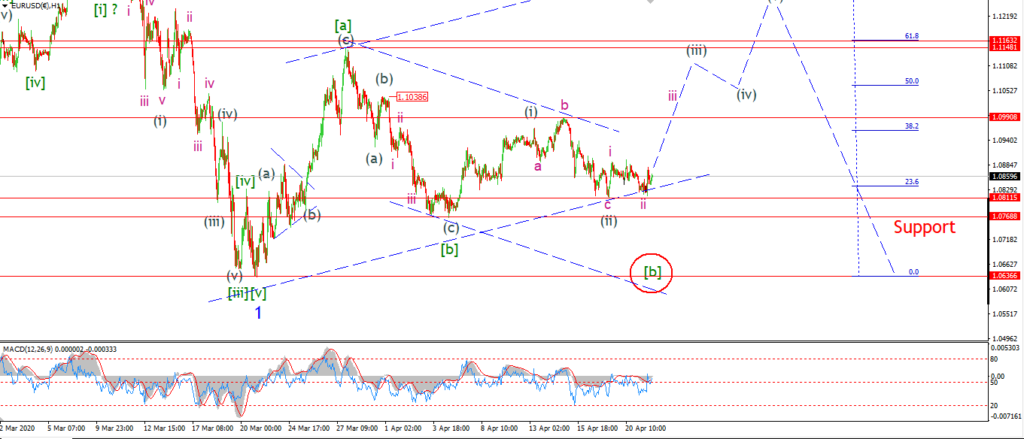
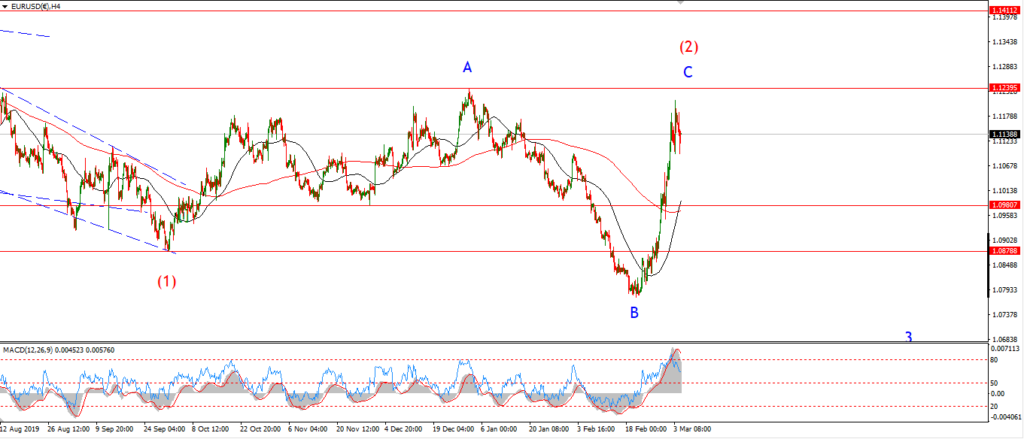
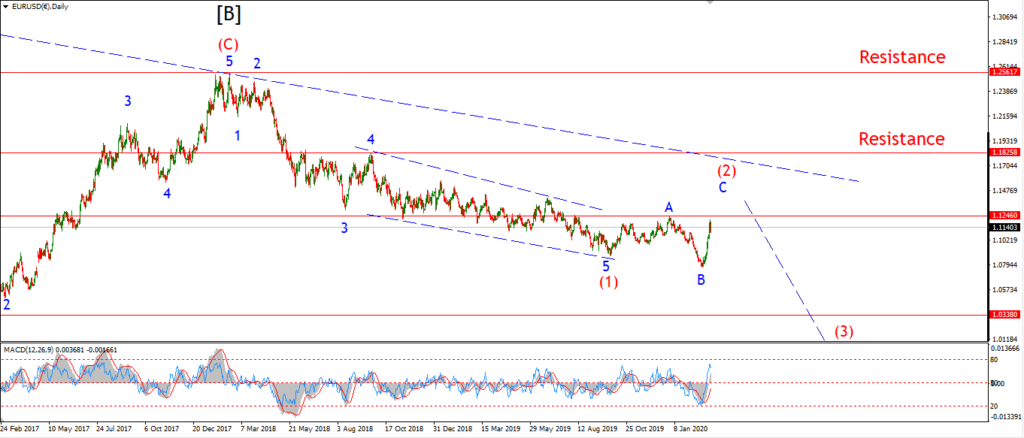
EURUSD has failed to rally into wave (iii) for three days now.
That does not mean the rally will not appear tomorrow,
but it is high time to look seriously at the alternate short term count at least.
The main alternate involves a larger wave [b] decline off the wave [a] high.
This wave would ideally create a three wave pattern off the high,
and then a double bottom in the area around 1.0650 again.
At that point we could expect wave [c] to rally back towards 1.1150 again.
Tomorrow;
A break of 1.0768 will trigger this alternate count.
Back to the main wave count.
the pattern in wave (iii) still stands,
but we need to see a sharp rally begin tomorrow and break above 1.0990 to confirm wave [c] is in force.
GBPUSD
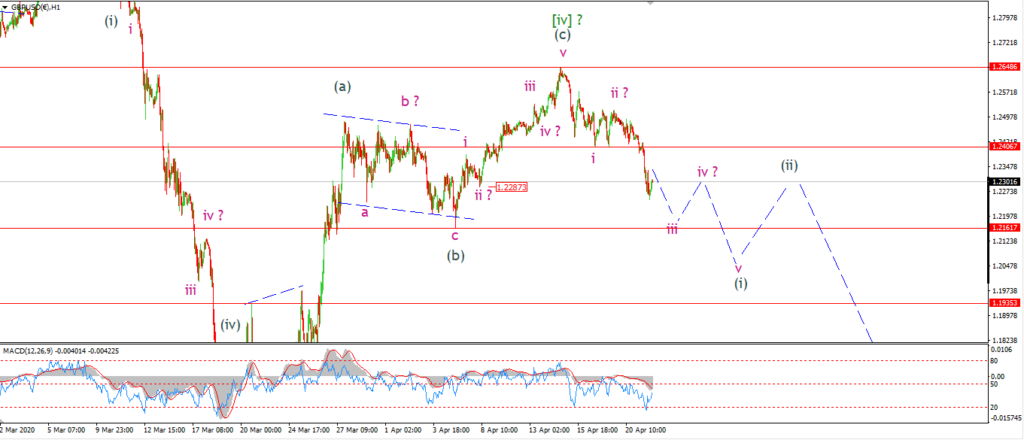
GBPUSD 1hr.
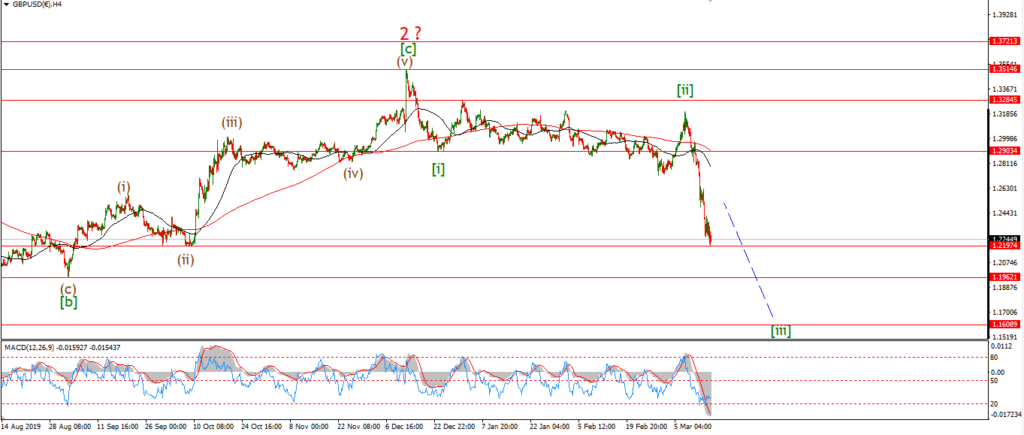
GBPUSD 4hr.
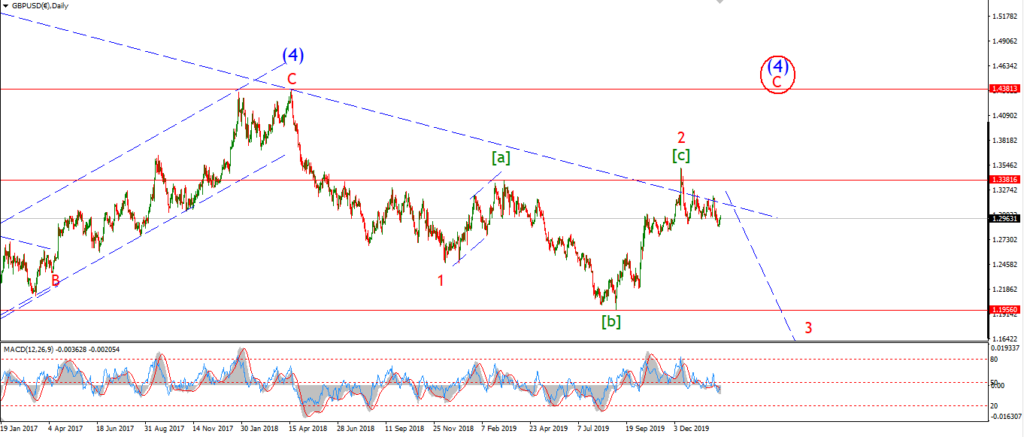
GBPUSD daily.
Cable finally turned lower into wave ‘iii’ of (i) today.
The decline looks impulsive off a possible flat correction wave ‘ii’.
but I would like to see wave ‘iii’ break the support at 1.2161 again before wave ‘iv’ begins.
The pattern in play for wave [v] at the moment has a long way to go to the downside.
with the minimum target for wave [v] at 1.1399 at the wave [iii] low.
So I would like to see the larger impulse wave complete in waves (i) and (ii),
before jumping headlong into the short side.
Tomorrow;
Watch for wave (i) to continue lower and break 1.2161 at a minimum.
This action will confirm that the top is in for wave [iv] and that wave [v] is underway.
USDJPY.
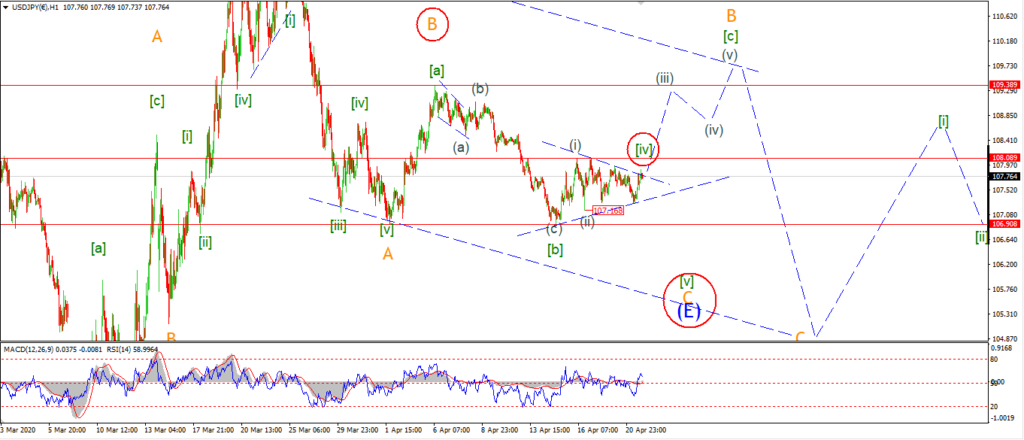
USDJPY 1hr.
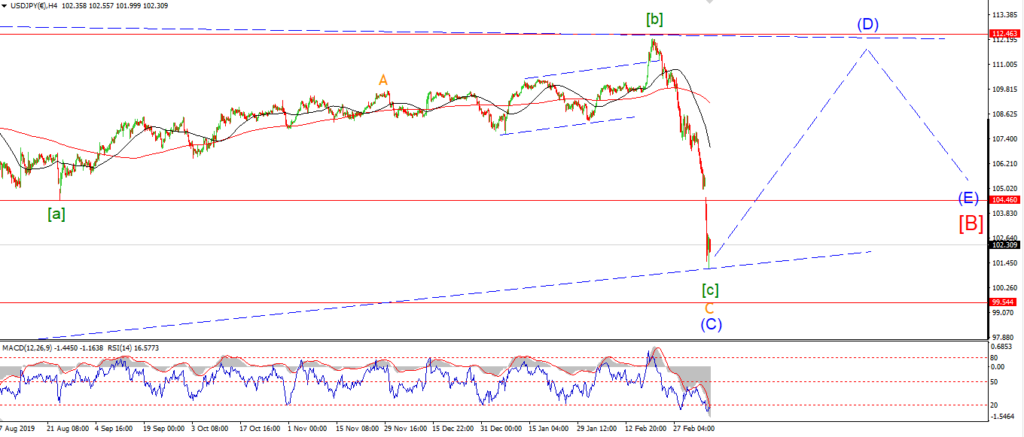
USDJPY 1hr.
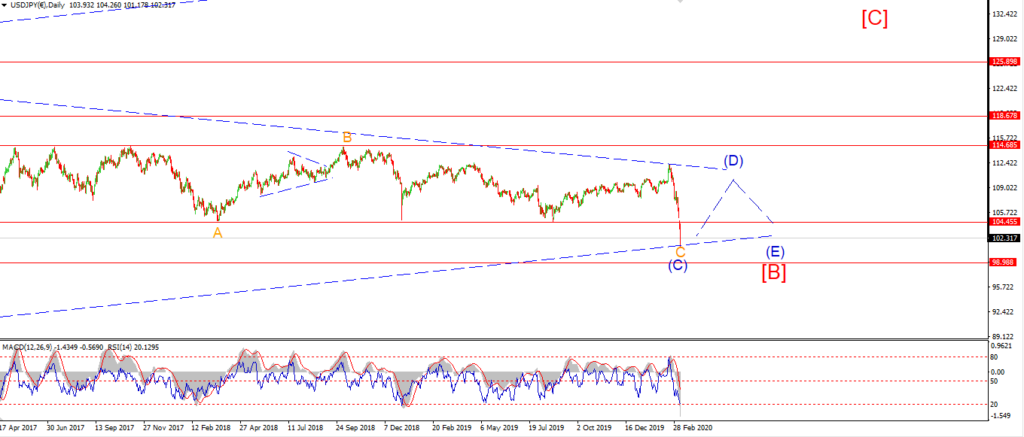
USDJPY daily.
It is hard to deny the fact that USDJPY has compressed in range these last few sessions.
In fact the action could be interpreted as a triangle into todays highs.
This fact does raise the probability that wave ‘C’ is underway already.
I have introduced an alternate count this evening to show that idea.
The sideways action over the last week is shown as wave [iv] of ‘C’.
If the triangle patterns holds below 108.00,
then wave [v] of ‘C’ would again push lower towards the 105.00 handle to complete the larger wave (E).
As for the main count.
A break of that 108.08 high at wave (i) will confirm the count,
and then we can expect wave (iii) of [c] to rally again towrds the 109.40 minimum target.
Tomorrow,
watch for a break out of this range contraction to confirm one of the wave counts above.
108.08 on the high side,
and 106.90 on the low side.
DOW JONES.
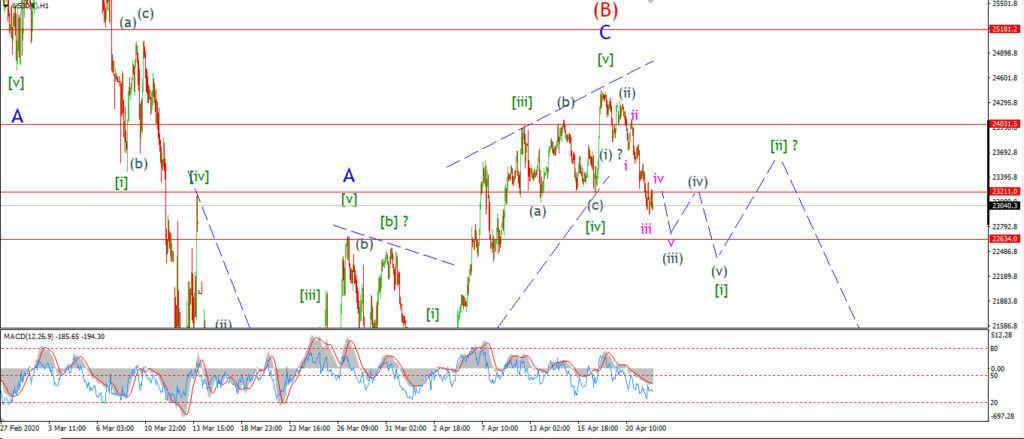
DOW 1hr.
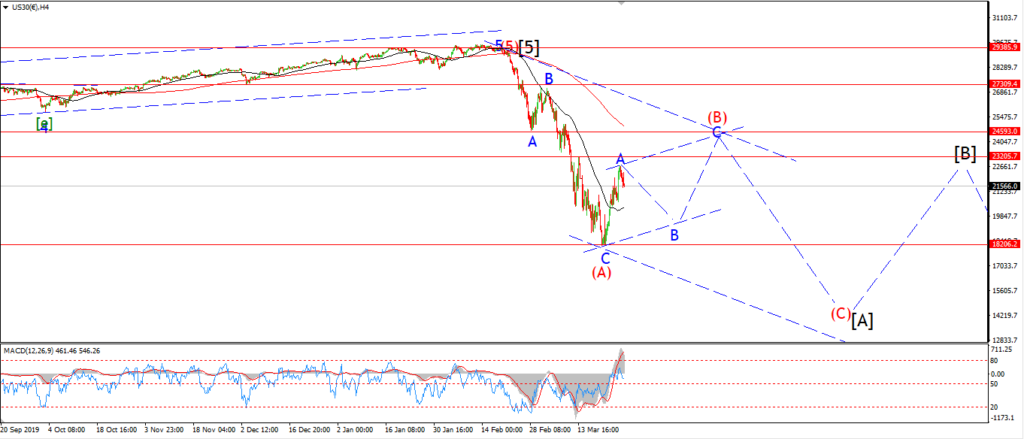
DOW 4hr
DOW daily.
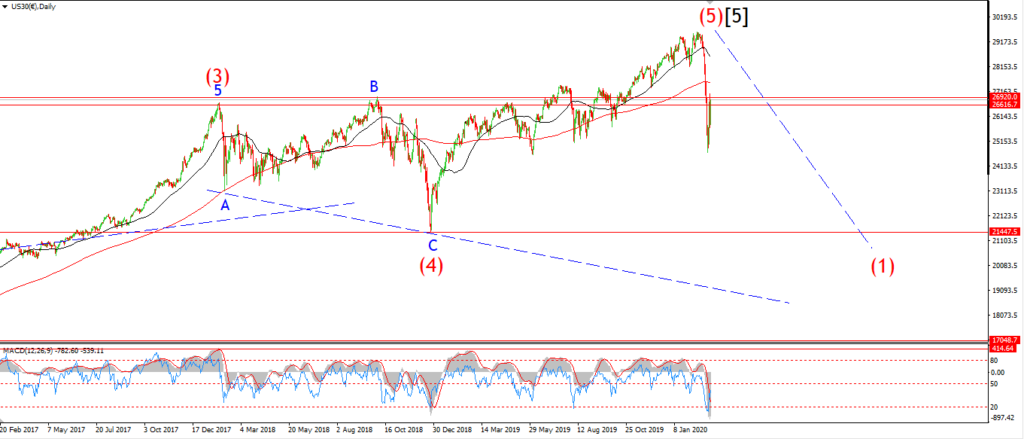
The euphoria is beginning to wear off now after a three week long bear market rally recently.
The market looked weak yesterday.
And today we saw a good follow through to the downside which goes a long way to completing a five wave decline in wave [i].
Also bringing us near to confirming that the top is in now for wave (B).
the leading diagonal idea for wave (i) did not hold today.
The declines continued through the lower trendline and into a five wave pattern.
I have now shown a decline in waves (i), (ii) and (iii) into this evenings lows.
Wave (iii) itself is creating an extension lower and may not be complete just yet.
So we should see some more downside over the next few sessions to complete wave [i] down.
Tomorrow;
Watch for a completed wave (iii) down early tomorrow,
wave (iv) should then correct in three waves.
I would like to see wave (iv) complete below that left shoulder resistance at about 23200.
GOLD
GOLD 1hr.
GOLD 4hr.
GOLD daily.
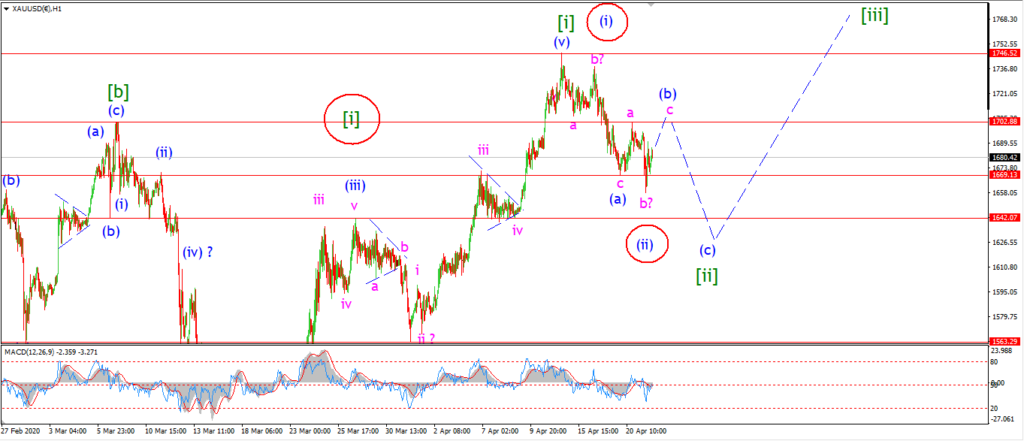
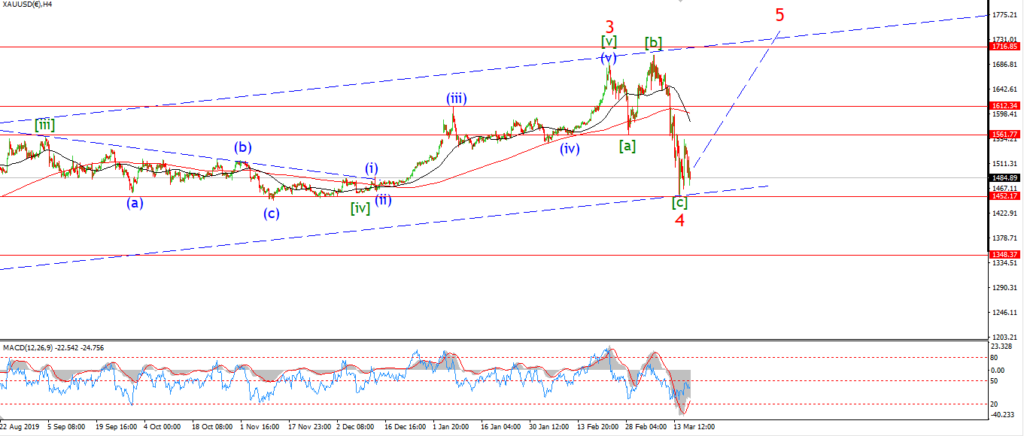
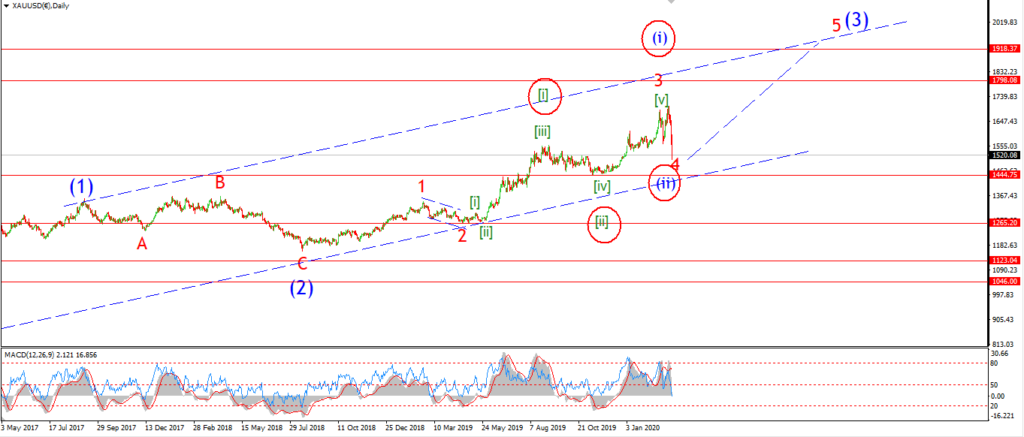
The price action is gold today is a little confused and overlapping.
It seems that wave (b) is still in force and creating a larger expanded flat correction.
This afternoons new lows is labelled wave ‘b’ of (b), and it dropped in three waves overall.
Wave ‘c’ of (b) should push above the wave ‘a’ high at 1702 again to complete the expanded flat.
Once that pattern closes out,
then we can look for wave (c) to drop back into support again in five waves.
Tomorrow;
Watch for wave ‘c’ of (b) to complete with a break of 1702.
Wave (c) should then drop again off that level in a five wave pattern.
CRUDE OIL.
CRUDE OIL 1hr.
CRUDE OIL 4hr.
CRUDE OIL daily.
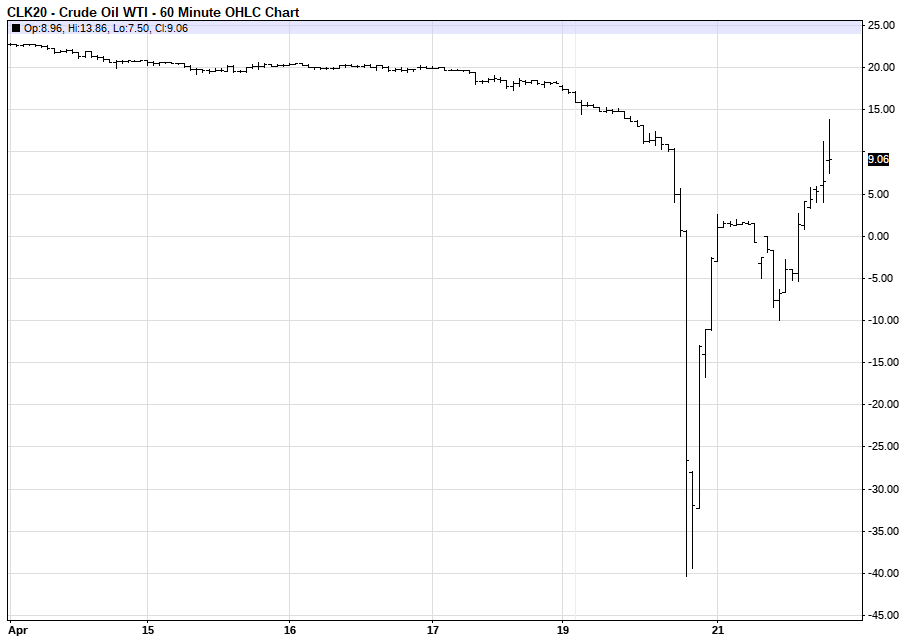
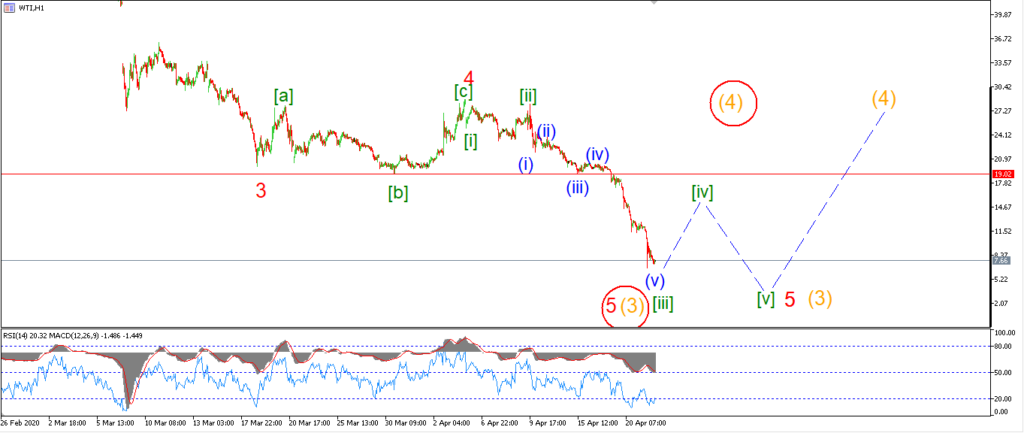
Things are not looking great in the oil market these days, but the price at least recovered out of negative territory today, which is something at least!
The wild gyrations in prices are still hard to nail down on the short term chart.
I am noting that the rally out of negative territory today has traced out three waves on the cash chart.
This is not reflected in my derivative chart again.
But this is worrying if the pattern remains this way.
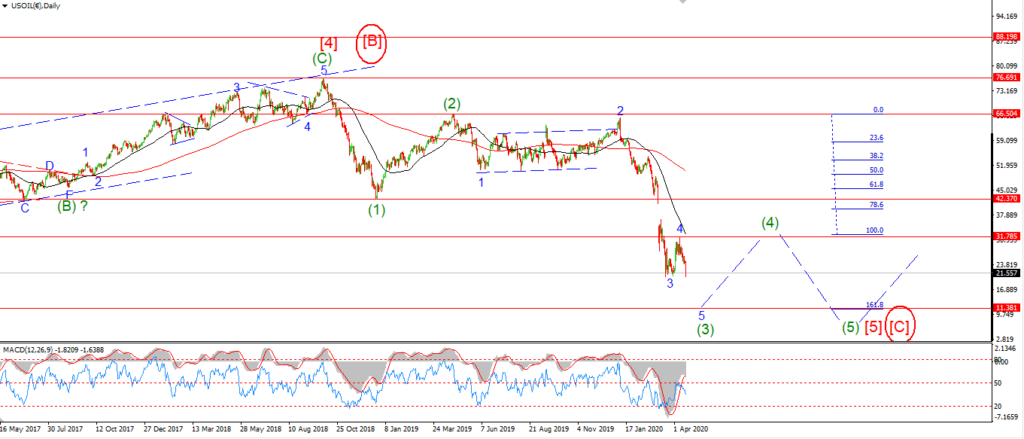
As it suggests another burst into the negative again next month when the next contract rollover occurs.
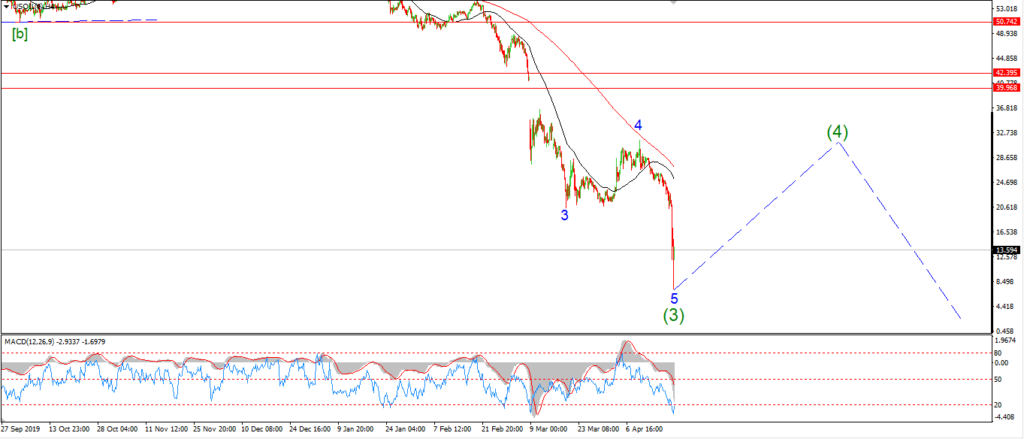
This can be viewed as a larger wave (5) decline on the daily chart.
As for the short term pattern.
I dont think we have enough action to go on yet to decide on a short term count.
Tomorrow;
It is possible that wave ‘5’ of (3) is now complete.
And we can expect some relief in wave (4).
I have shown that as the alternate count though.
Otherwise this bounce is only wave [iv] of ‘5’,
and there is even more pain on the way for the crude oil market.
S&P 500.
S&P 500 1hr
S&P 500 4hr
S&P 500 daily.
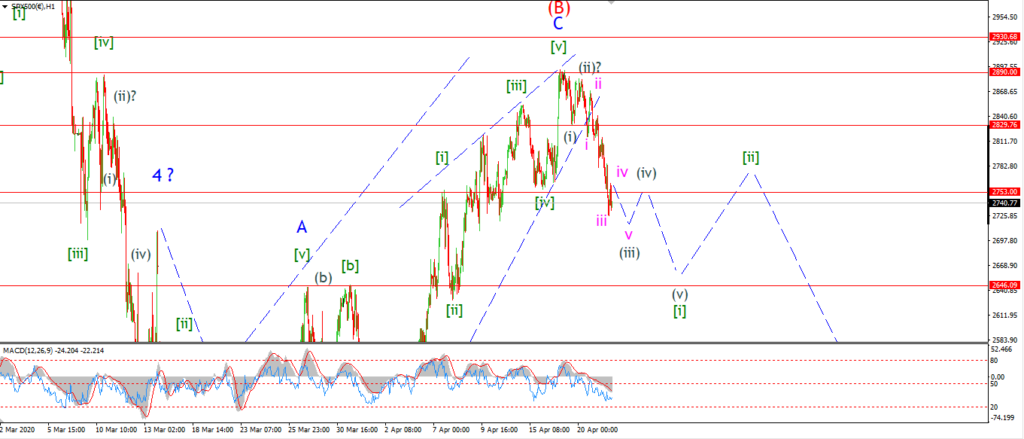
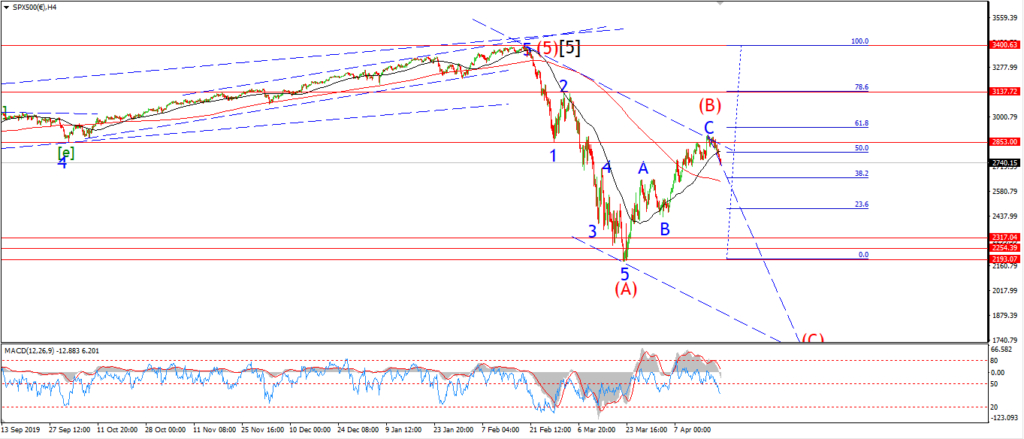
The S&P is moving in lockstep with the DOW today.
The leading diagonal did not work in as suggested last night,
the price continued lower in the futures and early trade today.
And now we have a pretty clear ongoing impulse wave lower in wave [i] now in play.
The declines into todays lows is regarded as wave (iii) of [i].
So we should see a correction and decline again in waves (iv) and (v) over the next few sessions,
This will complete the larger wave [i] down.
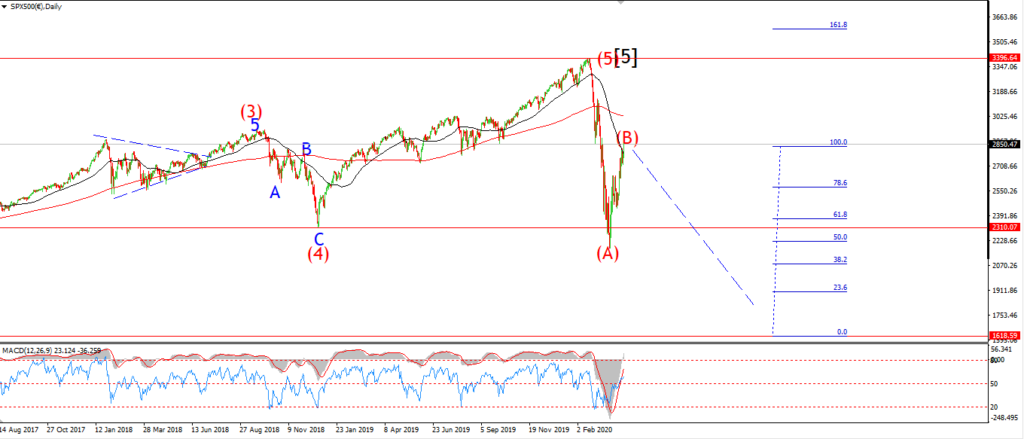
Then I will focus on that all important lower high in wave [ii].
That will complete a bearish impulse wave to the downside,
and open the trap door for a sharp decline in wave [iii] of ‘1’ of (C).
Slowly but surely we are moving into the danger zone again in the stock market.
Tomorrow;
watch for wave [i] to continue lower and complete a five wave pattern.
A break of the wave ‘A’ high at 2646 will be a good target to hit to complete wave [i].
Wave (iv) of [i] should hold below 2800 on the upper end.
A break of 2830 again will put the bearish count into doubt.
SILVER.
SILVER 1hr
SILVER 4hr.
SILVER daily.
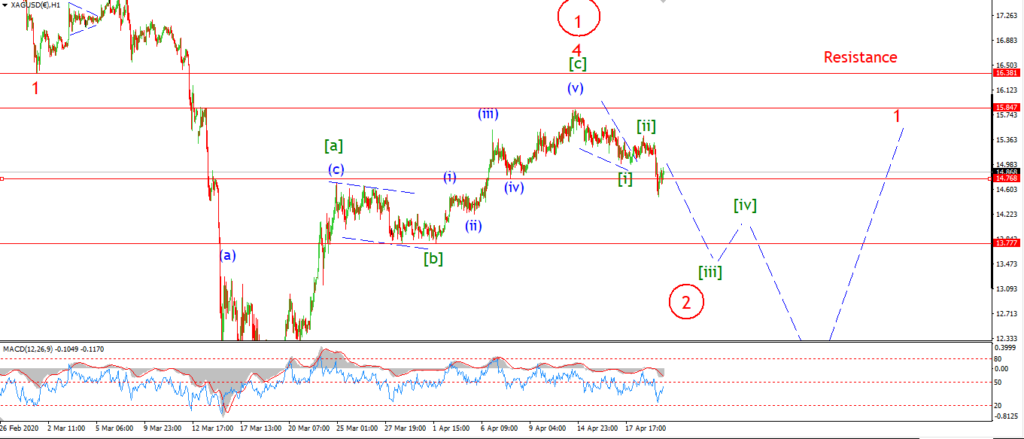
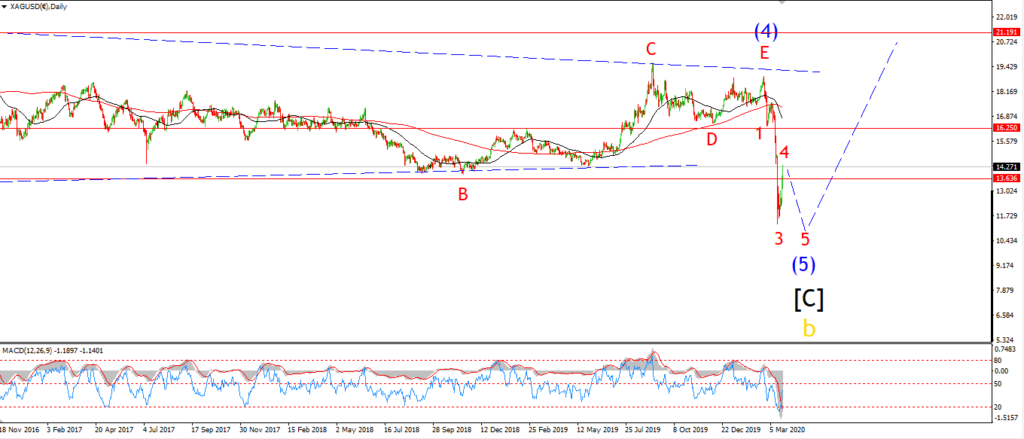
Silver finally took a step lower today,
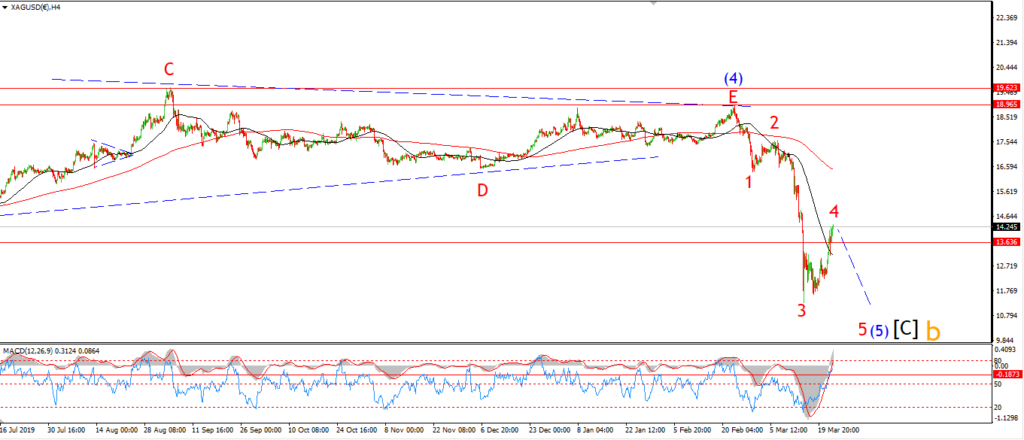
which is inline with the idea that wave ‘5’ is underway now.
the biggest issue I have with the bearish count right now,
is that the declines are not strong enough to really confirm an impulsive decline in wave ‘5’.
So far the drop off wave ‘4’ has only traced out a three wave pattern.
This action can be interpreted as a simple flat correction in wave ‘2’ as per the alternate count.
So you can understand why I have not ruled out the bullish count at all yet.
Tomorrow;
If we do not see an acceleration lower into wave [iii] green as shown by tomorrow evening.
I will be seriously considering switching to that bullish alternate count.
Watch for wave [iii] of ‘5’ to fall quickly below 13.70 to confirm wave ‘5’ is underway.