
Hi there all, another week begins and boy what a week it is already.
Negative crude oil prices, airlines cutting 100’s of thousands of jobs, millions added to the dole lines, international political arguments and suspicion.
And that is just the stuff in the headlines.
Social mood has truly turned severely negative but still the stock market is holding up, for now.
Lets get into the action to see what lies ahead this week.
https://www.zerohedge.com/energy/heres-next-problem-where-do-100-million-oil-barrels-get-delivered
EURUSD.
EURUSD 1hr.
EURUSD 4hr.
EURUSD daily.
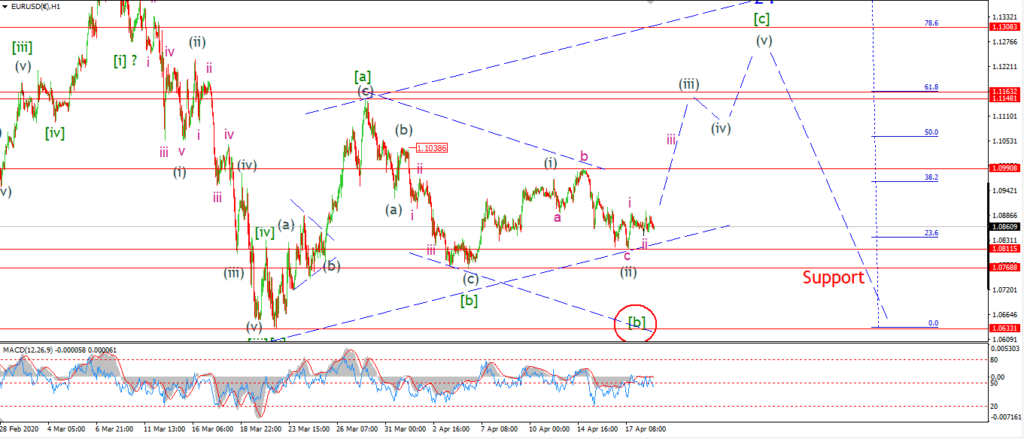
Fridays low at 108.11 marking the low of wave (ii) has held today.
The trade was muted to say the least today,
without any shift in momentum to the upside just yet.
In general I expect a move higher in wave (iii) of [c] to begin soon.
I have labelled the spike off Fridays lows as wave ‘i’ of (iii),
So todays flat and corrective looking action is regarded as wave ‘ii’ of (iii).
If this short term count is correct,
then wave ‘iii’ of (iii) should rally off 1.0811,
up above initial resistance at 1.0990 by tomorrow evening.
A break of that level will signal wave (iii) is in force.
Tomorrow;
Watch for wave ‘iii’ of (iii) up to continue above 1.0990 at a minimum.
1.0811 must hold.
GBPUSD
GBPUSD 1hr.
GBPUSD 4hr.
GBPUSD daily.
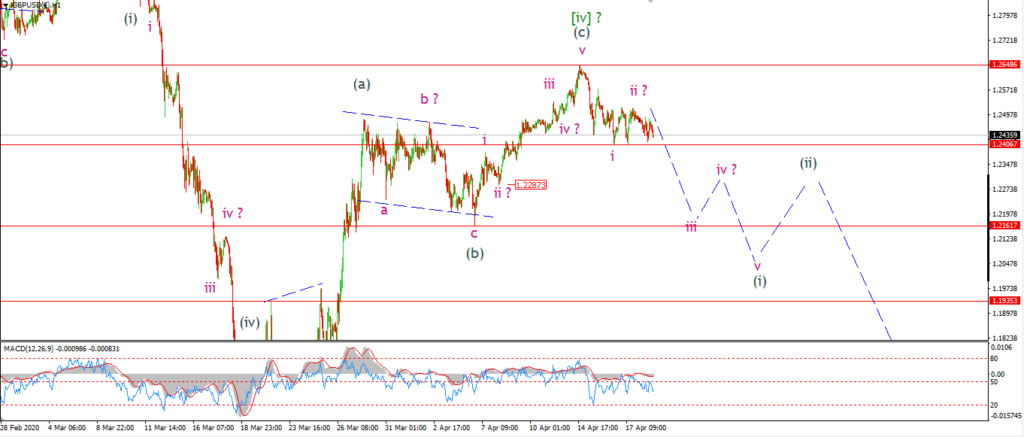
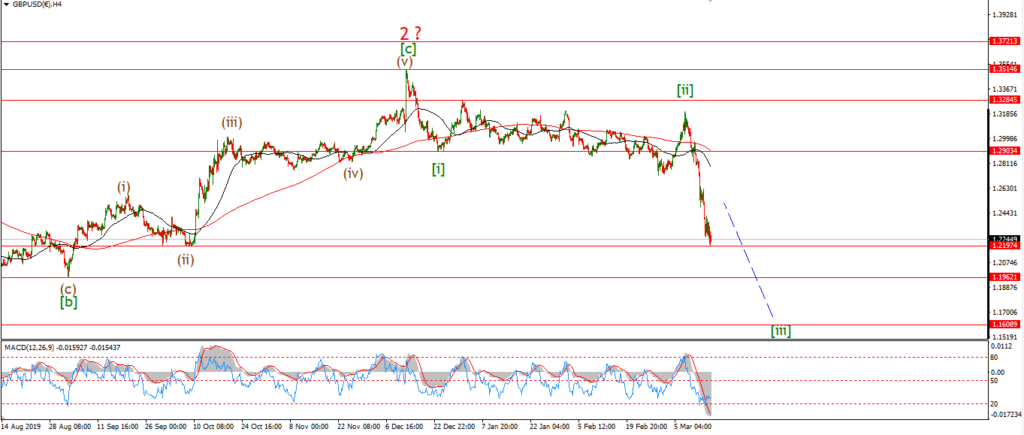
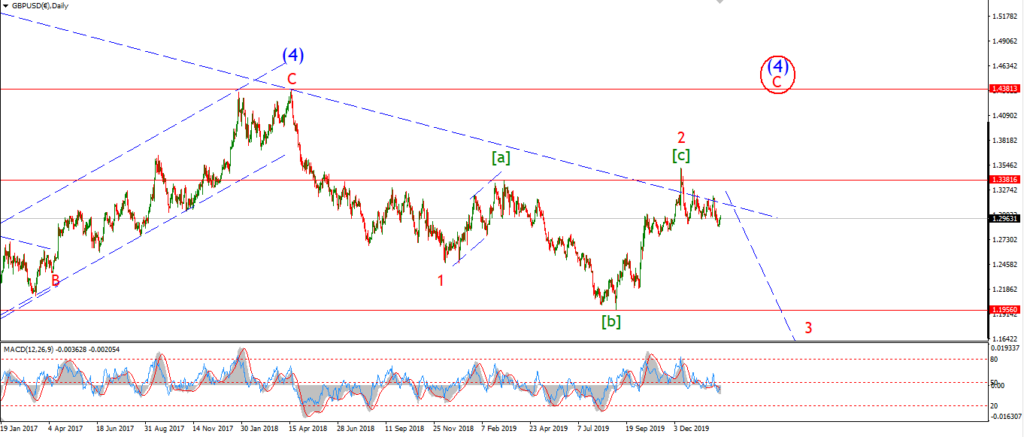
The action in cable today did very little to confirm the short term count.
It seems that cable is stuck in a very tight range around 1.2460 at the moment.
Only a sharp move below the lower end of the range at 1.2406,
can shift the action in favor of the short term count.
If that happens,
I am expecting to see a clear five wave pattern develop in wave (i) to the downside this week.
That action will signal the larger wave [v] has begun.
With targets for wave [v] down in the region of 1.1350 at a minimum.
Tomorrow;
We must wait for the market to reveal its hand first.
Watch for wave (i) of [v] to break 1.2161 and confirm the move into wave [v] has begun.
USDJPY.
USDJPY 1hr.
USDJPY 1hr.
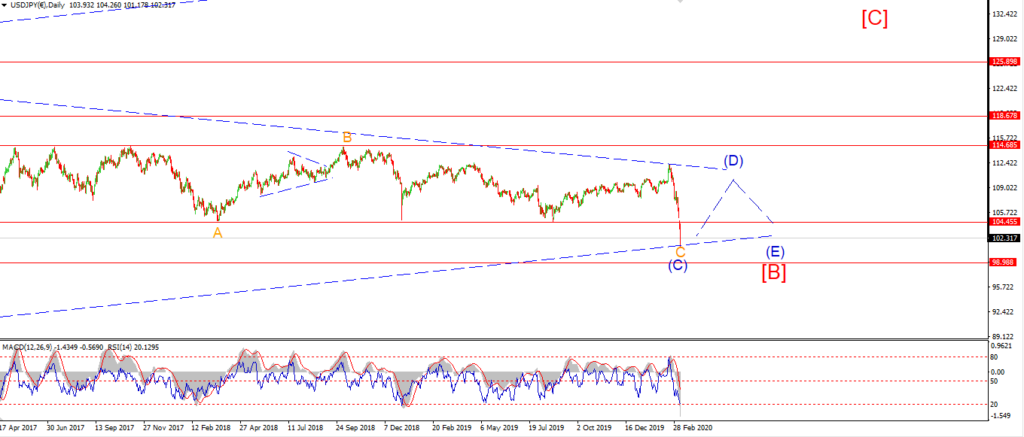
USDJPY daily.
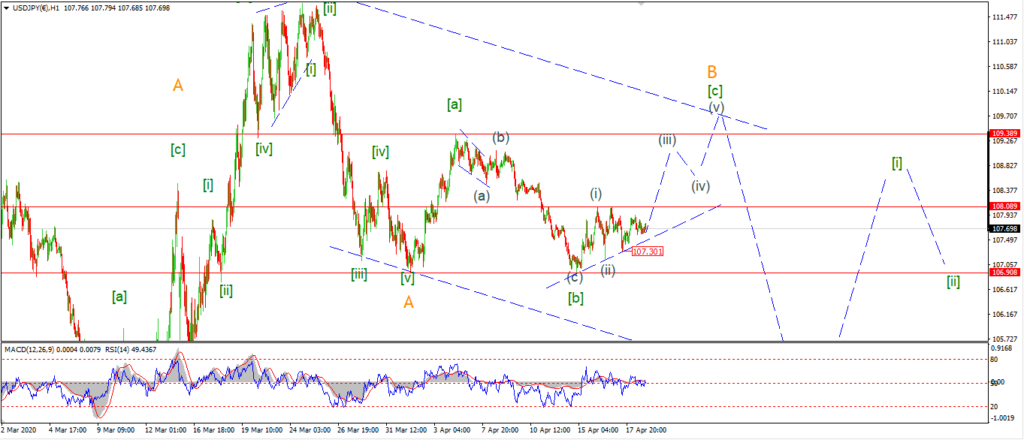
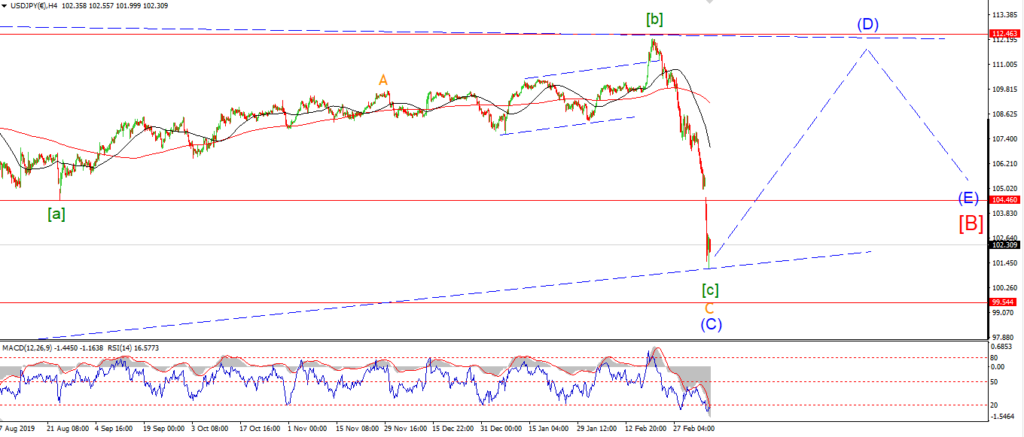
It is a similar story in USDJPY this Monday.
The price action is dead in the water today.
But so far the upside bias is holding with on the chart.
If the price continues to hold above 107.30 tomorrow,
and we see a rise above 108.10 again,
that will be a good sign that wave (iii) is underway.
Tomorrow;
Wave (iii) must begin soon.
Watch for the price to hold above 107.30 at Fridays lows.
Wave (iii) itself should easily push above 109.38.
DOW JONES.
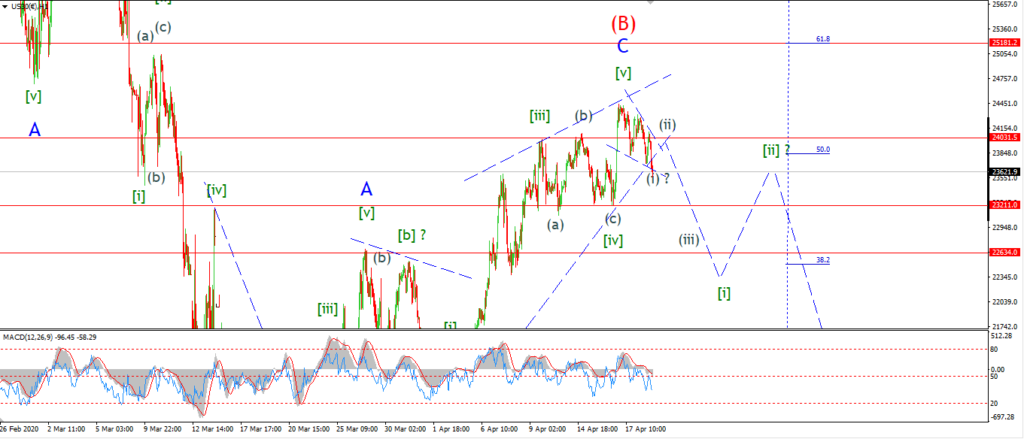
DOW 1hr.
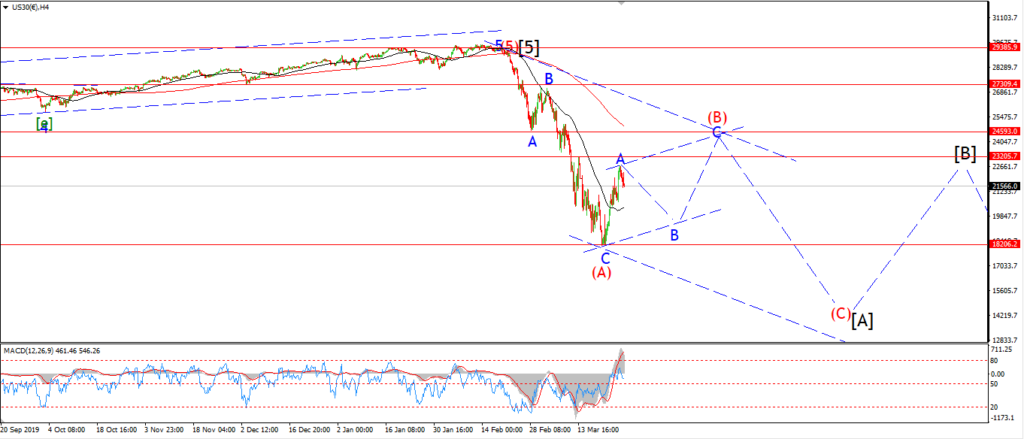
DOW 4hr
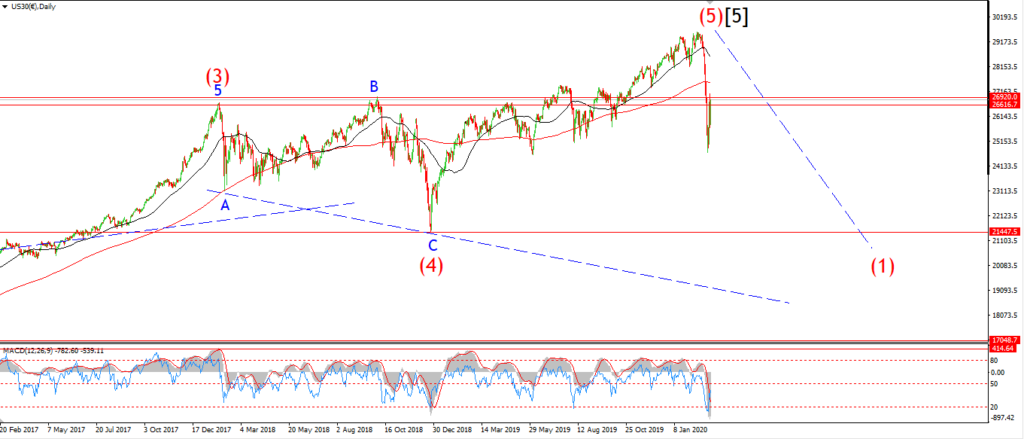
DOW daily.
The main impetus of the trade today was to the downside in the DOW.
Although the decline is not overwhelming at all,
but it sure is creating an interesting pattern coming into the close tonight.
In general this week I am looking for an impulse wave to the downside
to begin in wave [i] green as shown on the short term chart.
I have labelled todays action as a possible leading diagonal or wedge pattern.
My chart includes the futures trade,
So the pattern is different on the cash trade only.
But this pattern is giving us a big hint this evening,
that the rally into wave (B) is now done.
A leading diagonal is an impulsive structure, and it does suggest that the turn lower is underway.
So this action could be wave (i) of [i] as shown.
The price will have to make a new low below 23700 to complete.
And then I will look for a lower high again in wave (ii),
before the price falls into a larger decline in wave (iii) of [i].
Its not a perfect pattern off the top I will admit,
but I am most definitely focusing on the downside potential that could arise now.
Tomorrow;
Watch for a possible lower ingh in wave (ii) to complete.
If the price falls below 23200 again,
that will signal wave (iii) of [i] has begun.
GOLD
GOLD 1hr.
GOLD 4hr.
GOLD daily.
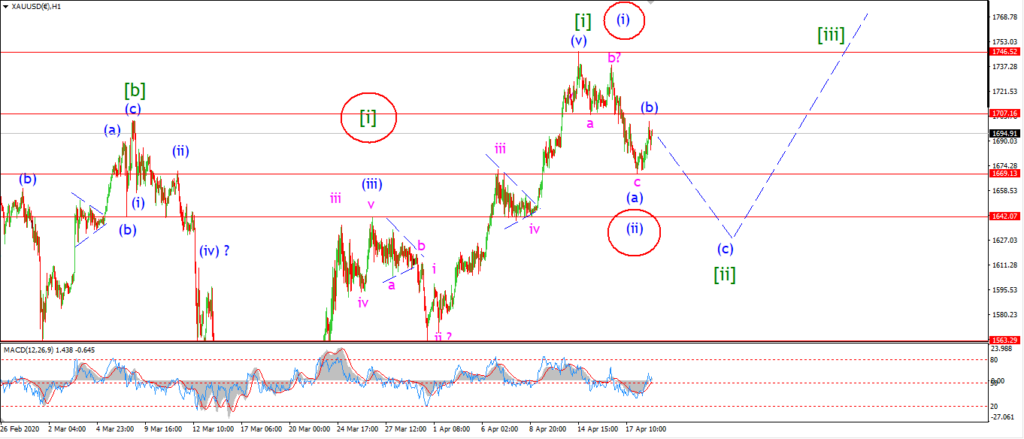
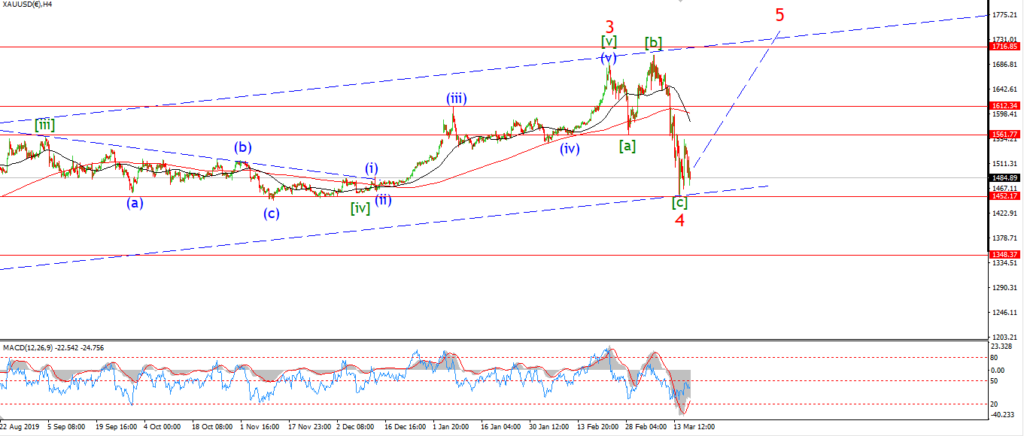
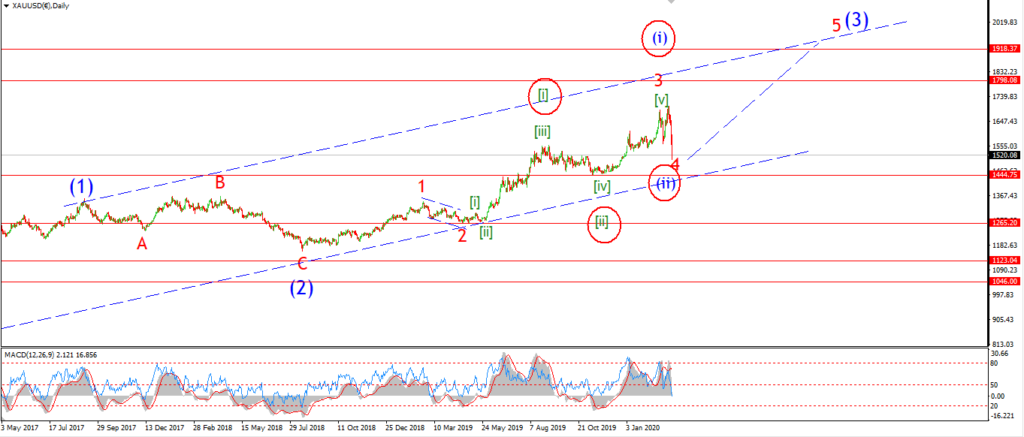
Gold is swinging between both short term wave counts these last few days.
As it stands this evening,
the action off Fridays lows is not very impulsive looking right now.
Especially because of the declines this evening again.
It seems that wave (b) traced out a three wave rally into todays high at 1702.
So the main count for wave [ii] is again favored this evening.
If wave (b) is complete at todays high,
then wave (c) should take over and head lower towards initial support at 1640 over the next few days.
Tomorrow;
Watch for wave (c) to continue lower in a five wave pattern.
Once we hit that 1640 area again I will begin to look higher into wave [iii].
If the price turns higher again and breaks out above 1746 without making a new low,
that action will favor the alternate count.
CRUDE OIL.
CRUDE OIL 1hr.

CRUDE OIL 4hr.
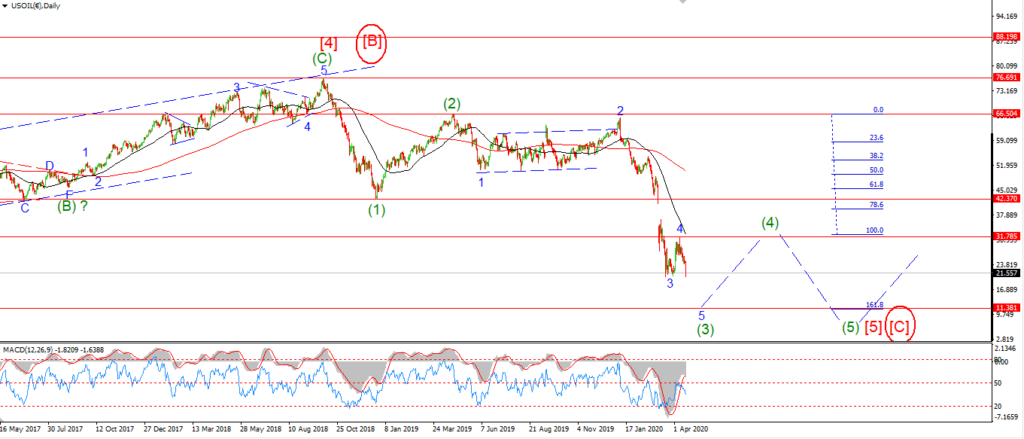
CRUDE OIL daily.
Well, well, well,
that just happened!!
I honestly did not think producers would have to pay to ship oil out and into storage.
but here we are.
The May contract dropped as low as -$40 this afternoon.
Remember this day folks,
there will be books written about it, but we lived at the moment oil went negative!
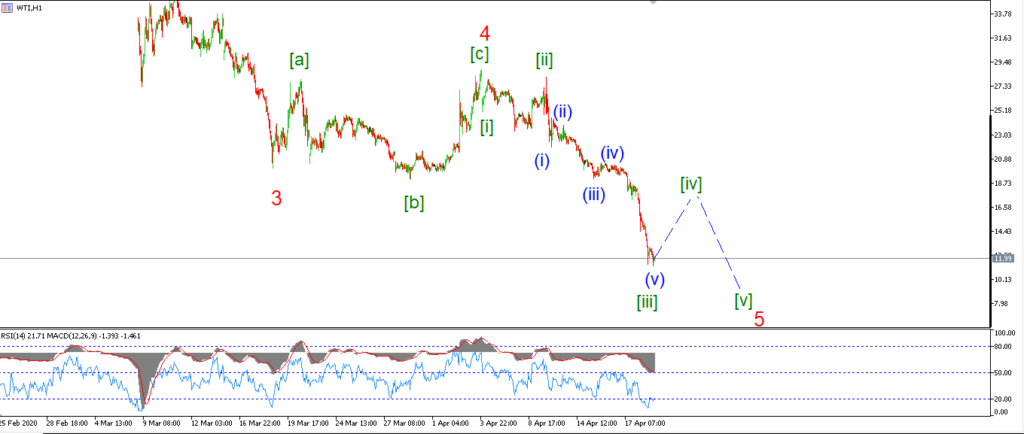
Trading has more or less halted on my derivative chart,
so the negative price for next months contract is not reflected at all.
I think it is worth zooming out a little to look at the daily chart.
I have been tracking a decline in wave (3) of [5] for the last year.
I had always though that crude would drop down below the $20 handle to complete this wave.
But now we have a new benchmark to work with!
Wave (3) should trace out a five wave pattern,
and I think todays action has achieved that!
The overall pattern in the larger wave [5],
also must trace out a five wave decline.
And we still have wave (4) and (5) left to complete there.
So there is a bounce coming in crude with a larger wave (4) green as seen on the daily chart.
This rally will likely hit the previous fourth wave high at about 31.00 again.
But I will have to wait and see how the current debacle unwinds,
before we begin tracking that wave higher.
Tomorrow;
The June contract is already trading at about 25.00,
it wont stay that high thats for sure.
The may contract expires tomorrow so we will see how the June contract reacts over the rest of the week.
I will hold off until things settle before jumping into the short term wave count again!
S&P 500.
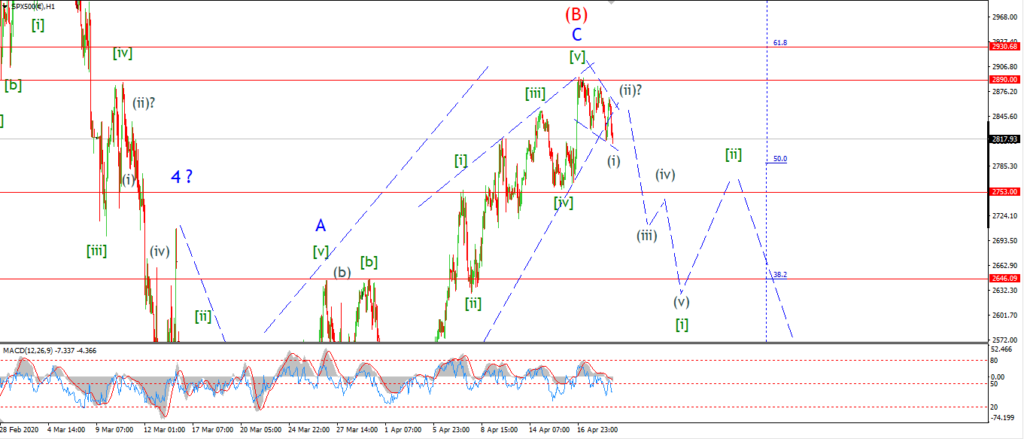
S&P 500 1hr
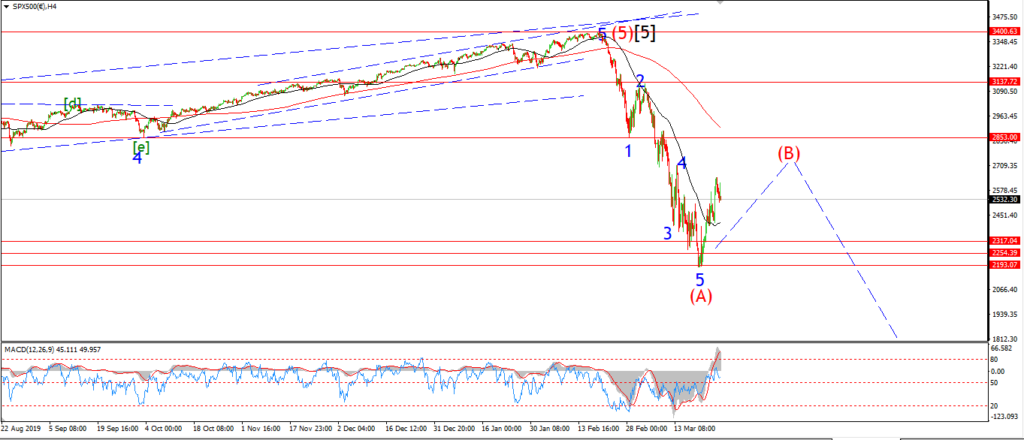
S&P 500 4hr
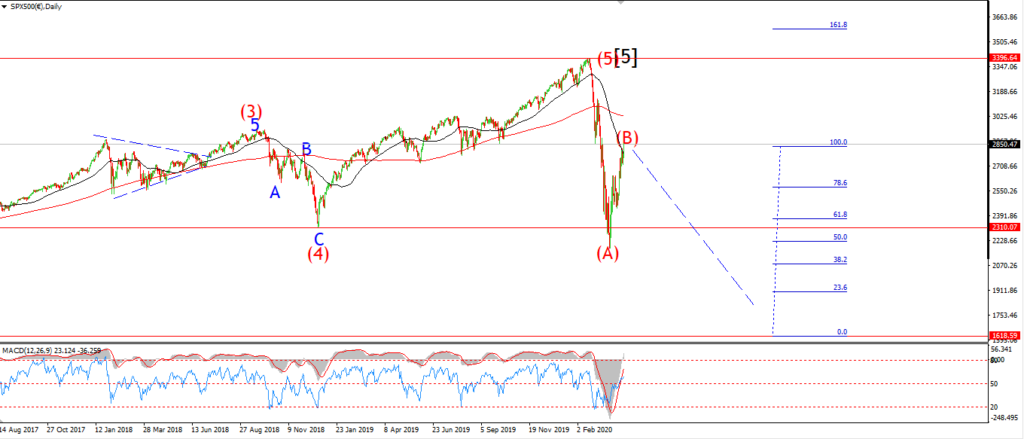
S&P 500 daily.
The S&P is showing the same developing leading diagonal off the high this evening.
This pattern is not yet complete,
if the price falls again into that lower trend line at about 2807,
that would be enough to call wave (i) done.
The market should make a lower high again in wave (ii) before accelerating lower in wave (iii) by the middle of the week.
There is a possible bearish alternate also,
this stepped pattern to the downside could be a series of 1,2 waves underway,
before dropping into a third wave down as shown.
The outcome is the same, but the internal pattern is slightly different.
Tomorrow;
The first indication that the turn down into wave (C) has begun,
will be when price breaks below the previous fourth wave at 2753 again.
Watch for a corrective lower high to develop below 2890 by Wednesday.
If the alternate pattern is correct,
then wave (iii) down will begin before Wednesday.
SILVER.
SILVER 1hr
SILVER 4hr.
SILVER daily.
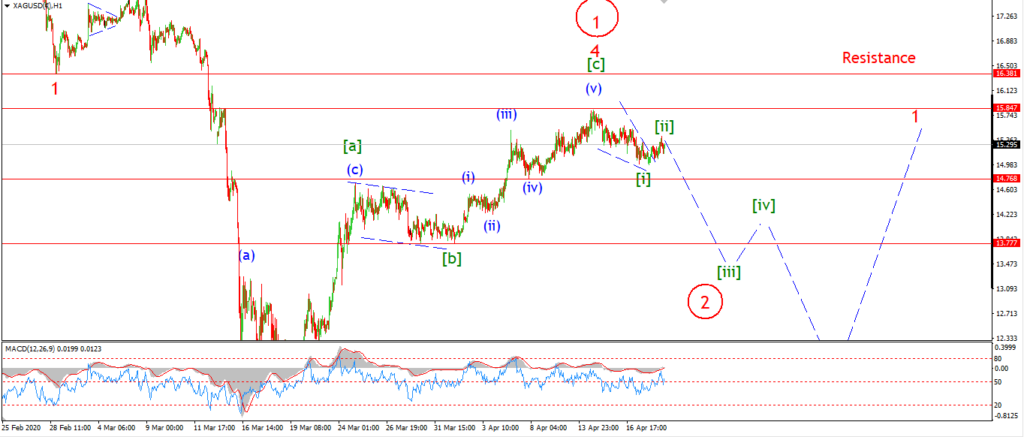
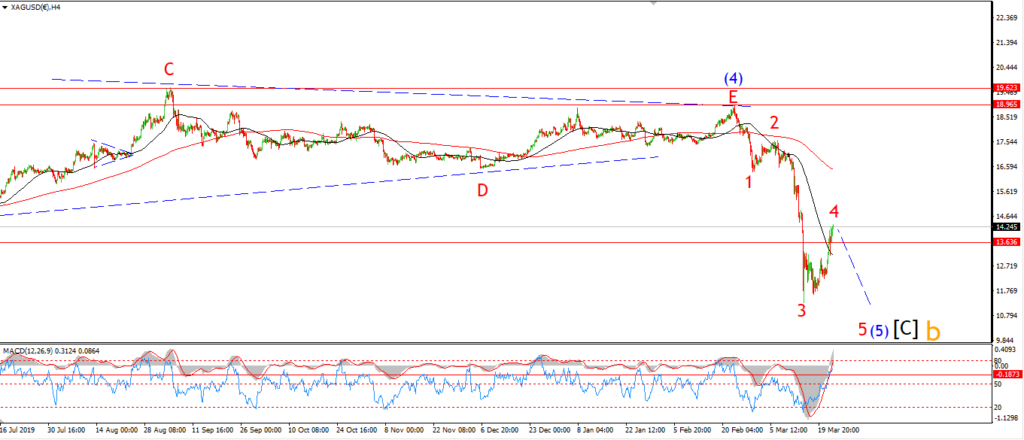
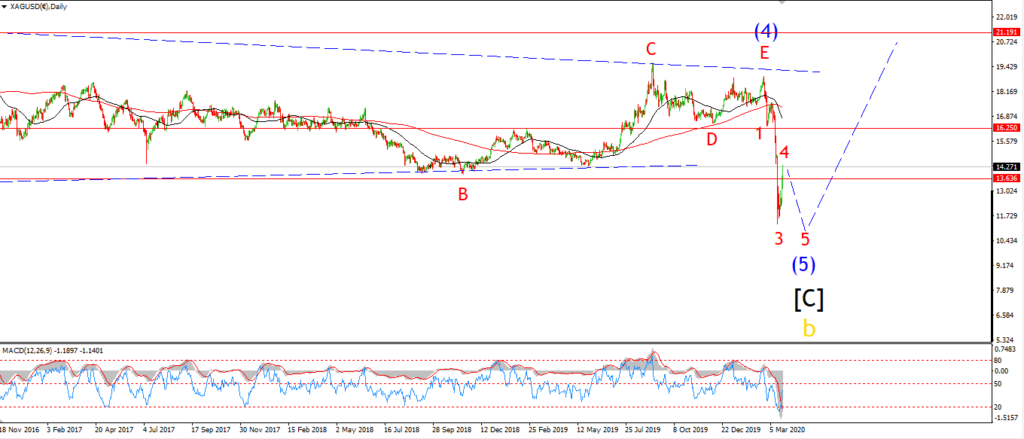
Silver us still holding on near the highs today and the action is still looking corrective.
I am looking more closely again at the alternate bullish wave count because of this.
I would still expect a further decline into initial support at about 14.00 again to complete a correction in the alternate scenario,
so I still favor the downside over the next few days in both wave counts.
Tomorrow;
watch for a decline in either wave [iii] of ‘5’,
or wave [c] of ‘2’ in the alternate count.
A break of 14.78 will indicate wave [iii] has begun.