
Good evening folks, God Bless you all tonight.
A few really interesting and shocking charts for you tonight!
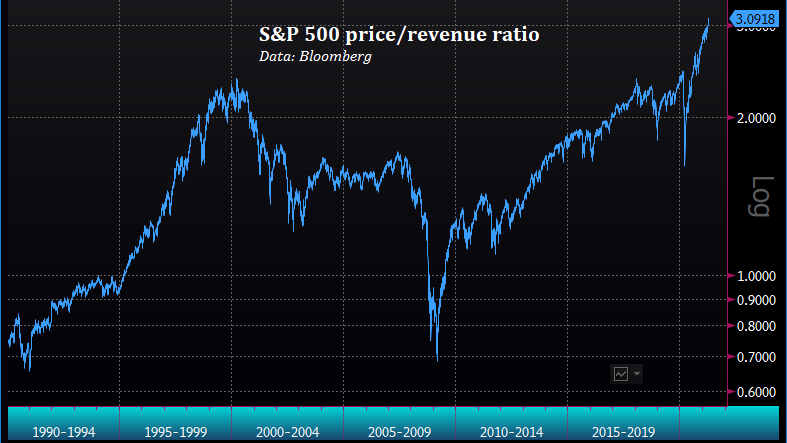
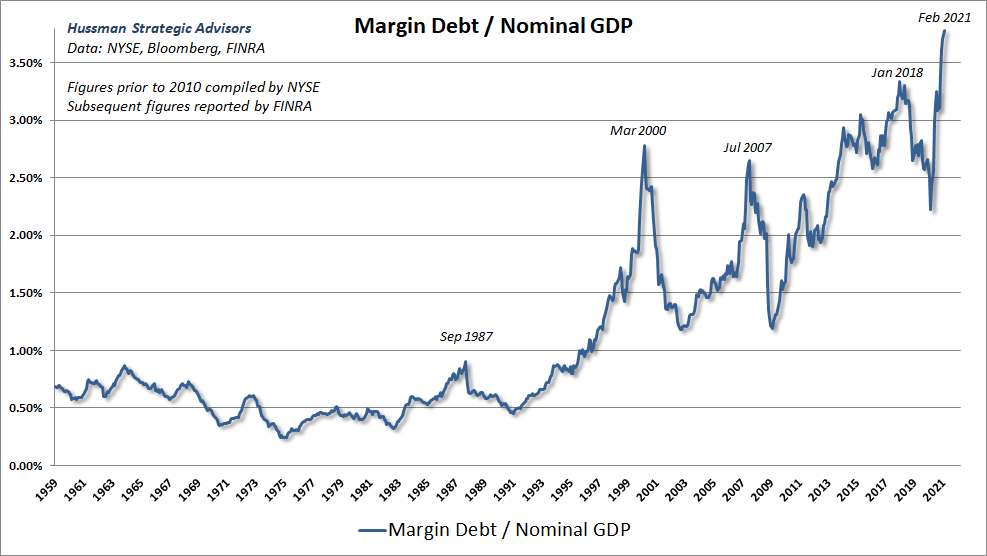
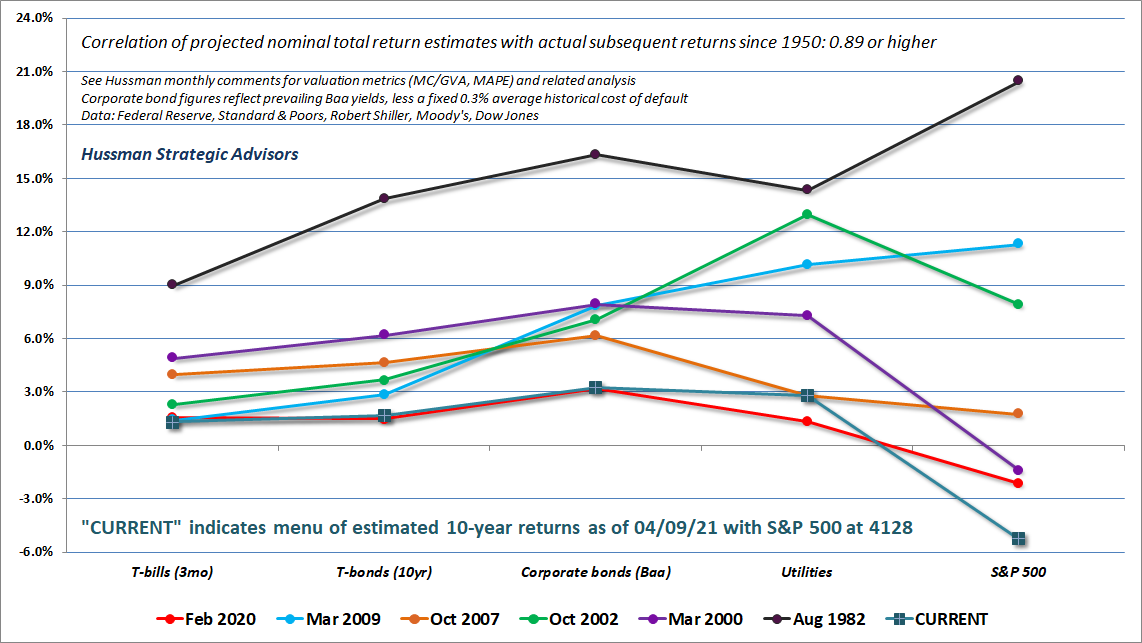
Take a few minutes and read John Hussman at his best!
EURUSD.
EURUSD 1hr.
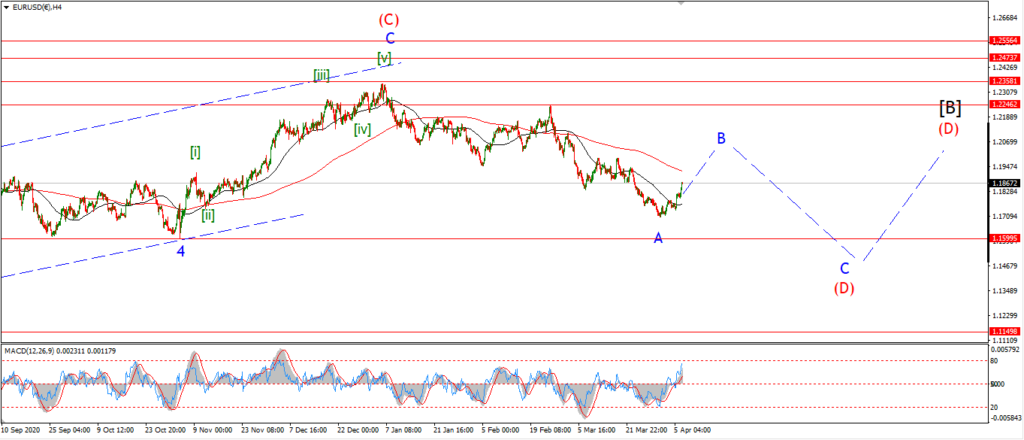
EURUSD 4hr.
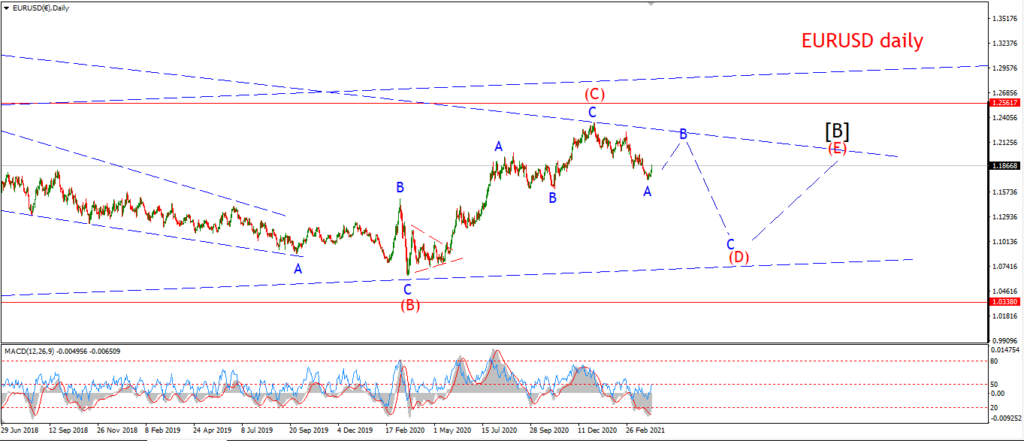
EURUSD daily.
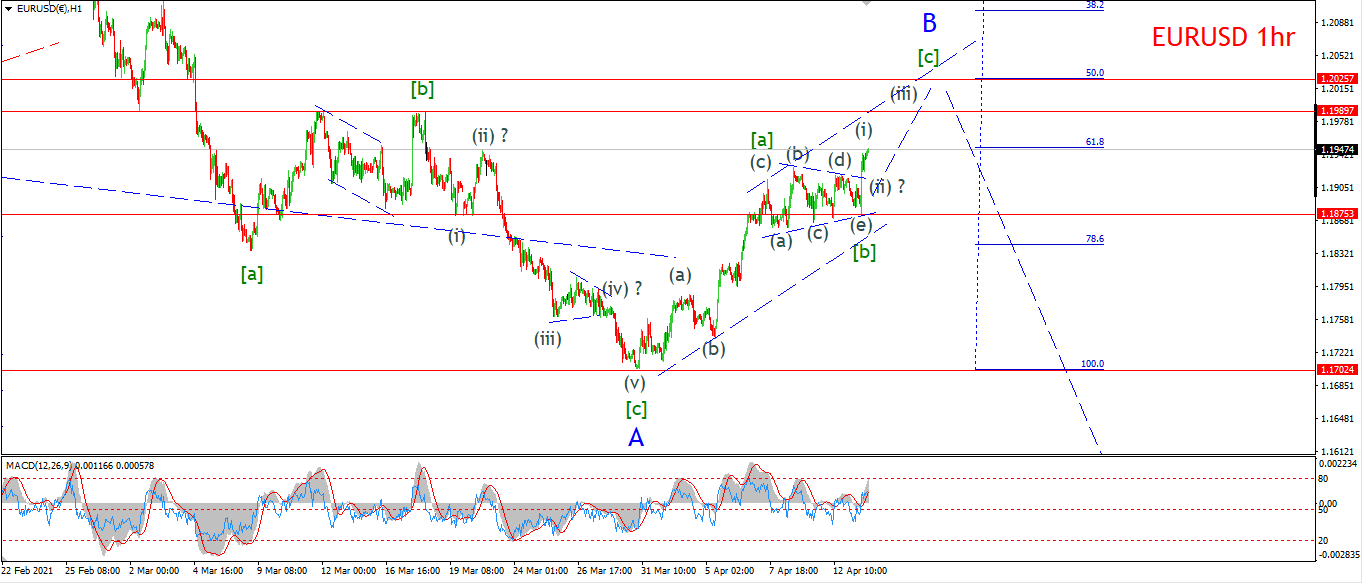
EURUSD cut short the recent correction today and spiked higher out of the session low at 1.1875.
I now think this correction in wave [b] is complete as a triangle.
And wave [c] is now underway off the low at 1.1835.
The initial target for wave [c] lies at 1.2025 where the price meets the 50% retracement level of wave ‘A’.
Tomorrow;
Watch for wave (ii) to create a higher low above 1.1875.
Wave [c] should continue higher for the rest of this week.
GBPUSD
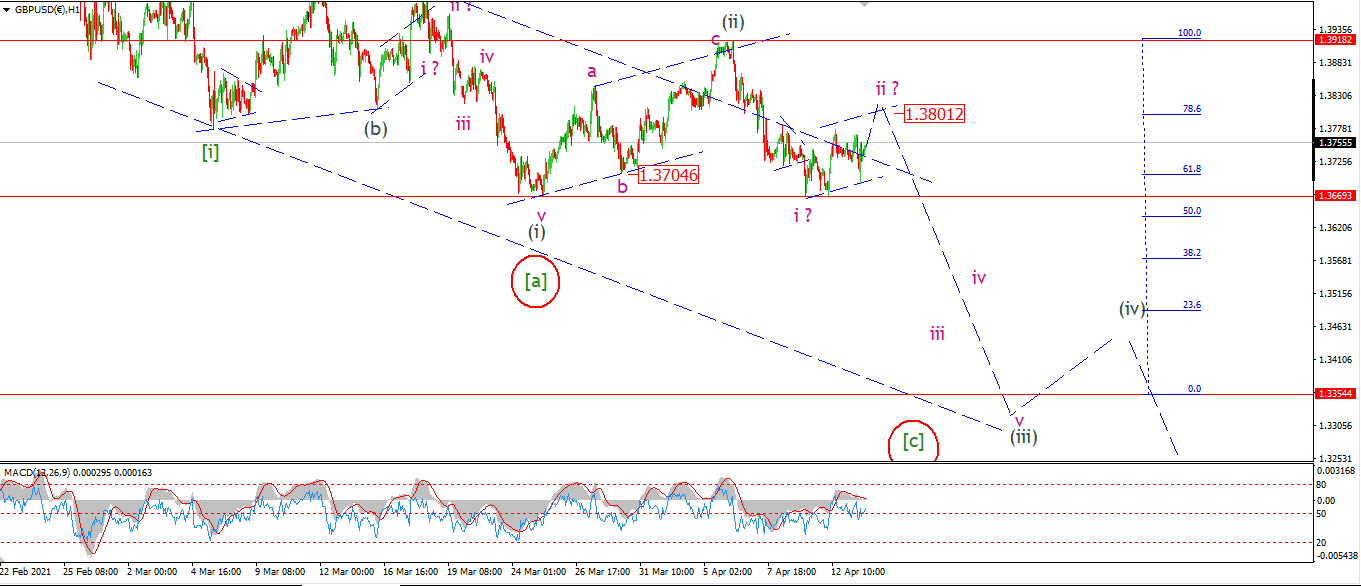
GBPUSD 1hr.
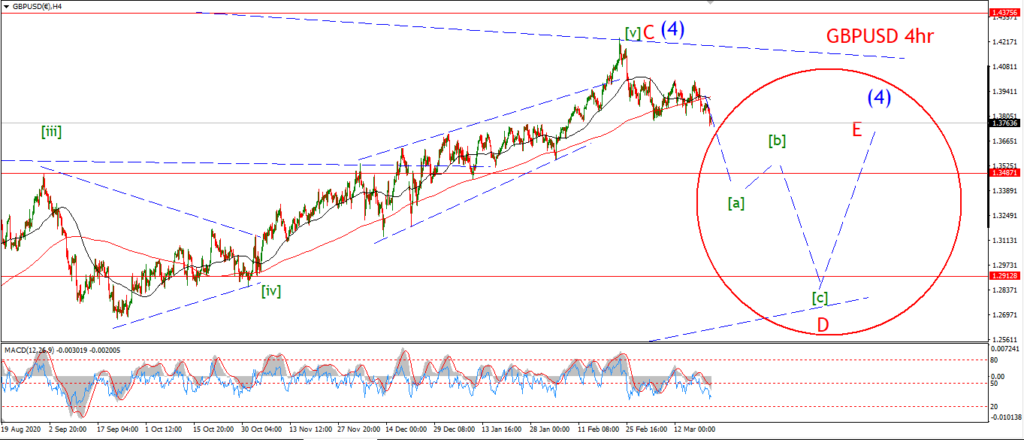
GBPUSD 4hr.
GBPUSD daily.
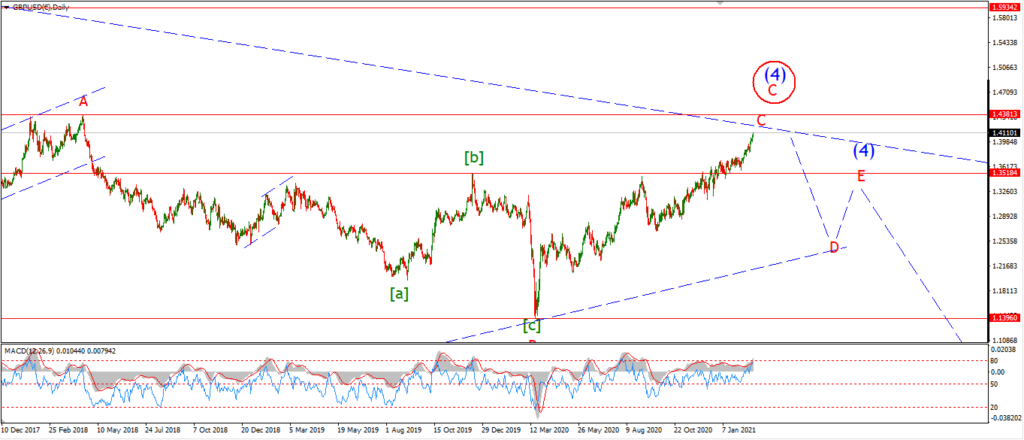
Todays small move lower off Mondays high is in three waves so far.
So at this moment,
I am viewing this move as a corrective decline within wave ‘ii’ pink.
Wave ‘ii’ should push higher tomorrow above 1.3800 and fill the small trend channel shown.
Once we hit that upper trend line again in wave ‘ii’,
then I will look for wave ‘iii’ down to begin.
Tomorrow;
Watch for wave ‘ii’ to fill the trend channel and complete at about 1.3800.
wave ‘iii’ down will be confirmed with a break of 1.3670 again.
USDJPY.
USDJPY 1hr.
USDJPY 4hr.
USDJPY daily.
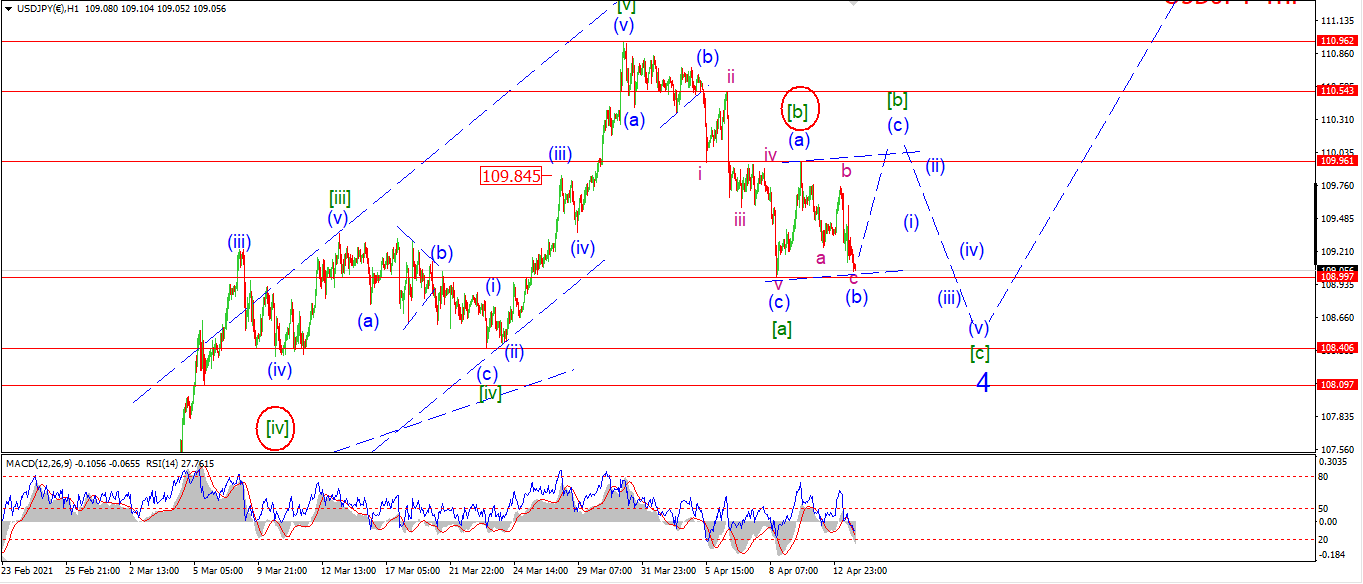
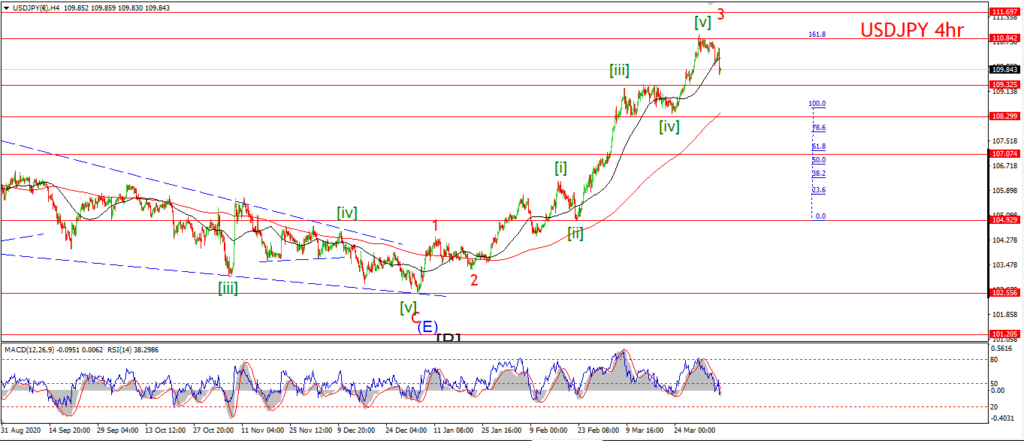
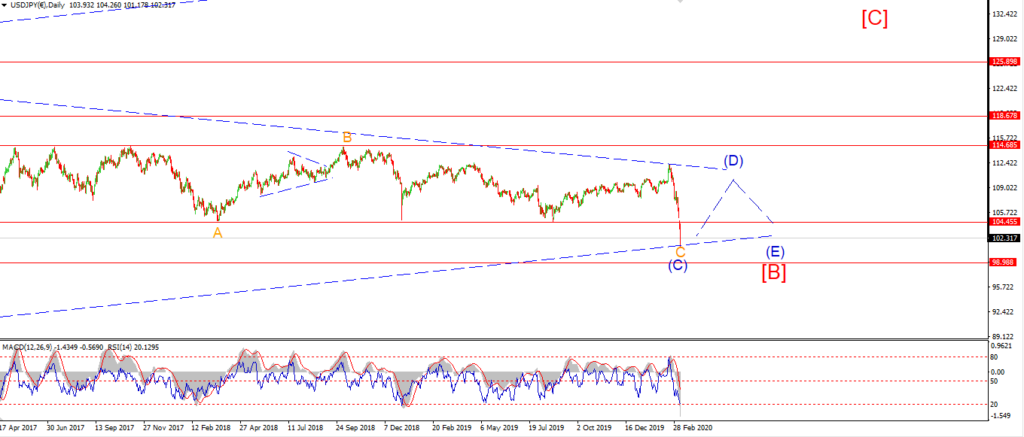
Wave [b] is going to take another few sessions to complete going on todays action.
The price is still sitting at a higher low above the wave [a] low this evening.
even if the price breaks 108.99 in wave (b),
I think we can still expect wave (c) to rally back above 109.96 at the wave (a) high to complete an expanded flat correction in wave [b].
Tomorrow;
Watch for wave (b) to finally find a low now or with a small break of 108.99.
Wave (c) should begin tomorrow.
A decline into 108.40 will signal wave [c] is already underway.
DOW JONES.
DOW 1hr.
DOW 4hr
DOW daily.
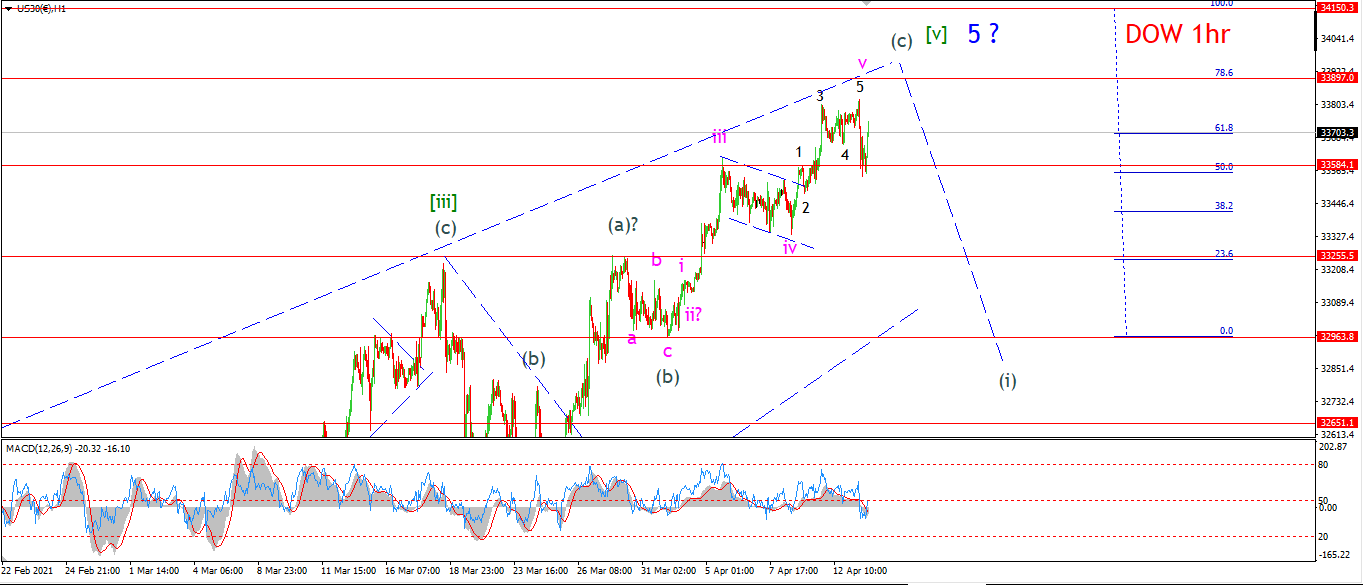
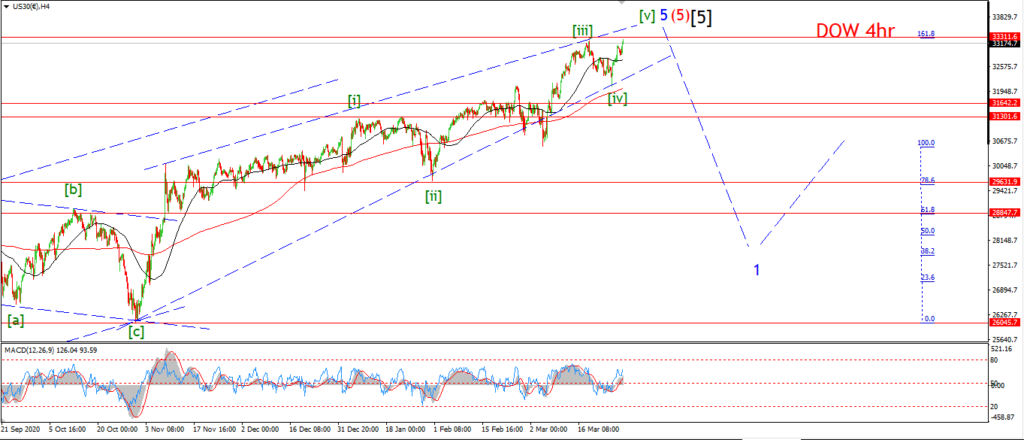
The DOW dropped back below the wave ‘1’ high today,
and with that it seems the five wave pattern shown in wave ‘v’ is now complete.
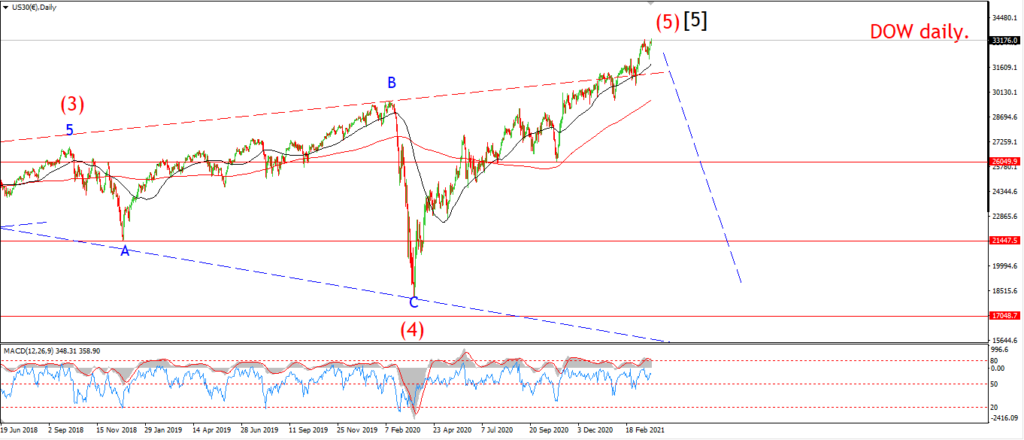
Todays decline can be viewed as the beginning of something much bigger if the short term count is correct,
but it is way too early to read anything into todays spike lower.
The only way we can get constructive to the downside from here is if we a full retracement of the wave (c) rally.
And a break of the wave (b) low at 32960 again.
Wave (i) down should be followed by a clear corrective lower high in a second wave.
I will just have to wait and see on this front.
Tomorrow;
Lets see if the price makes any further progress lower.
33250 marks a high at wave [iii] and wave (a),
so that level is a supportive pivot at the moment.
It would be pretty interesting to get an impulsive decline below that level.
GOLD
GOLD 1hr.
GOLD 4hr.
GOLD daily.
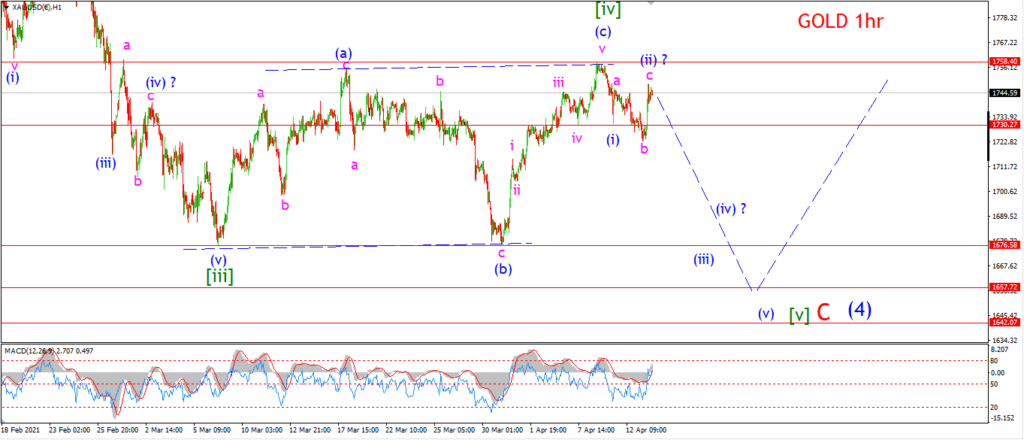
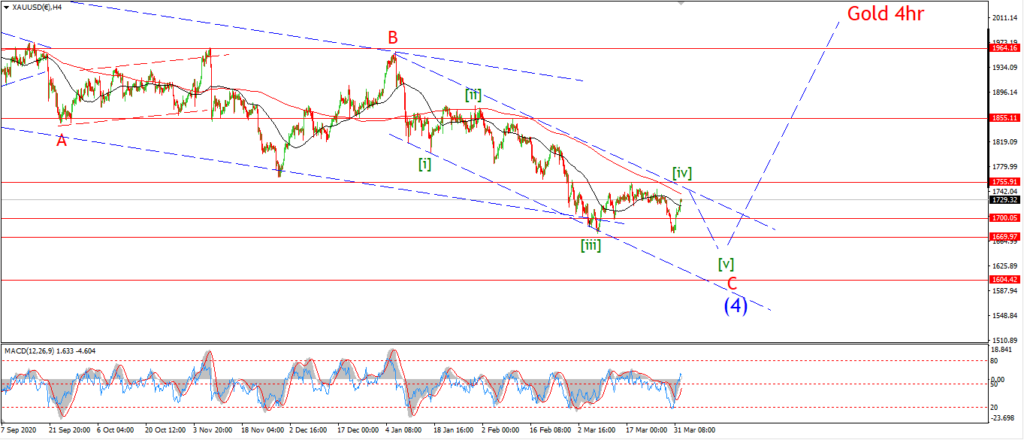
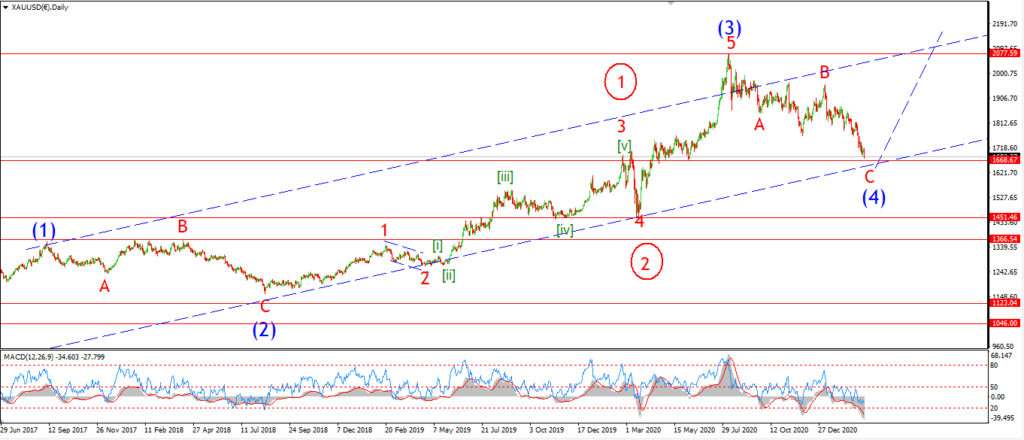
The action off the top of wave [iv] is not ideal right now.
I can label todays spike rally as wave ‘c’ of (ii) and that is legitimate for the moment.
Wave (ii) is now an expended flat according to this count.
My only bug is that I do not like the proportion of wave ‘b’ to ‘a’.
If this short term count is correct,
then wave (iii) will begin tomorrow and fall sharply below 1700 in quick succession.
Tomorrow;
Watch for wave (ii) to hold below the wave [iv] top and accelerate lower tomorrow,
that will signal wave (iii) has begun.
CRUDE OIL.
CRUDE OIL 1hr.
CRUDE OIL 4hr.
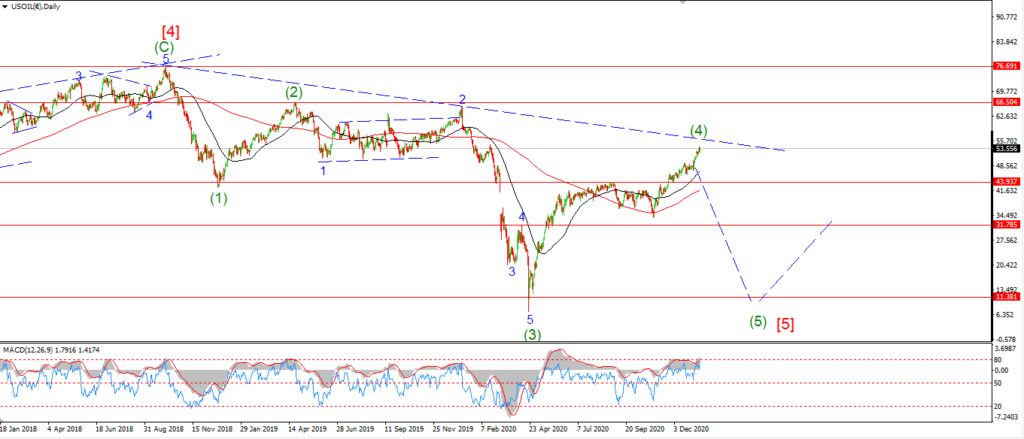
CRUDE OIL daily.
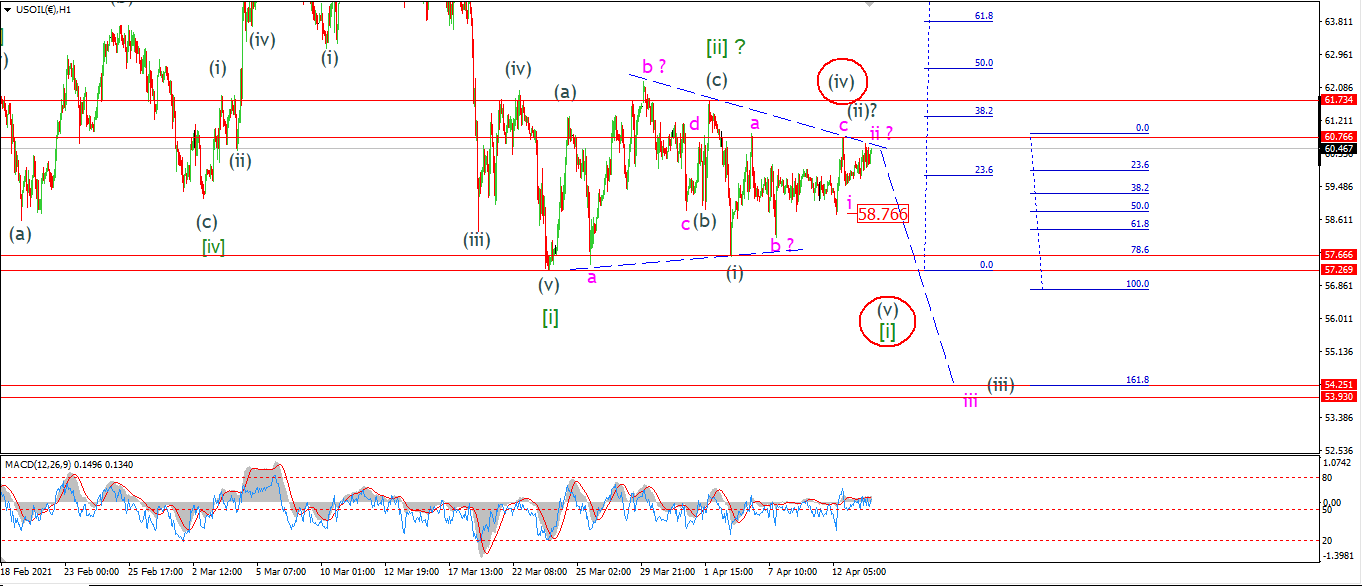
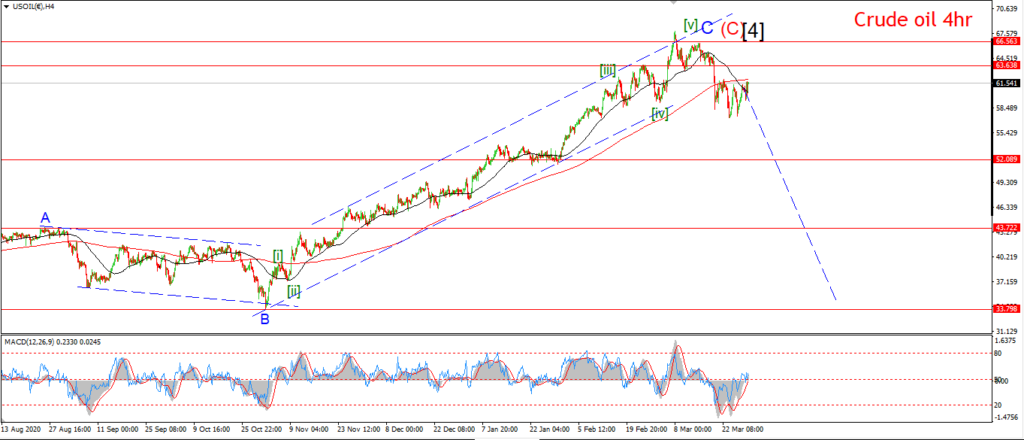
At this point in the pattern,
after an extended sideways move,
it is now a matter of do or die for crude oil!
The price should fall in either wave ‘iii’ of (iii) of [iii].
Or,
fall in wave (v) of [i].
Either way this correction has gone on for long enough now.
If the alternate count is correct,
then there is very little room for error here.
A break of 60.76 will rule out the triangle ide in wave (iv).
In the main wave count,
we can allow of r a small rise above that level,
but wave (ii) must hold below 61.73 at the very upper limit.
Tomorrow;
The price must fall below 57.66 in both counts in order to confirm that the correction is over.
watch for a break of 58.76 as a first signal that wave ‘iii’ is underway.
S&P 500.
S&P 500 1hr
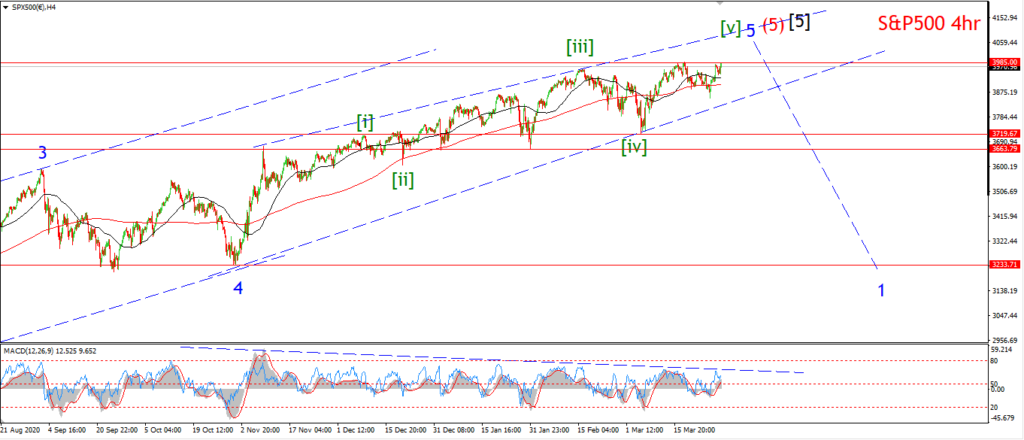
S&P 500 4hr
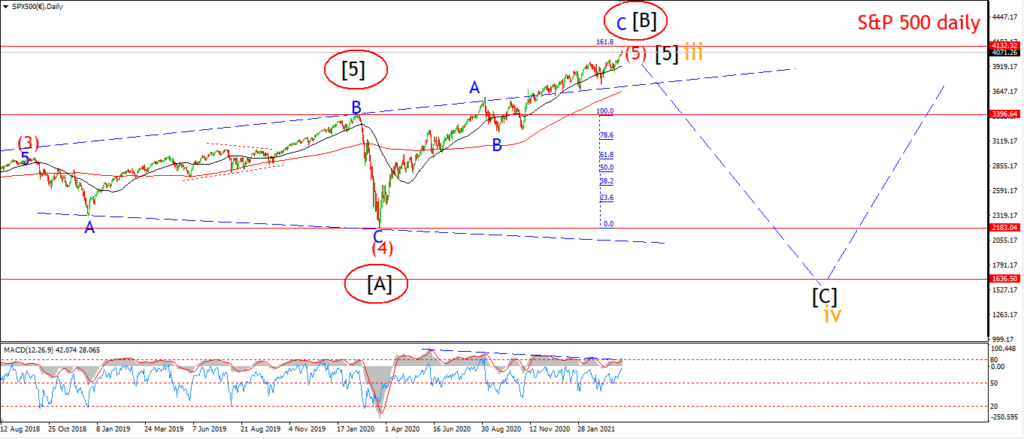
S&P 500 daily.
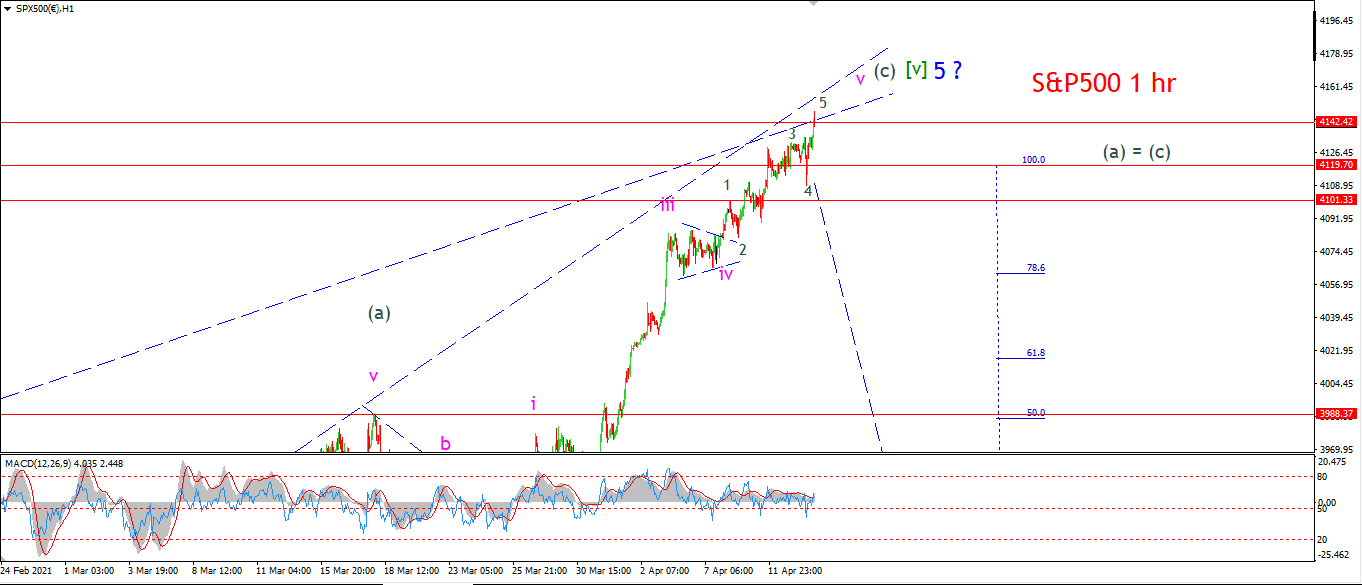
Well we have a new high again tonight and I am running out of labels to use now!
Wave ‘v’ has traced out a possible five wave structure out of the triangle wave ‘iv’ which completed last Wednesday.
Wave ‘5’ of ‘v’ tonight is a straight up spike to a new all time high.
This could be viewed as an exhaustion spike to complete a fifth wave,
and if we get a reversal pattern beginning tomorrow,
that will add weight to this view.
We now have broken above one of the two trend lines that have been attracting the price over the last week.
And the upper trend channel line is just above the price.
This is the channel surrounding wave [v] green.
And wave (c) is [v] is just about to hit that line.
Tomorrow;
Exhaustion is what I see developing here.
this rally has been extreme in wave [v],
and I think this market will break down in an equally extreme fashion.
Watch for wave (c) of [v] to find fill the trend channel and then reverse off the top.
SILVER.
SILVER 1hr
SILVER 4hr.
SILVER daily.
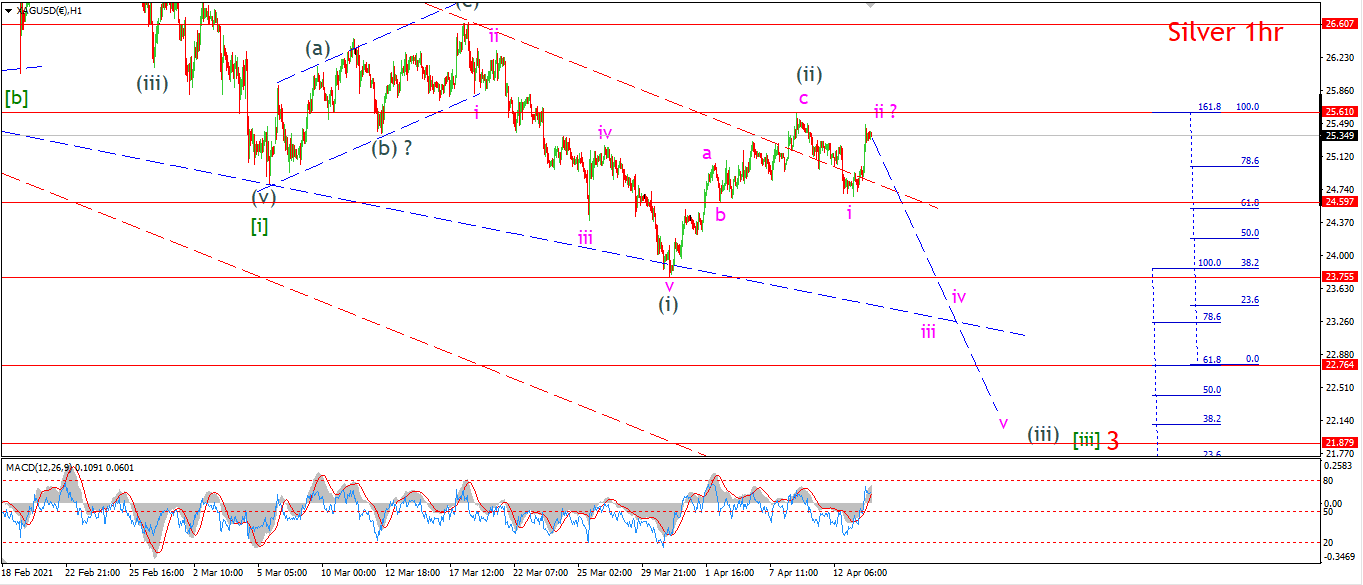
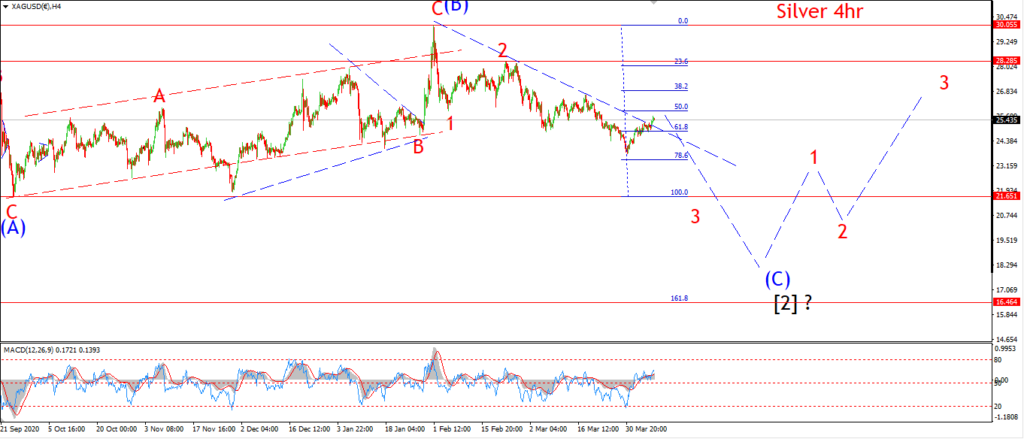
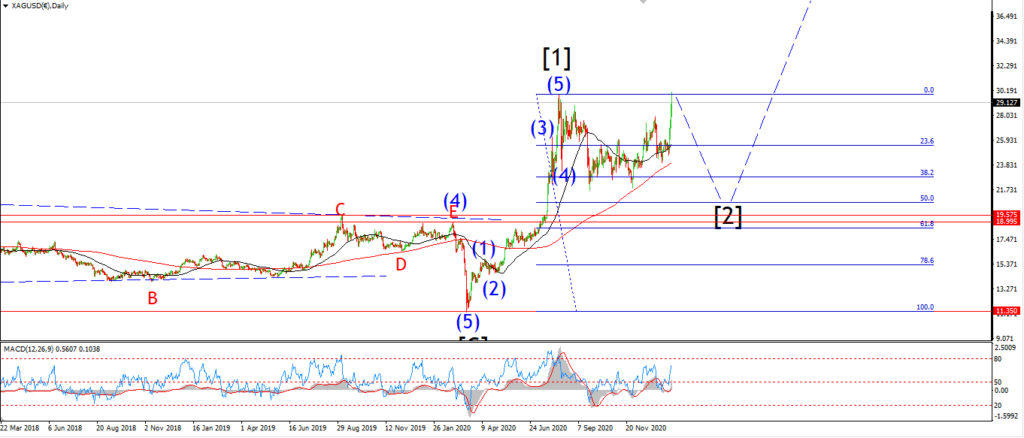
I have to question the idea that this evenings high is wave ‘ii’ as shown now.
It is very close to breaking the 100% retracement of wave ‘i’ pink this evening.
If that level at 25.60 does break,
then I will have to revert to wave (ii) again.
Tomorrow;
The price must decline from here to begin wave (iii) down.
A break of 24.59 again will signal wave (iii) has begun.
BITCOIN
BITCOIN 1hr.
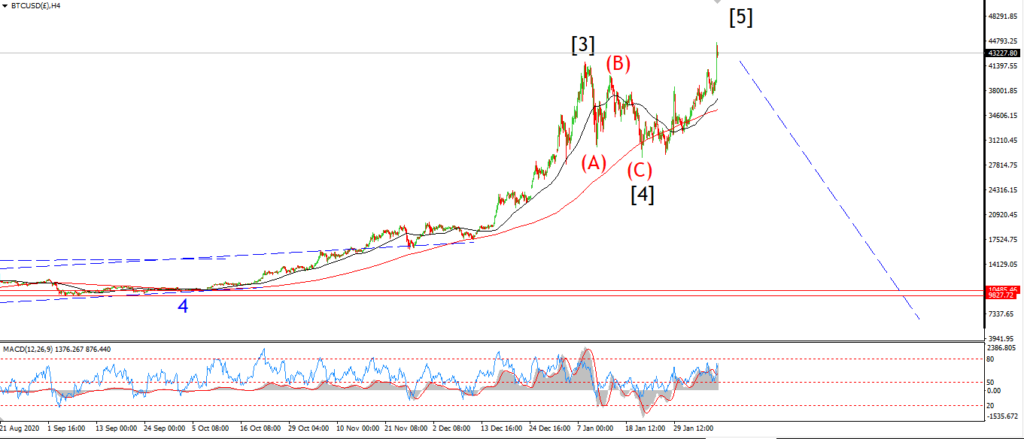
BITCOIN 4hr.
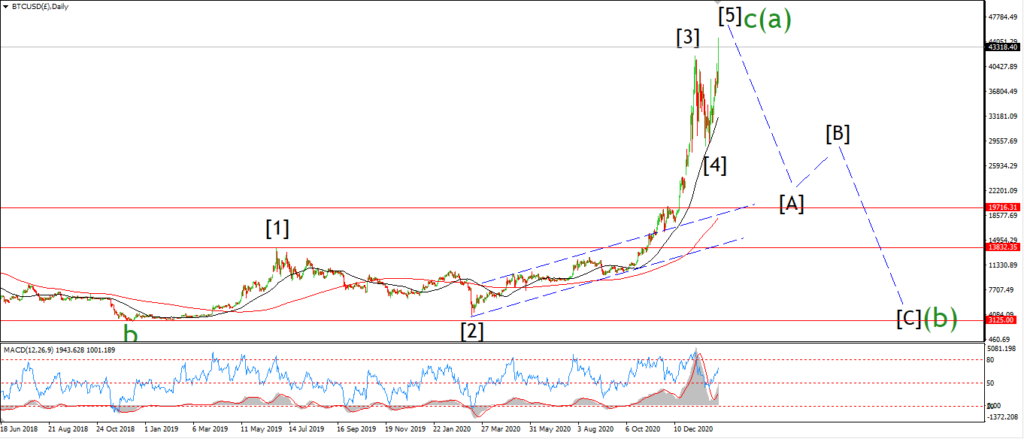
BITCOIN daily.
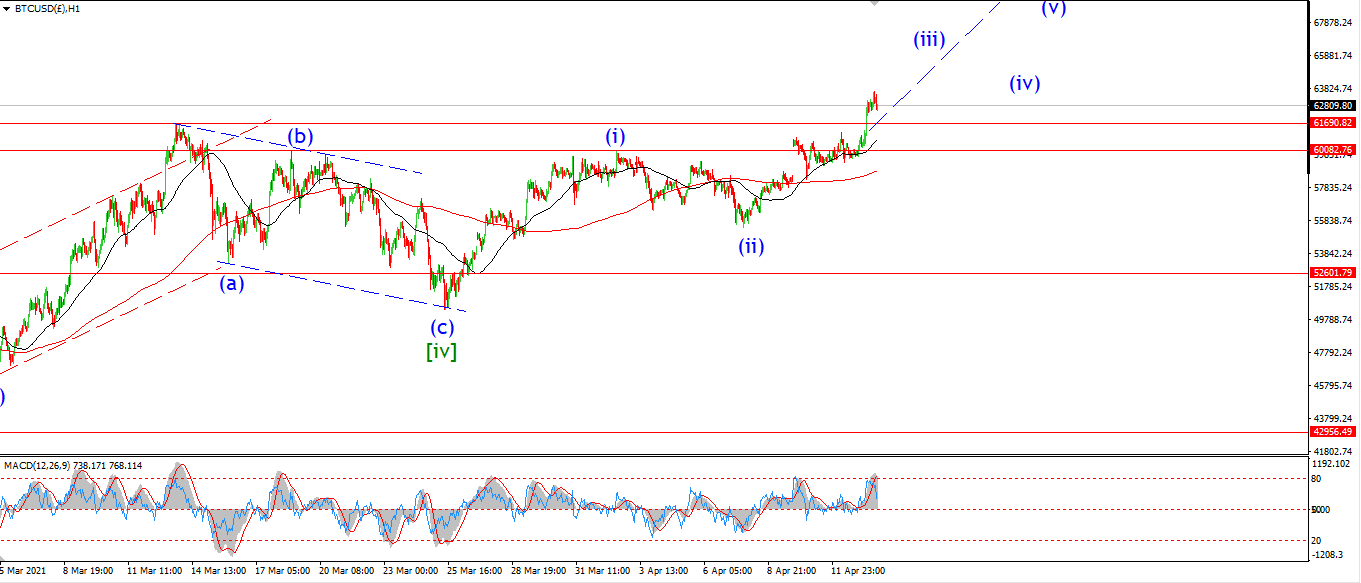
Topping in wave (a).
FTSE 100.
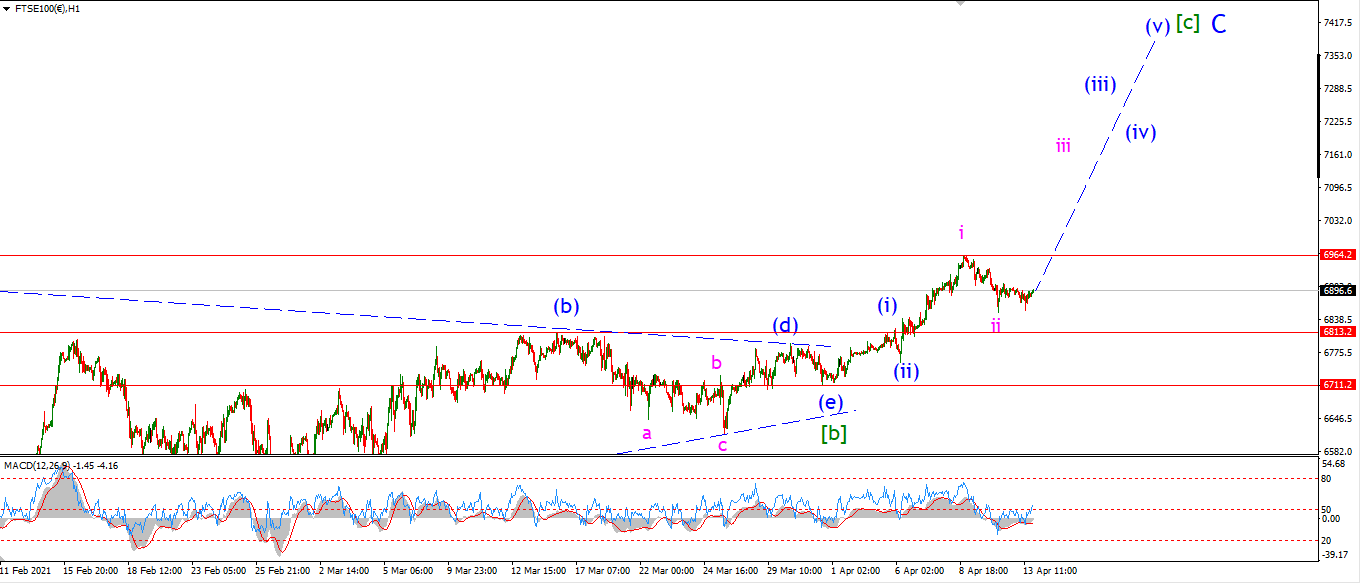
FTSE 100 1hr.
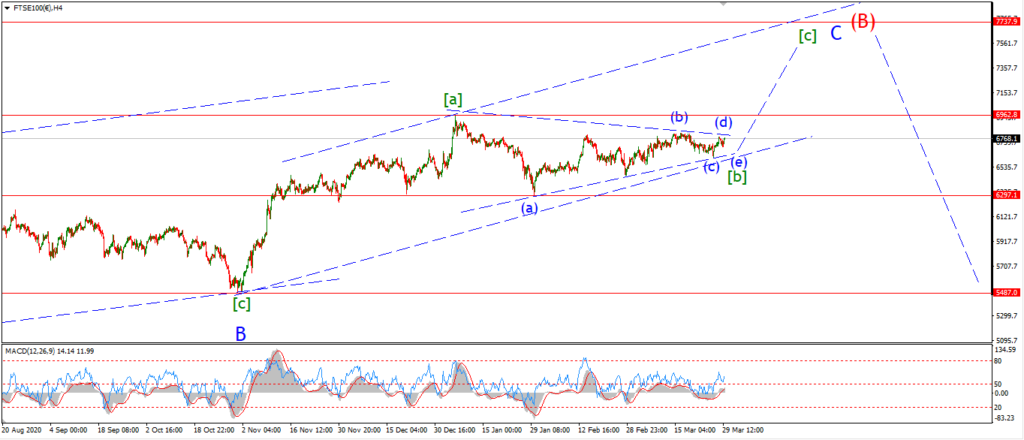
FTSE 100 4hr.

FTSE 100 daily.
Completing a fourth wave.
DAX.
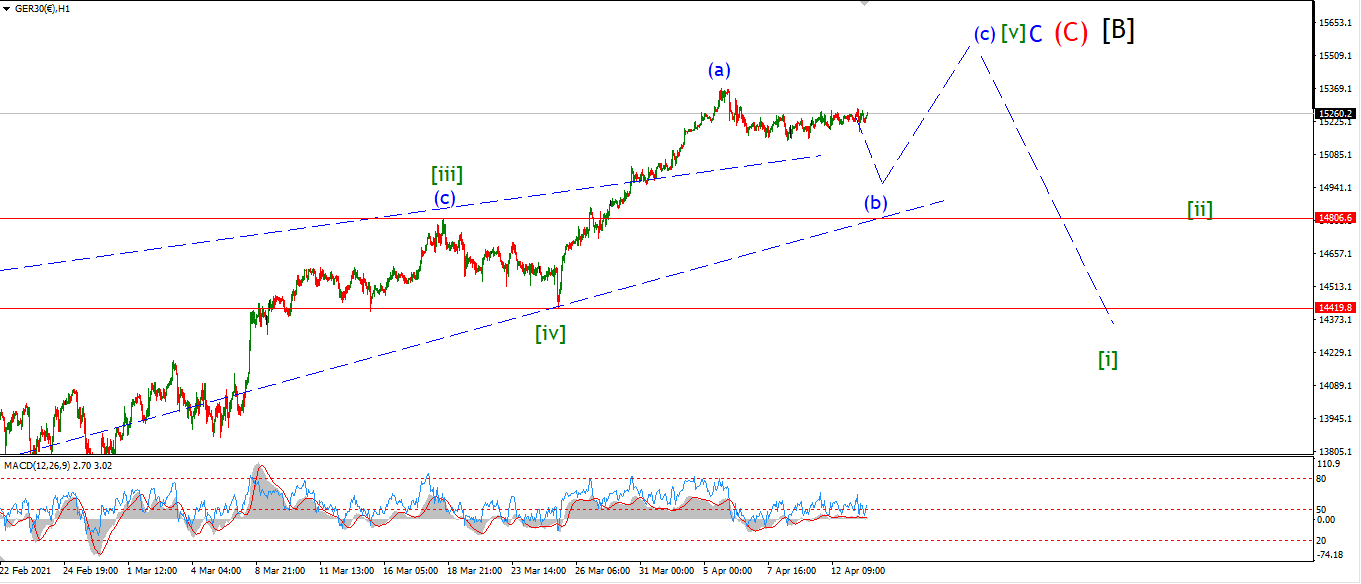
DAX 1hr
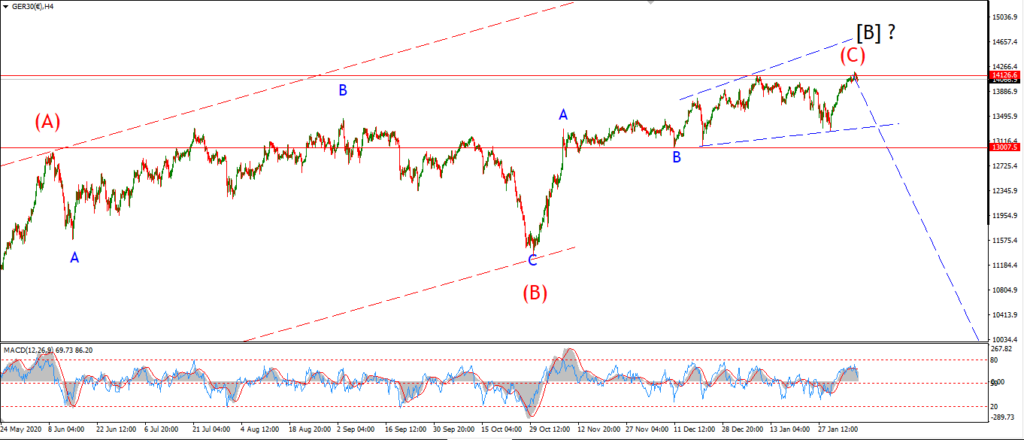
DAX 4hr
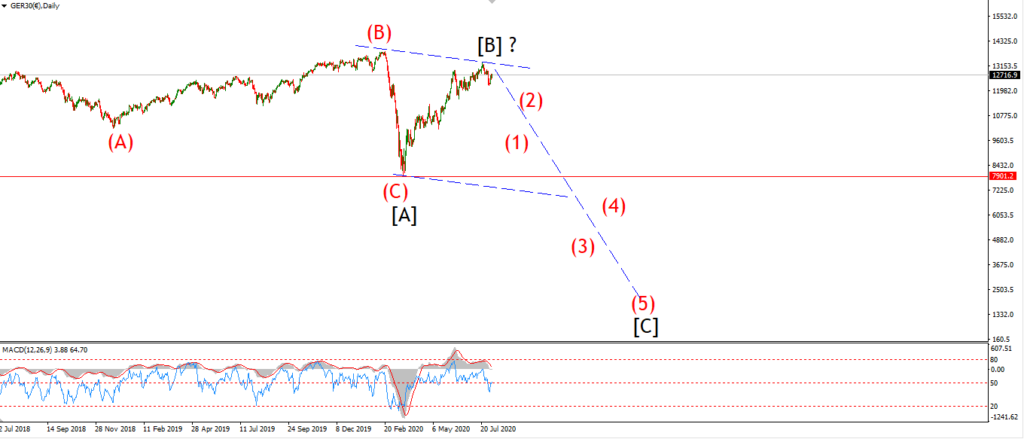
DAX daily.
Topping out in wave [B].
NASDAQ 100.
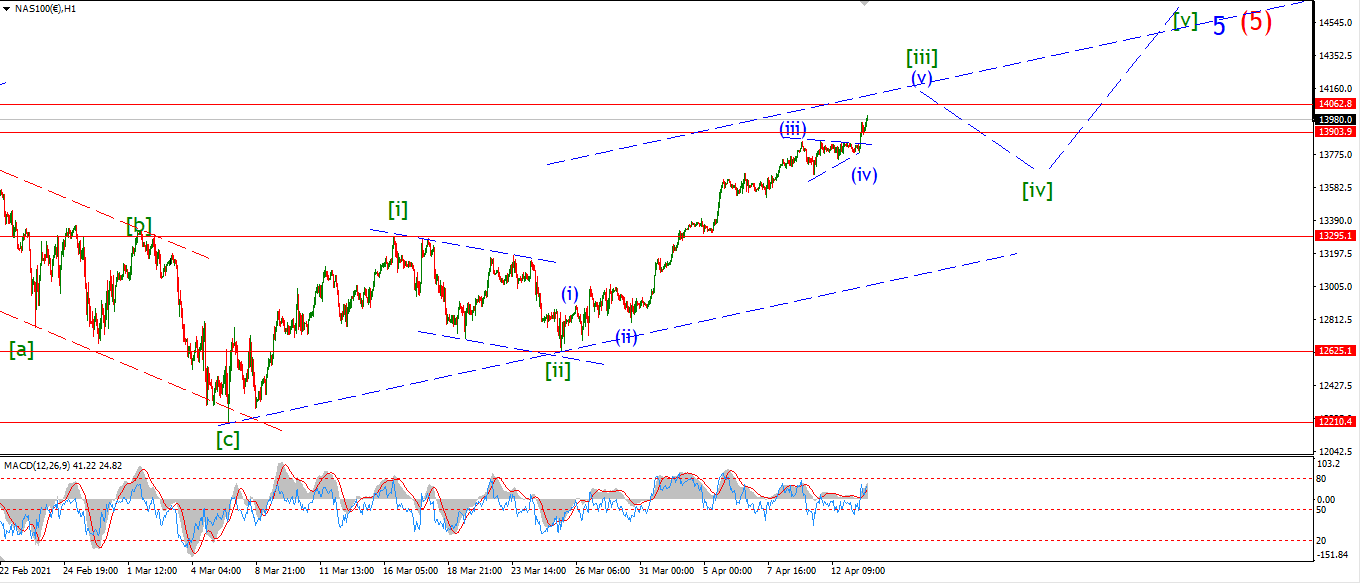
NASDAQ 1hr
NASDAQ 4hr.
NASDAQ daily.
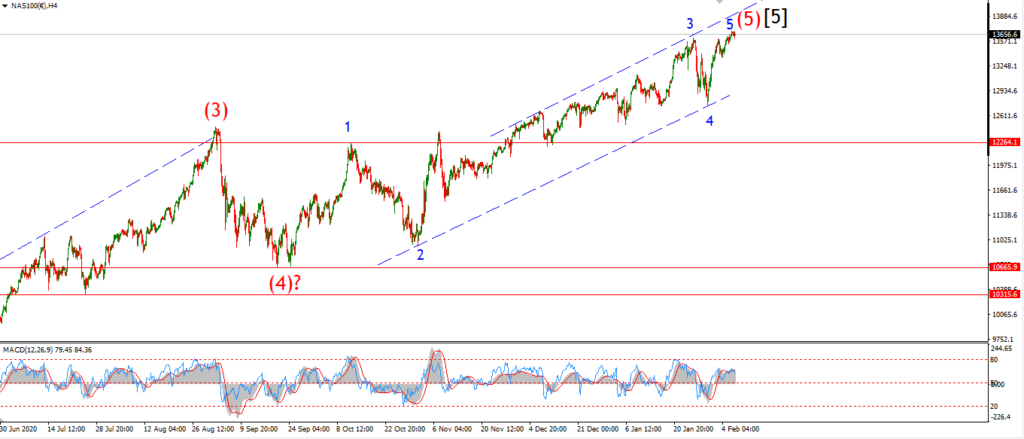
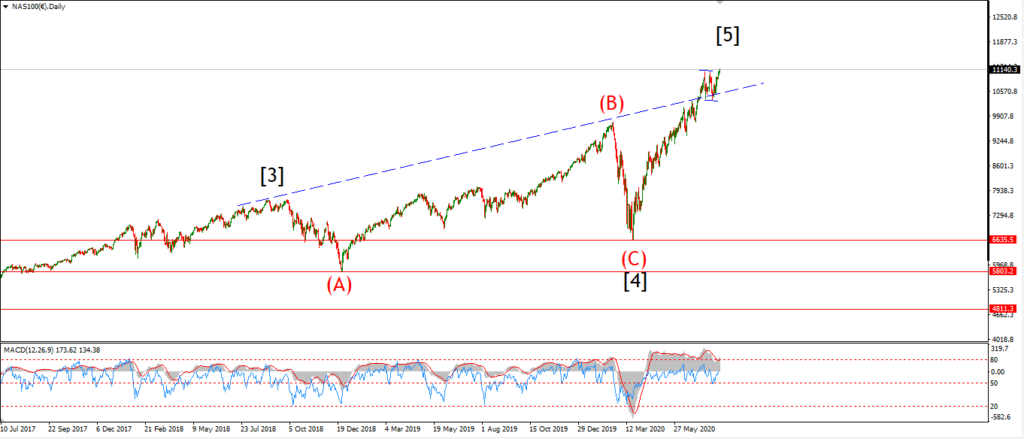
Topping out at all time high.