
Good evening folks, the Lord’s Blessings to you all.
https://twitter.com/bullwavesreal
EURUSD.
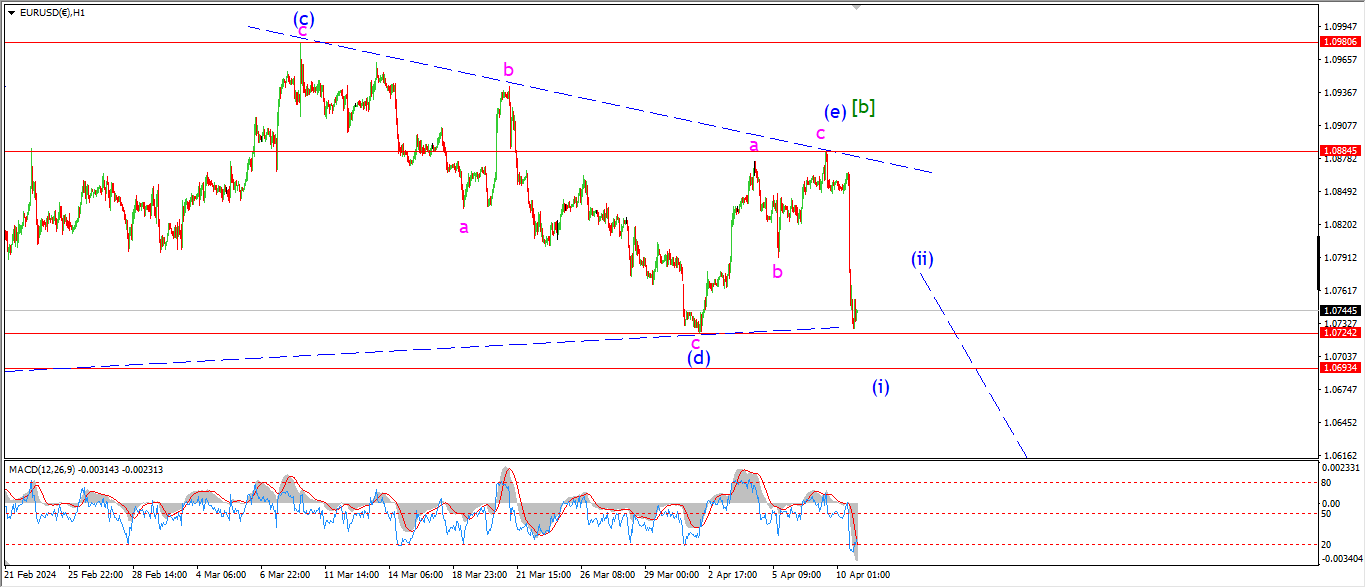
EURUSD 1hr.
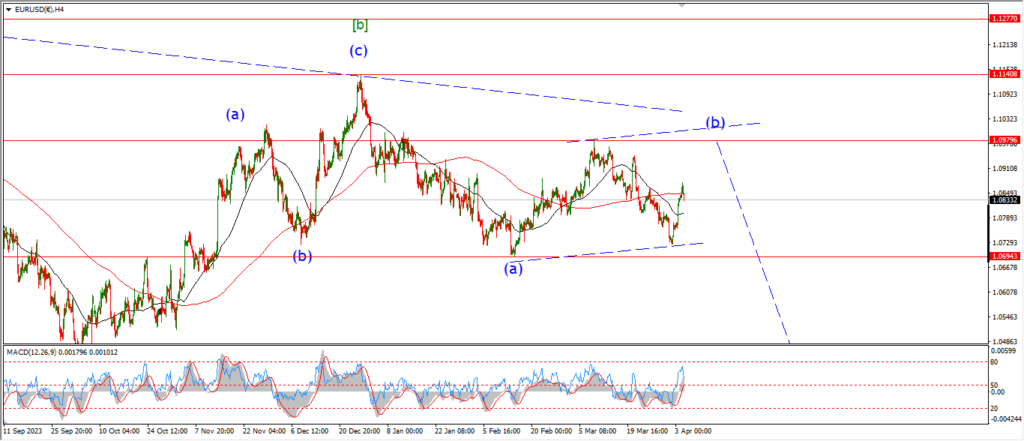
EURUSD 4hr.
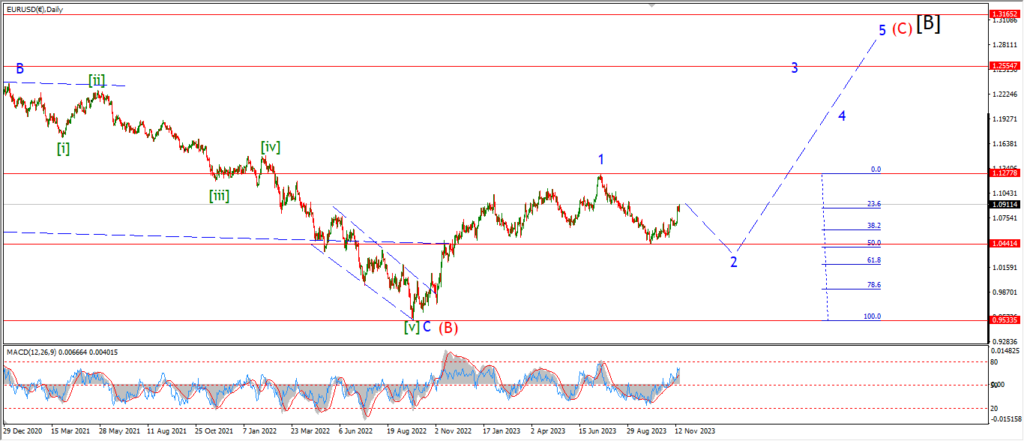
EURUSD daily.
Ok,
there is another change to look at tonight and I realize this is annoying,
but stick with me and I think you will see the idea.
4hr chart;
I am switching to a triangle wave [b] of ‘2’ tonight.
The price action over the last few months has contracted sideways
and the action this week may have completed wave (e) of [iv].
The price moved sharply lower today,
and that is very far off the pattern I was working on.
If wave [b] completed at the highs today,
then we can expect wave [c] to continue lower in five waves from here.
And that should bring this market back below 1.0450 in wave [c] of ‘2’ as shown.
Tomorrow;
Watch for wave (i) and (ii) to form a lower high below 1.0880 later this week,
and then wave (iii) of [c] will drop back into the 1.05 area in five waves next week.
GBPUSD
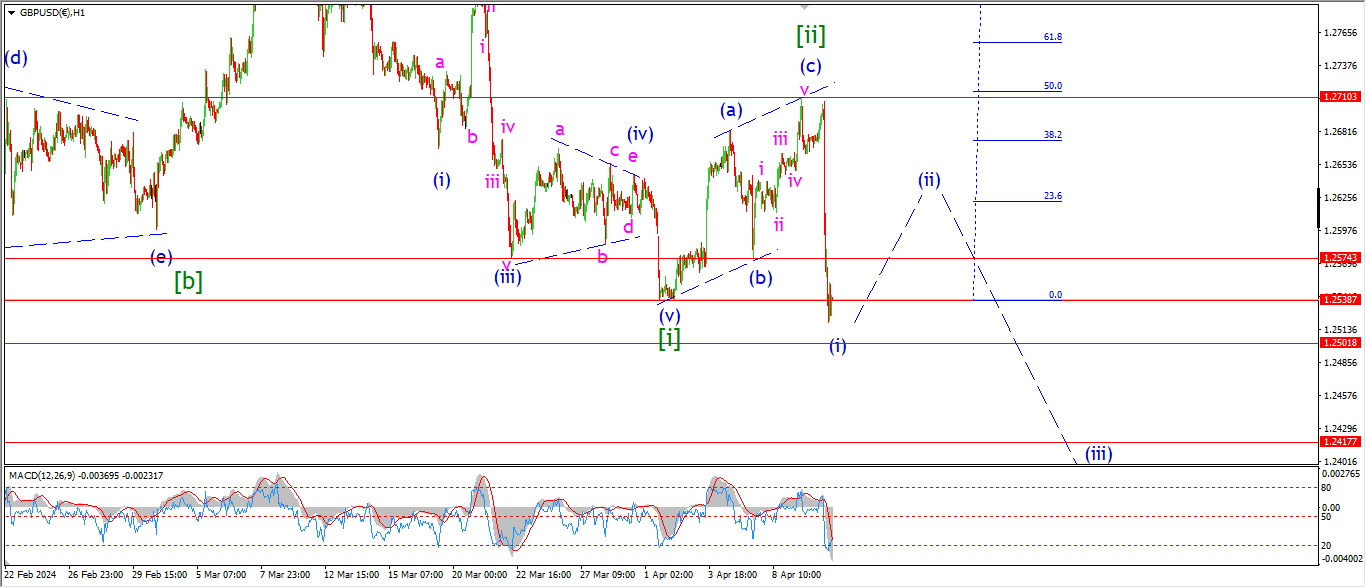
GBPUSD 1hr.
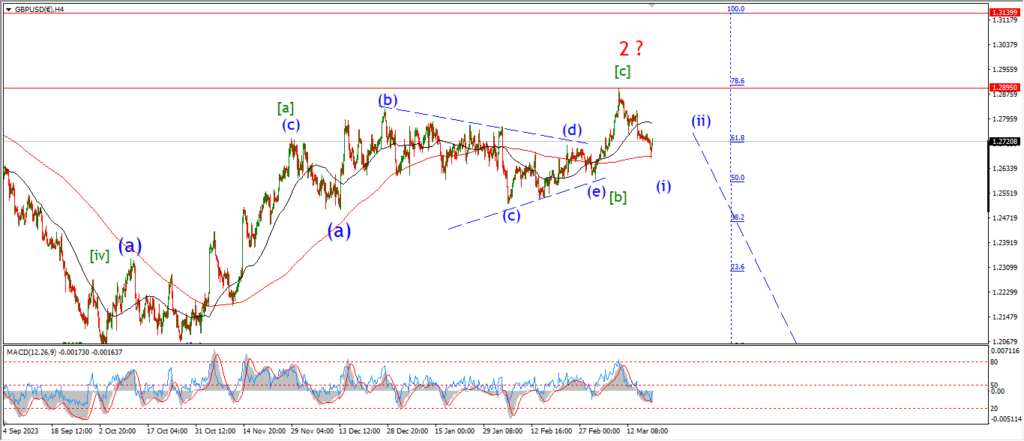
GBPUSD 4hr.
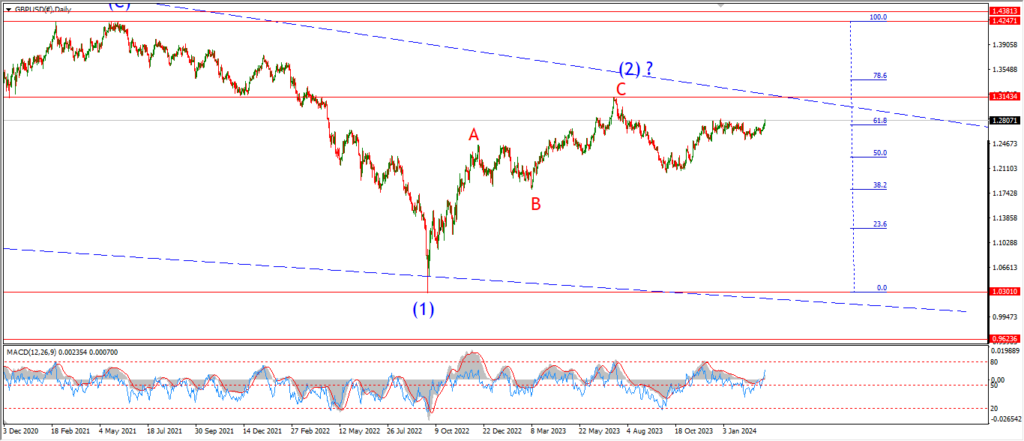
GBPUSD daily.
Cable proved that wave [ii] count correct today.
The price fell sharply to break the previous wave [i] low at 1.2538 again.
and now we have a potential wave [iii] underway.
The low of the session takes the wave (i) label.
And wave (ii) of [iii] should correct higher from here.
A three wave correction higher in wave [ii] should top out at the 1.2600 handle again
And next week will bring a larger acceleration lower in wave (iii) of [iii] as shown.
Tomorrow;
Watch for wave (ii) to begin to move higher in a corrective manner,
and wave (ii) must complete below that wave [ii] high at the very top end.
USDJPY.
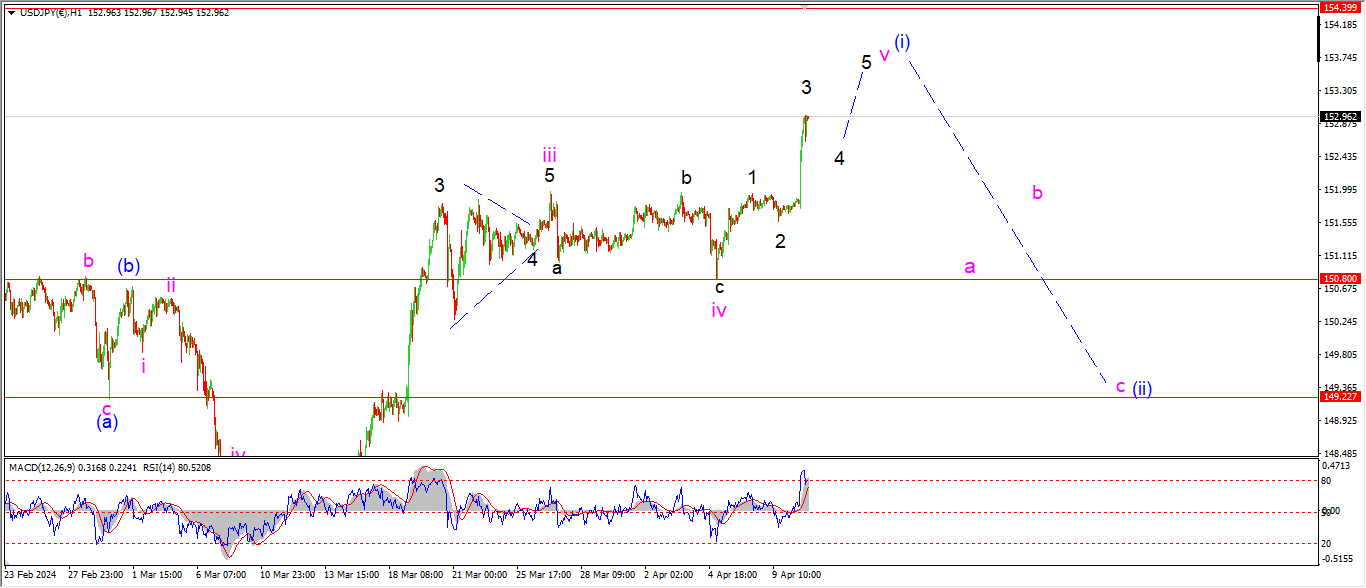
USDJPY 1hr.
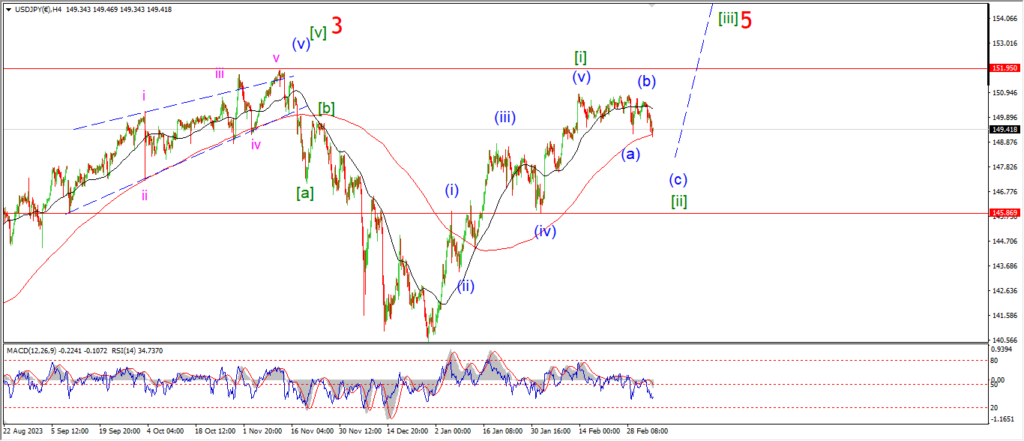
USDJPY 4hr.
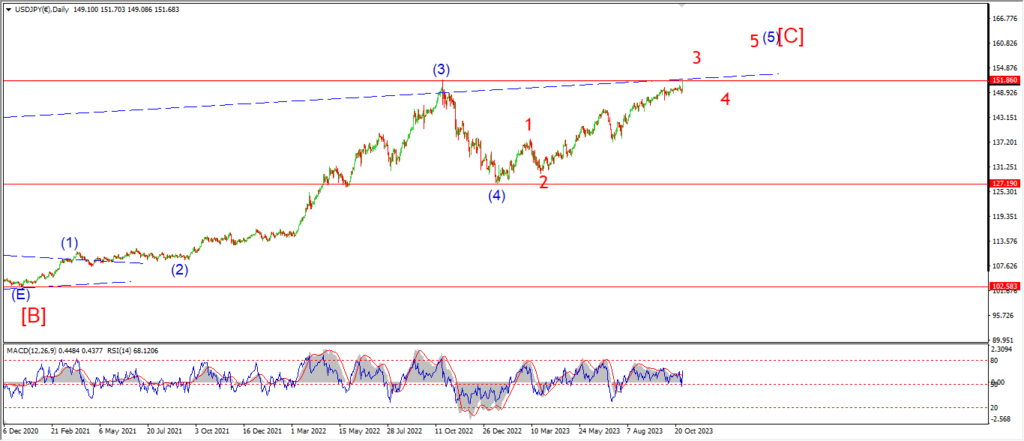
USDJPY daily.
Wave ‘3’ of ‘v’ turned sharply higher in line with the main count today.
Wave ‘v’ has hit a new high for the pattern now after a three wave rally.
and we should see a five wave pattern in wave ‘v’ top out near 153.50.
this will bring to a close the larger wave (i) pattern.
and then we can look for a correction lower into wave (ii) next week if all goes well.
Tomorrow;
Watch for wave ‘v’ of (i) to trace out a five wave pattern as shown.
and we should see a top in wave ‘v’ later this week.
DOW JONES.
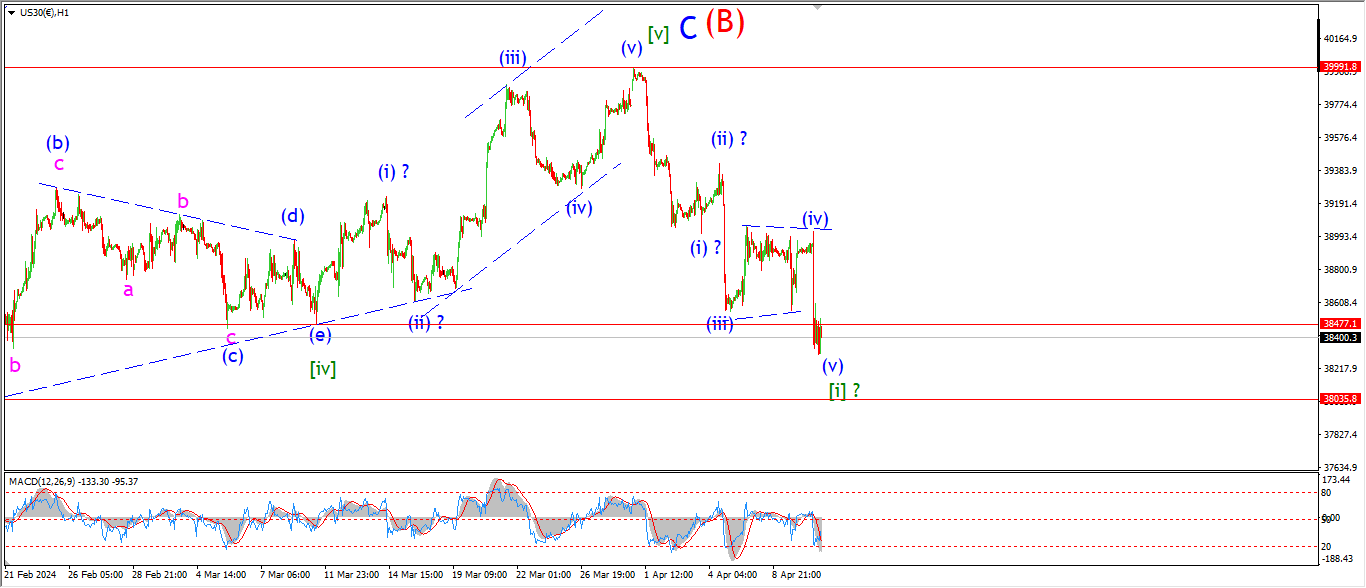
DOW 1hr.
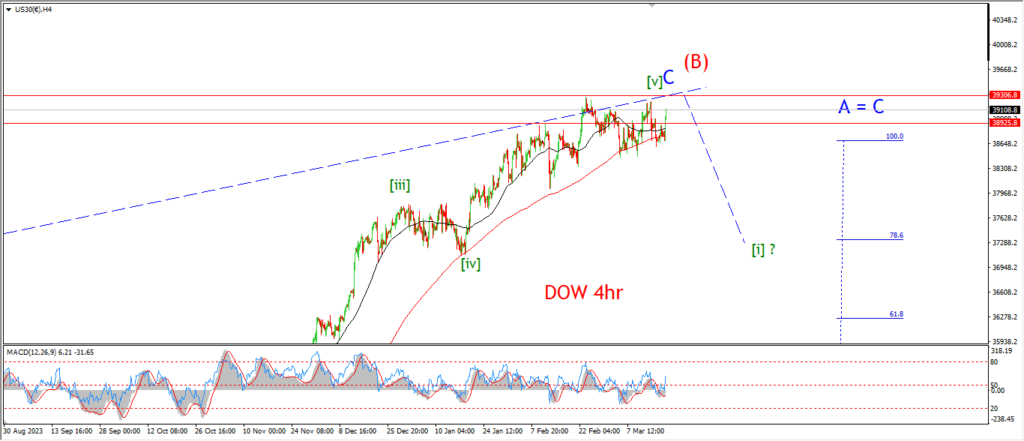
DOW 4hr
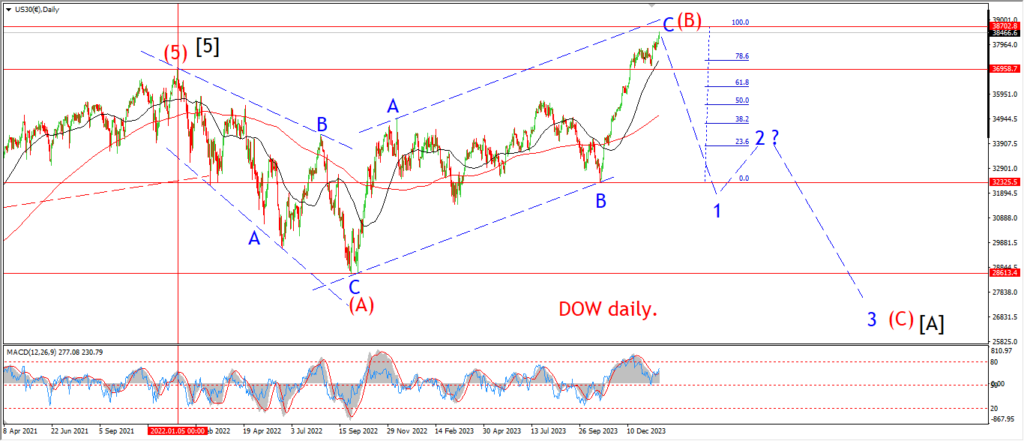
DOW daily.
Well,
I can’t complain about that now can I!
The market opened higher this morning for a little while.
this action changed the pattern for wave (iv) blue to an irregular flat rather than a triangle.
but then we saw a vertical drop off the highs and the market actually break support at the previous wave [iv] low.
I am writing as the market enters the last half hour of trading this evening and it is holding at the lows of the session.
I said last night that the lower this pattern makes it,
the better for the bearish outlook.
The market has broken the minimum expected level for wave [i] now,
but the statement remains true.
A break of the 38000 level would see the market close below the range of the previous right shoulder of this topping pattern.
That will break the neck of the head and shoulder pattern as it were.
And that will be another box ticked as I have been saying for a while now!
Tomorrow;
The minimum target for wave [i] has now been met.
So it is likely that wave [ii] will begin in the next few sessions.
But I would still prefer to see a break of the 38000 level to complete wave [i].
So lets see if wave (v) of [i] can do that before turning higher into wave [ii].
GOLD
GOLD 1hr.
GOLD 4hr.
GOLD daily.
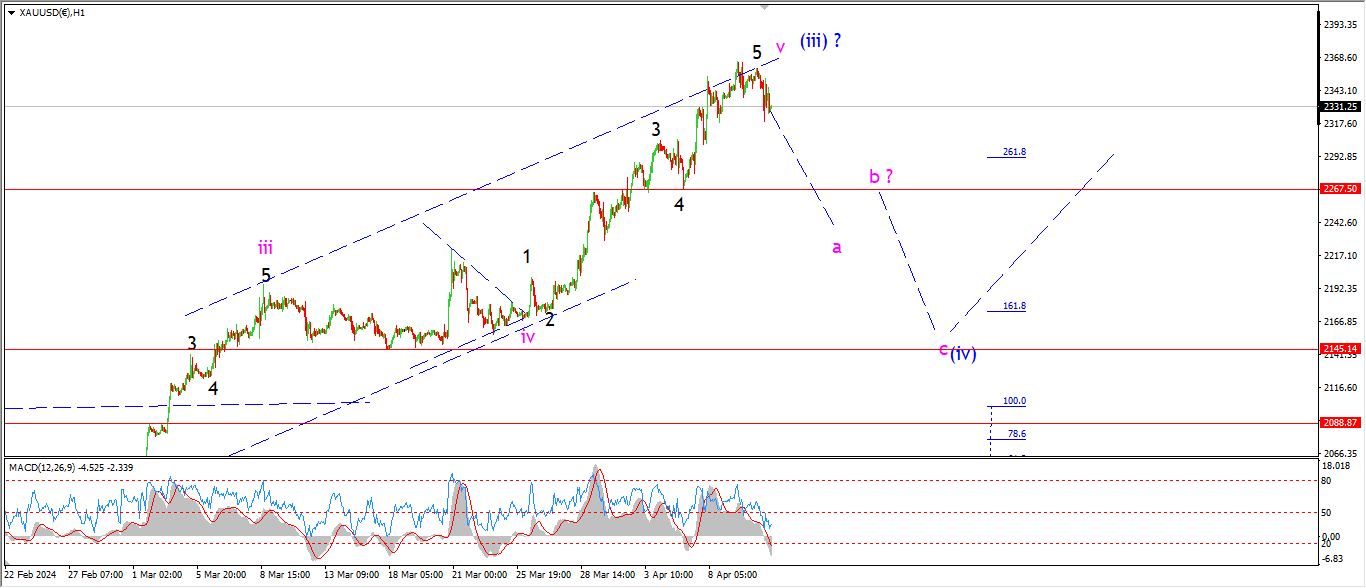
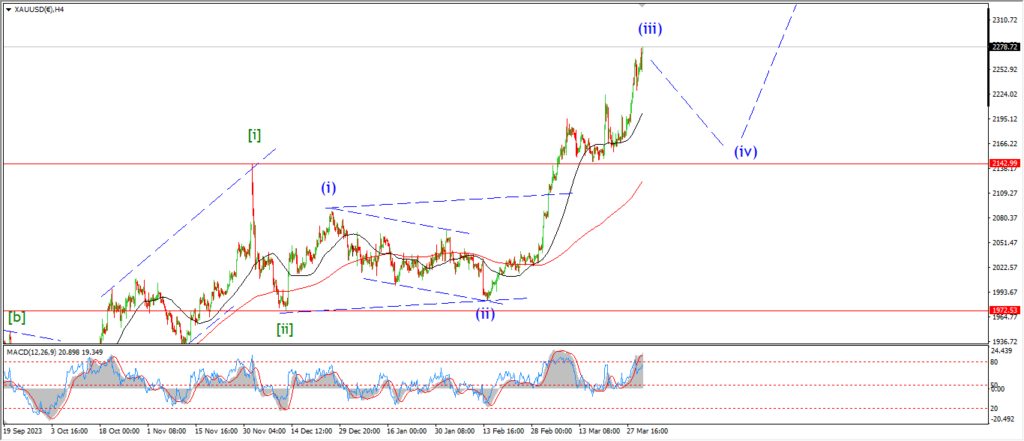
Gold is showing signs of weakness all this week and today we see the market holding below the recent wave (iii) high again.
there is not enough downside here to confirm wave ‘a’ is underway yet.
But I have marked the wave ‘4’ low at 2267 as a signal level to indicate that wave ‘a’ is underway.
The rally in wave ‘v’ of (iii) did not create a throw over as can often happen.
So I cant rule that out entirely.
But I do think that the extension of this rally above the 261% Fib extension level suggests that we have done enough to top this pattern already.
Tomorrow;
Watch for wave ‘a’ of (iv) to fall back below 2267 again to signal the correction in wave (iv) has begun.
CRUDE OIL.
CRUDE OIL 1hr.
CRUDE OIL 4hr.
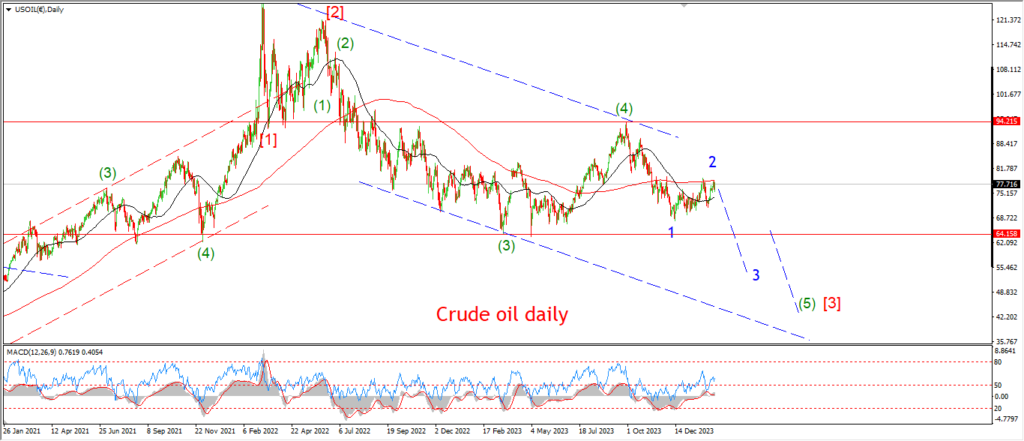
CRUDE OIL daily.
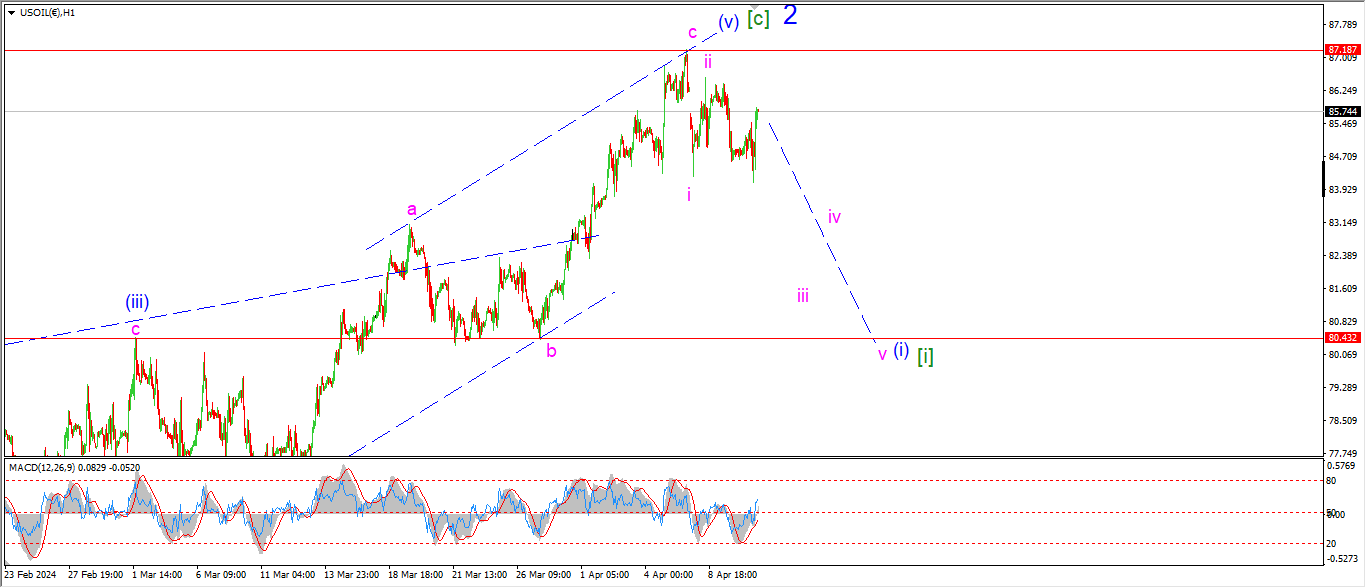
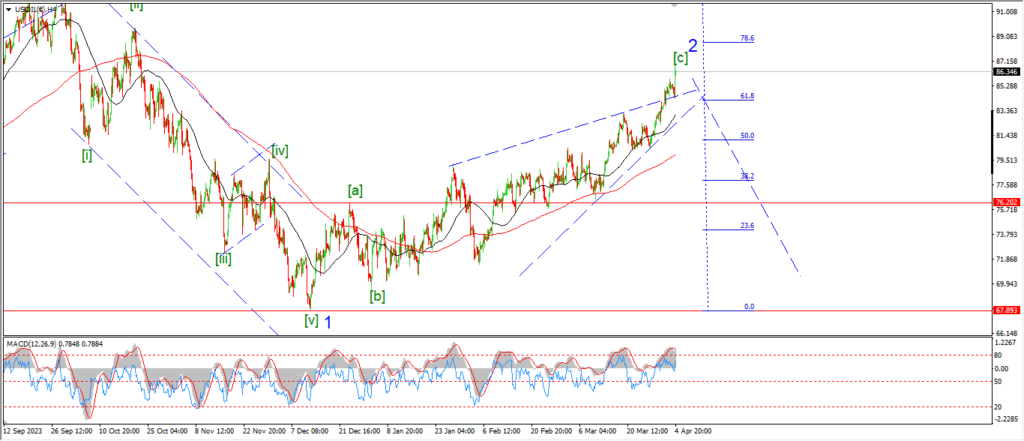
Crude is holding up again tonight without wave ‘iii’ taking over the action yet.
We have three waves down in place off the highs at the moment.
And the high of wave ‘2’ has not been confirmed yet.
I want to see a solid impulsive decline into the 80.00 handle again to confirm the turn lower,
so it remains a waiting game here to get a clearer picture on the pattern.
Tomorrow;
Watch for wave ‘ii’ to hold and wave ‘iii’ down to take over with a drop back below 83.00 again.
If the price breks to a new high again that might force a complete rethink of the larger pattern in wave ‘2’.
S&P 500.
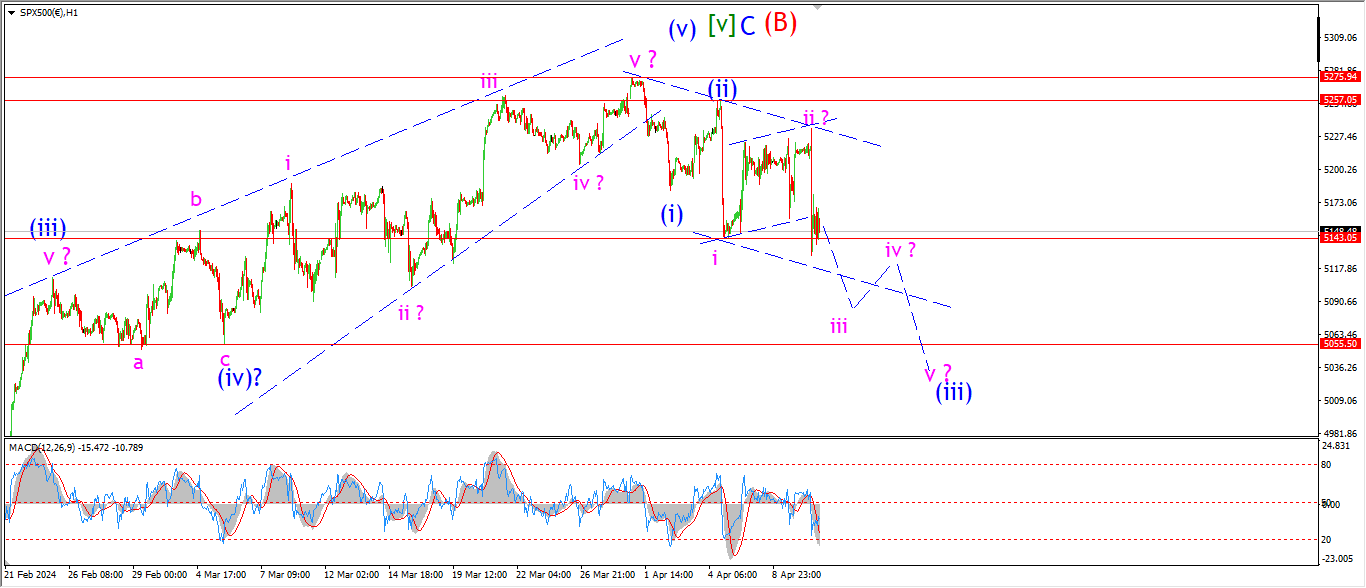
S&P 500 1hr
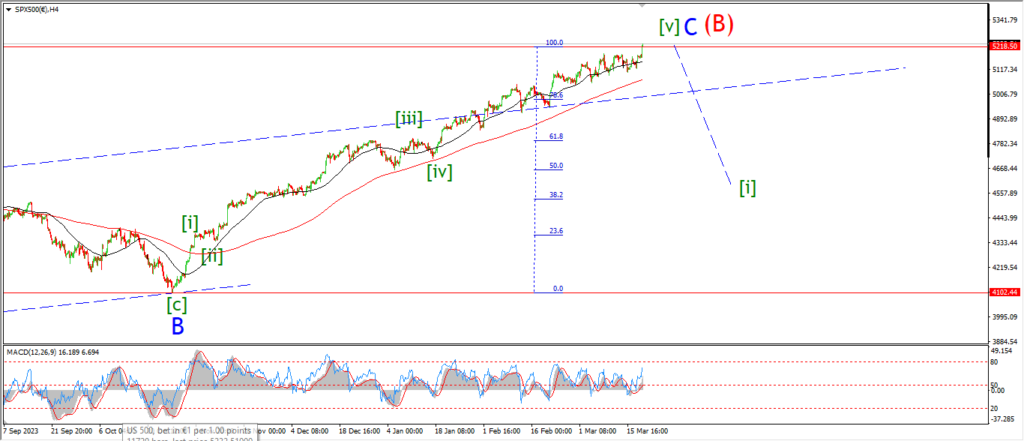
S&P 500 4hr
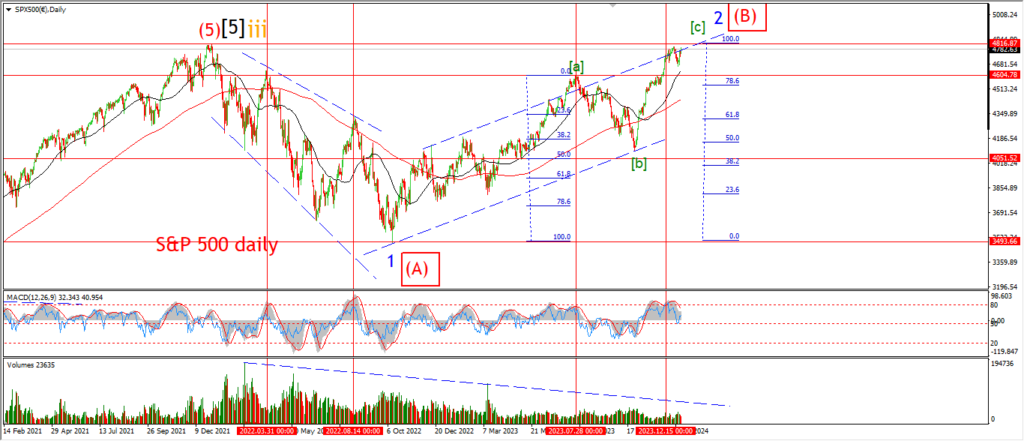
S&P 500 daily.
The S&P is moving lower in a channel without the five wave decline that we see in the DOW.
This is a little bit concerning to be honest,
but as long as the market is making progress lower,
then I will count it as a developing impulse wave down.
until proven otherwise.
If we look at the 4hr chart;
The slow down and momentum shift came after the market hit the ‘A’ = ‘C’ level at 5218 three weeks ago.
It is interesting that the market is slowly turning now,
after reaching equality and breaking above the upper trend channel line.
The pattern seems to fit well with a topping and reversal idea here.
It remains to be proven correct,
but the possibility is growing!
tomorrow;
I would like to see more downside to support the idea of a third wave extension.
Another day like today will favor this wave count for sure.
But we will see how it goes.
SILVER.
SILVER 1hr
SILVER 4hr.
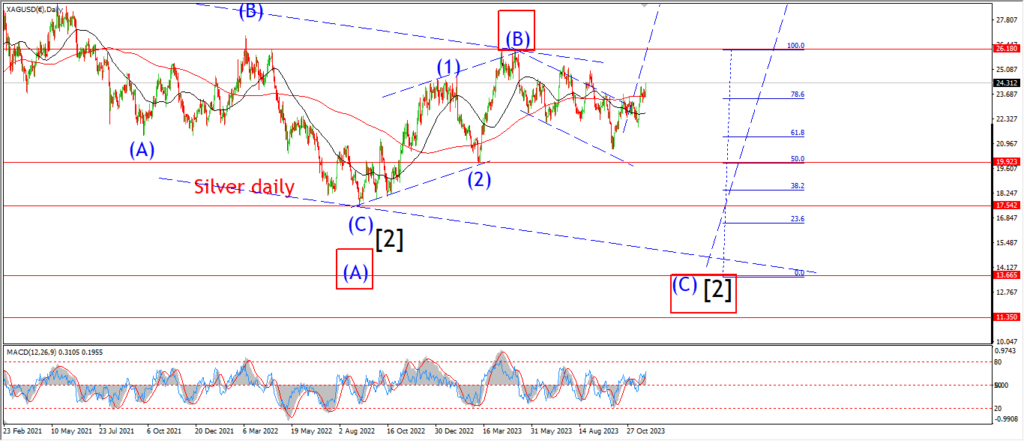
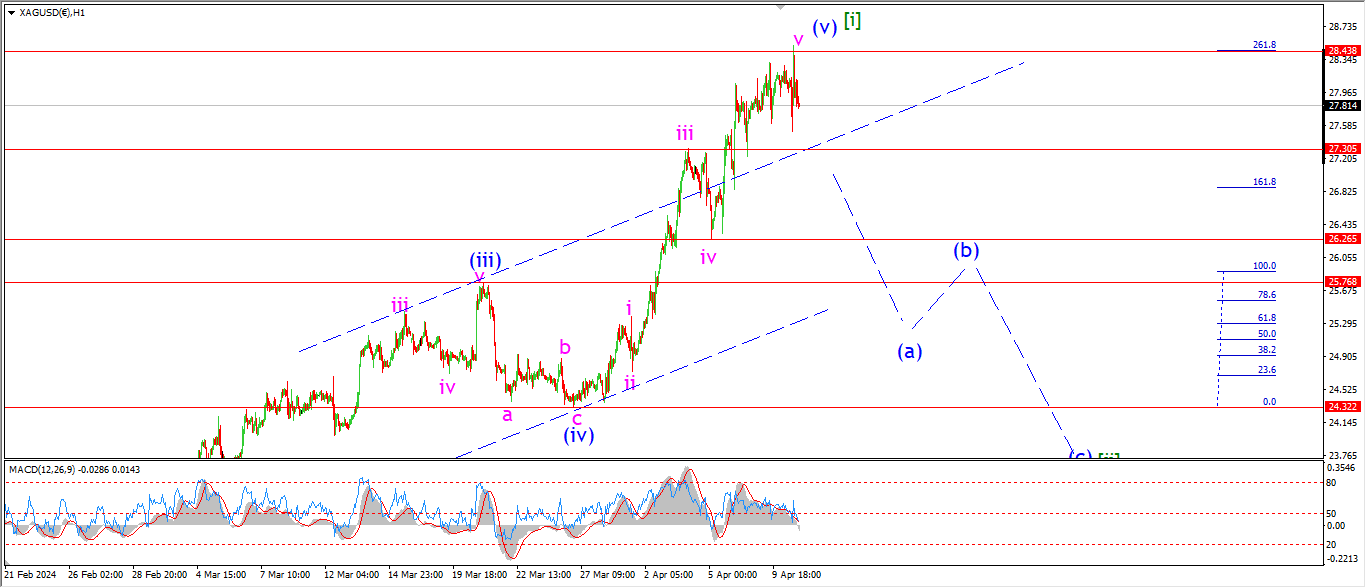
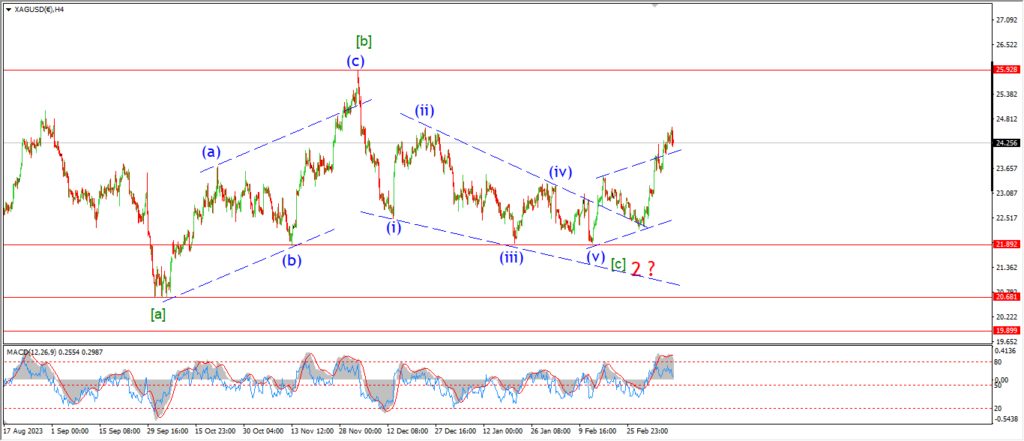
SILVER daily.
Silver has been holding flat so far this week,
So it is hard to read a whole lot into the pattern yet.
The top of wave [i] is still the best fit idea here.
and the weakness of late can easily indicate a turn into a correction is beginning.
But as of this moment I can’t confirm it.
I have marked the top of wave ‘iii’ of (v) at 27.30 as initial support.
The next important level is at wave ‘iv’ at 26.25.
And below that is the wave (iii) top at 25.78.
Those levels will be hard to break through,
but if wave [ii] is about to get underway here,
a break down through those support levels will confirm it.
Tomorrow;
Lets see if the market can threaten the initial support at 27.30.
If the market breaks and then holds below that level,
I will take that as a solid signal of wave (a) of [ii].
BITCOIN
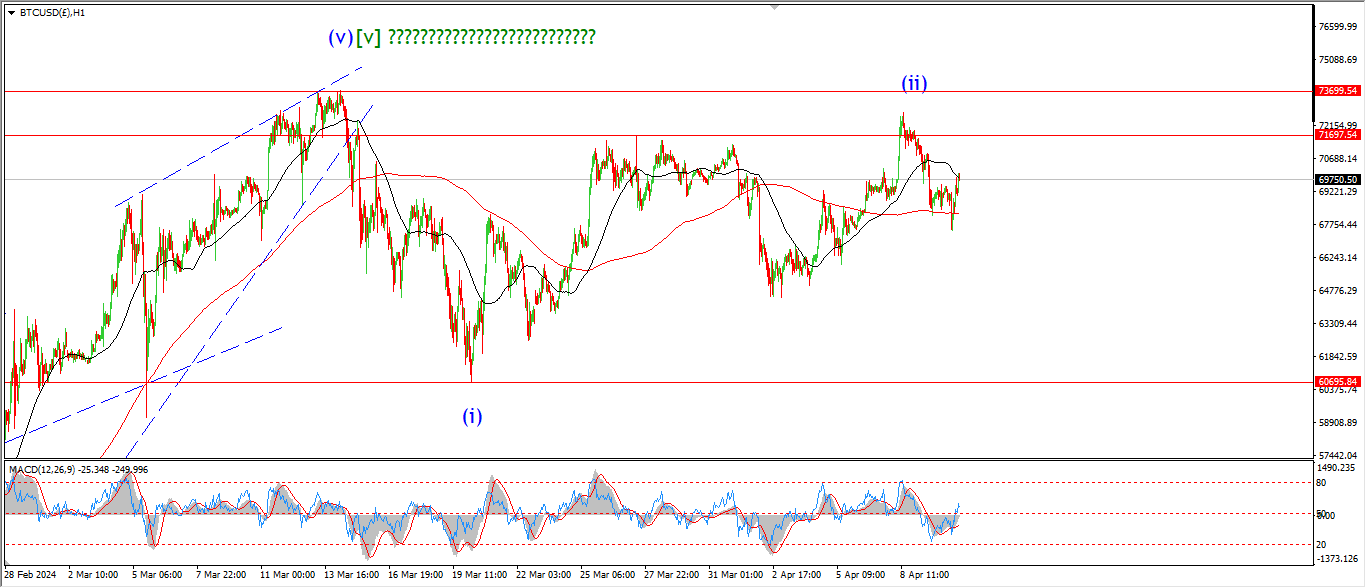
BITCOIN 1hr.
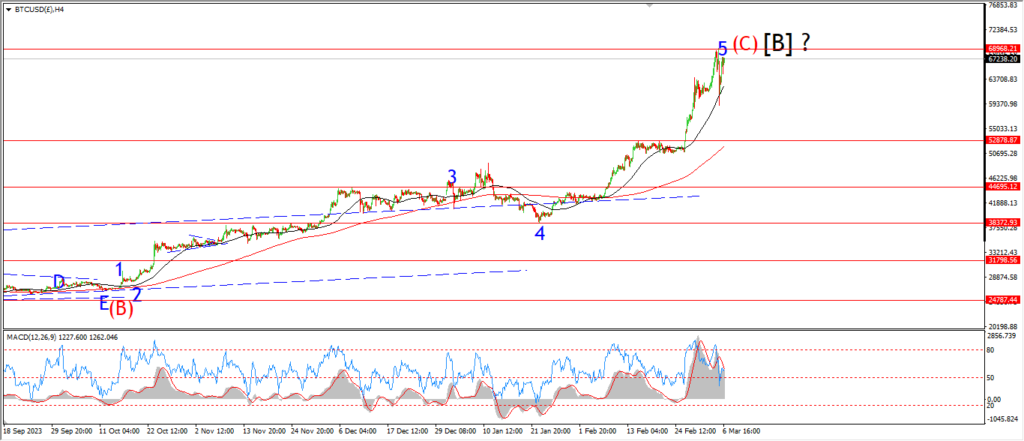
BITCOIN 4hr.
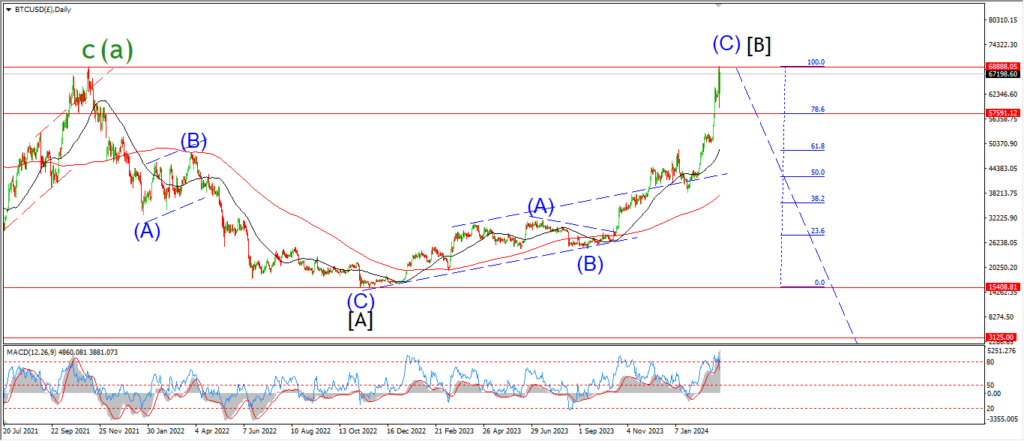
BITCOIN daily.
….
FTSE 100.
FTSE 100 1hr.

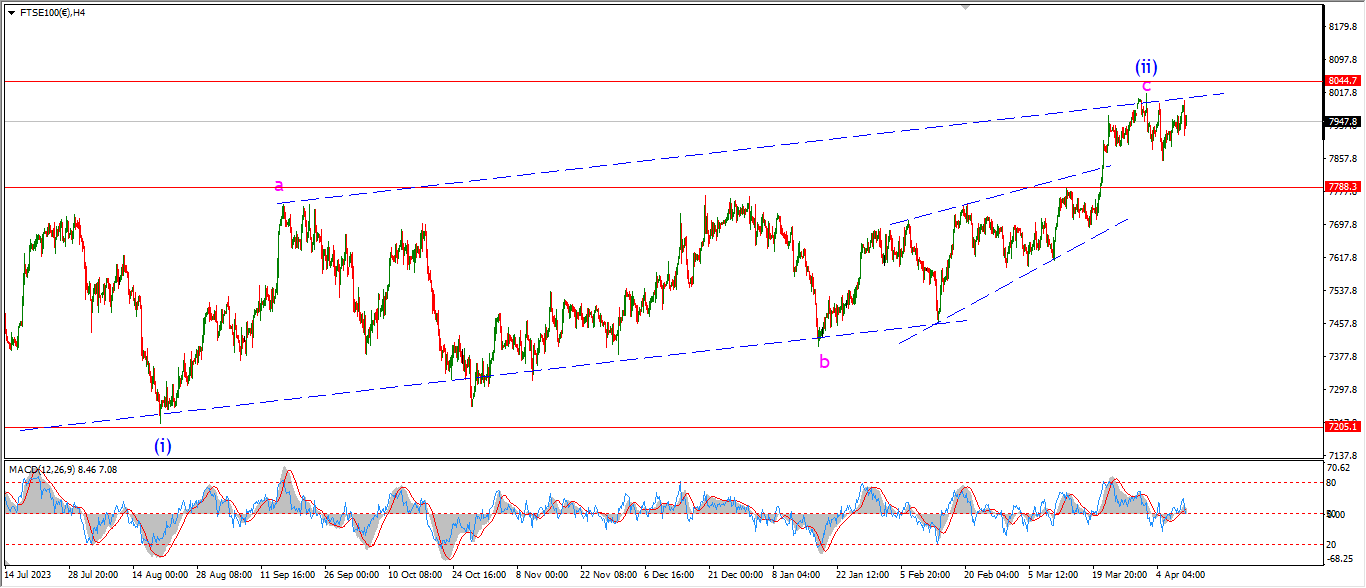
FTSE 100 4hr.

FTSE 100 daily.
….
DAX.
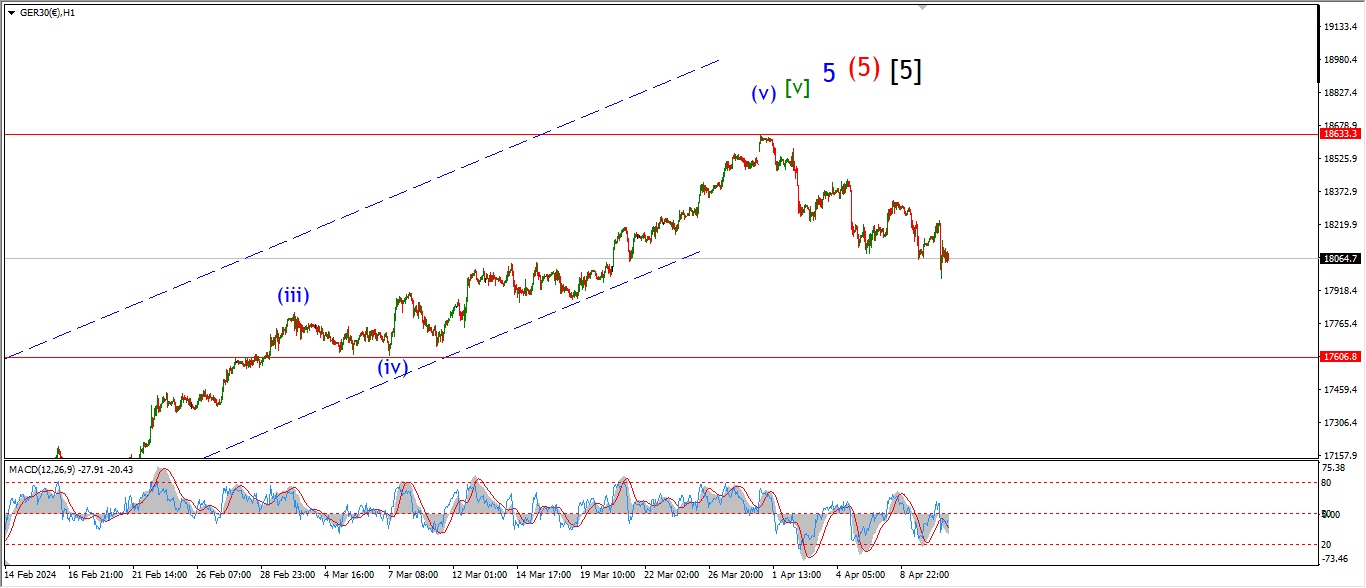
DAX 1hr
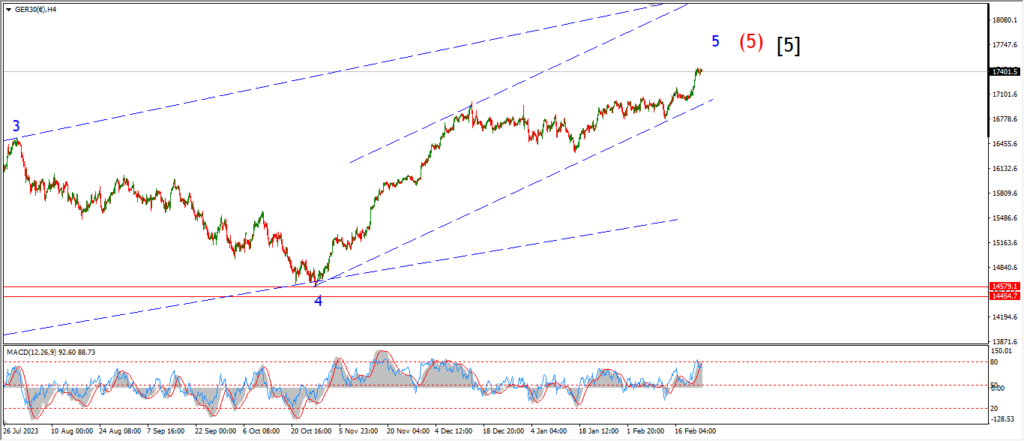
DAX 4hr

DAX daily.
….
NASDAQ 100.
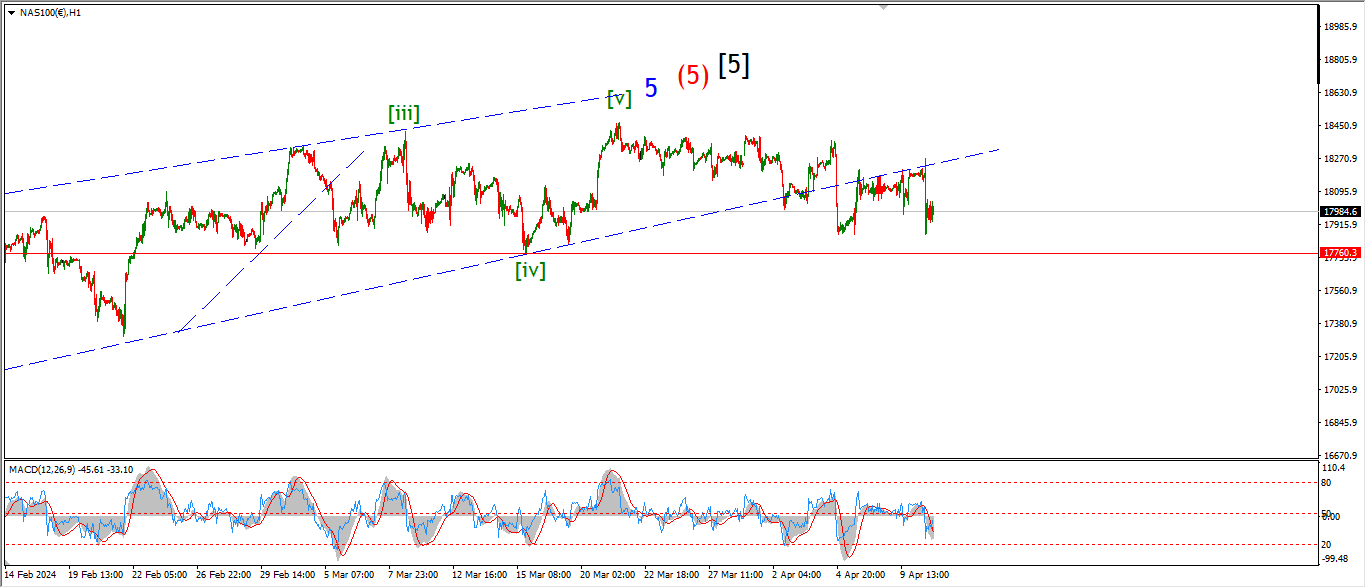
NASDAQ 1hr
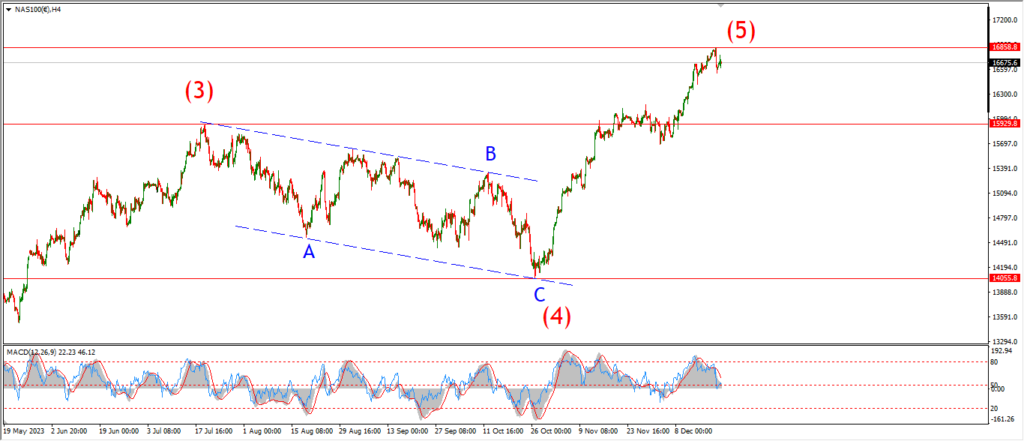
NASDAQ 4hr.
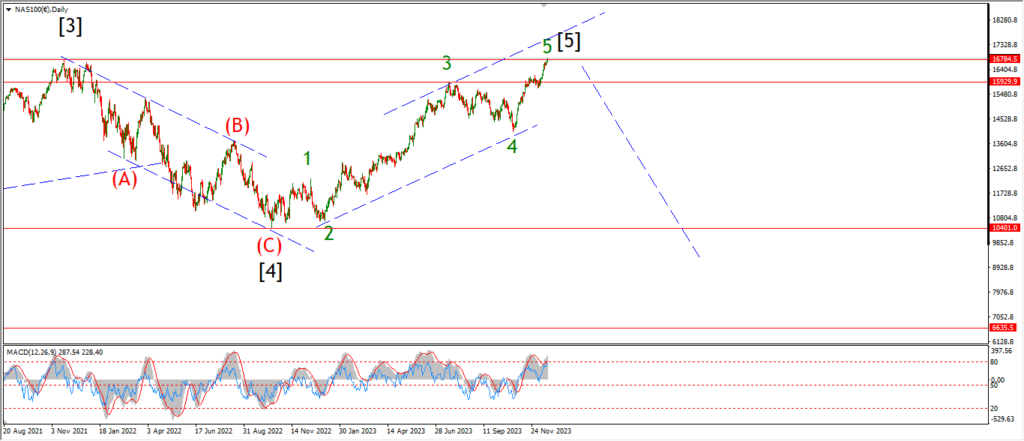
NASDAQ daily.
….