
[vc_row][vc_column][vc_separator border_width=”5″][/vc_column][/vc_row]
[vc_row][vc_column][vc_column_text]
Hi everyone.
I have a working wave count on BTCUSD,
you may be interested to take a look.
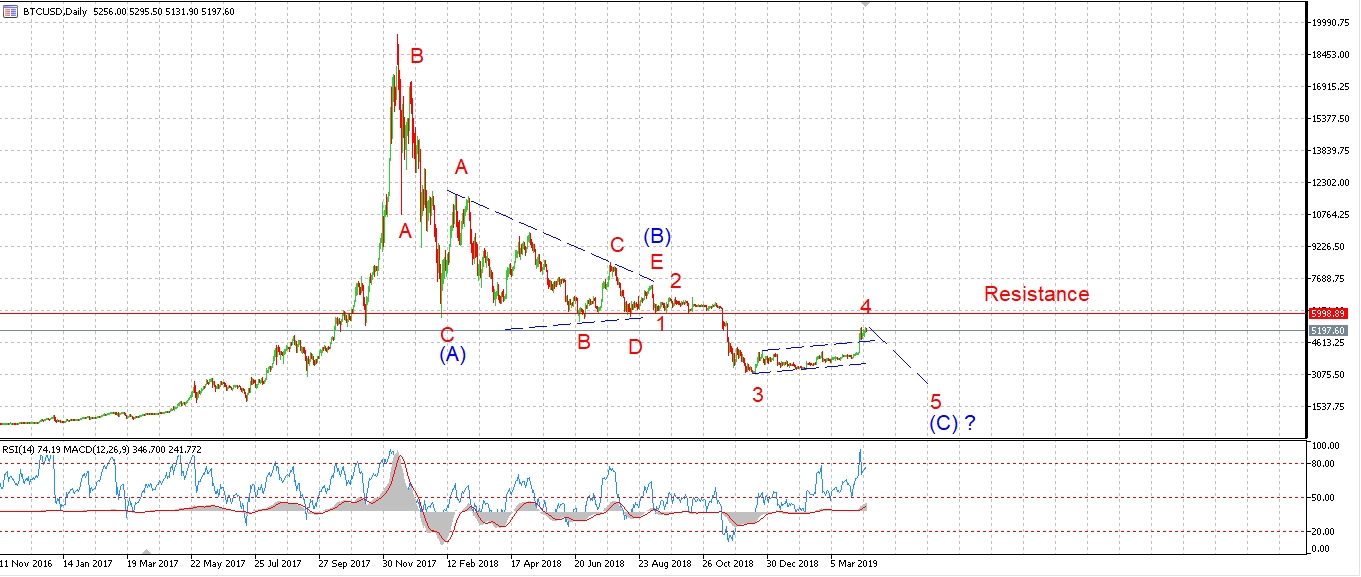
The price is approaching serious resistance now between 5600 – 5900. So there is a solid potential that bitcoin is going to roll over again into a fifth wave.
I will keep an eye on this one over the coming weeks.
Also, John Hussman just released a real deep dive into the market from a valuation perspective.
Here it is, his monthly updates are always worth reading.
[/vc_column_text][/vc_column][/vc_row]
[_s2If current_user_can(access_s2member_ccap_eurusd)]
[vc_row][vc_column][vc_separator border_width=”5″][/vc_column][/vc_row]
[vc_row][vc_column][vc_column_text]
EURUSD
[/vc_column_text][/vc_column][/vc_row]
[vc_row][vc_column][vc_separator border_width=”5″][/vc_column][/vc_row][vc_row][vc_column width=”2/3″][vc_custom_heading text=”1 hr” use_theme_fonts=”yes”][vc_column_text]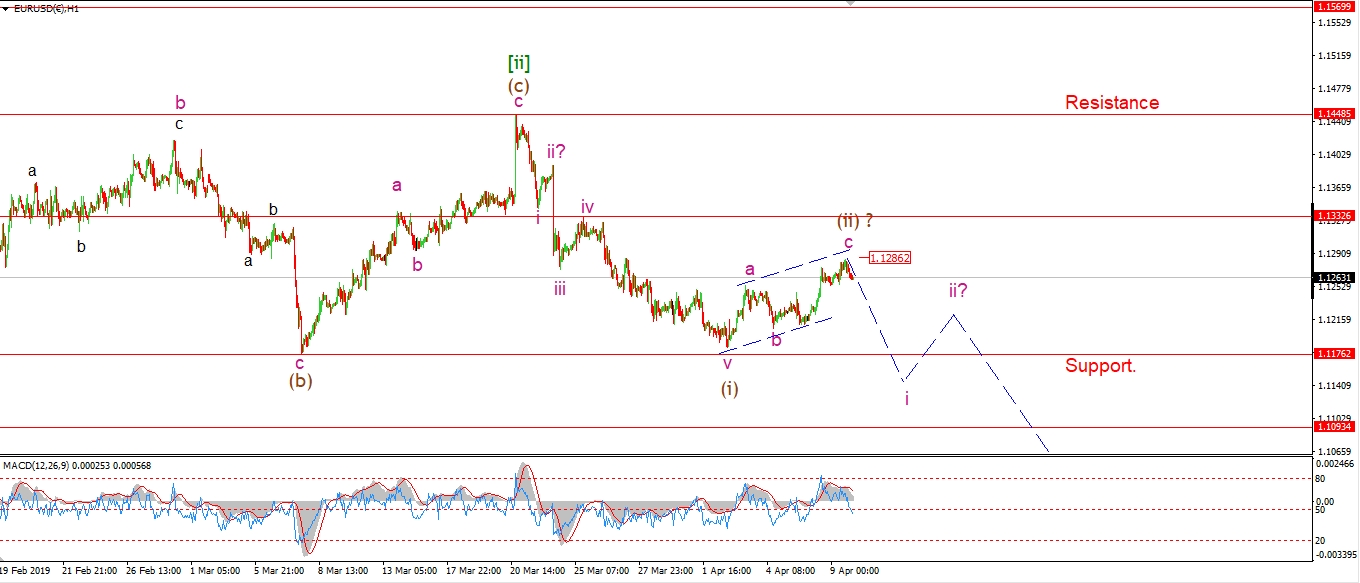 [/vc_column_text][/vc_column][vc_column width=”1/3″][vc_custom_heading text=”4 Hours” use_theme_fonts=”yes”][vc_column_text]
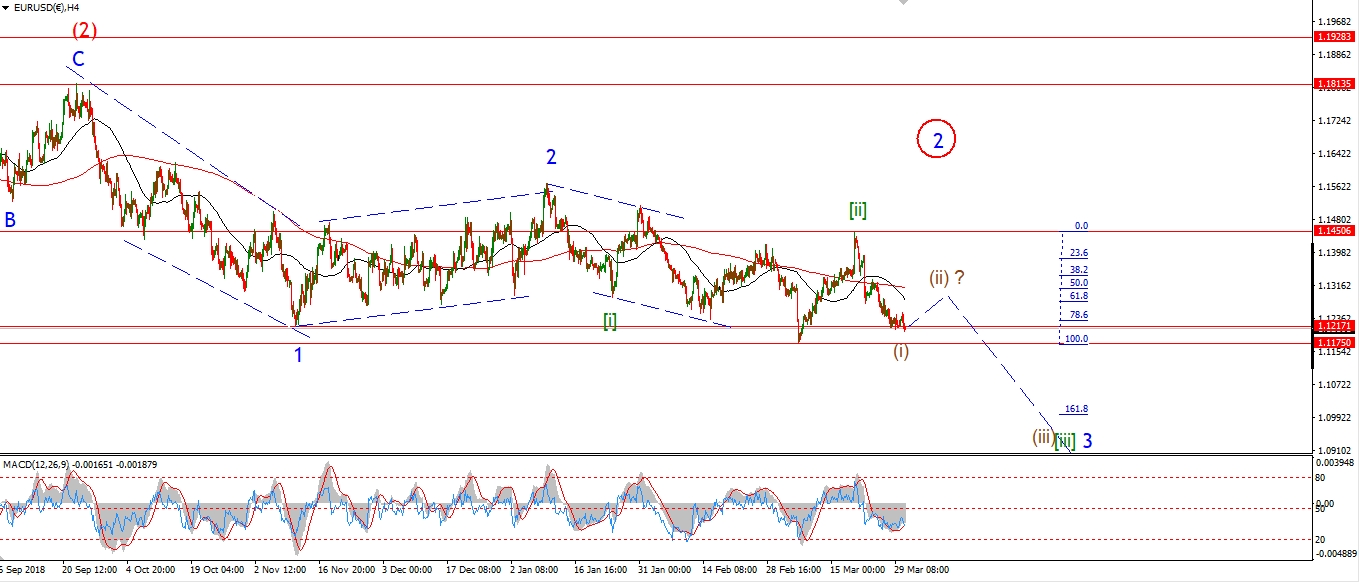 [/vc_column_text][vc_custom_heading text=”Daily” use_theme_fonts=”yes”][vc_column_text]
 [/vc_column_text][/vc_column][/vc_row]
[vc_row][vc_column][vc_column_text]
EURUSD has now completed a three wave correction in wave (ii) brown.
The price has moved lower off the session highs as we approach the close.
I’m not certain that the top for wave (ii) is in,
but the signs are sure pointing that way now.
If this count is correct,
then wave (iii) down will begin tomorrow.
Tomorrow;
Watch for a drop off todays highs in wave ‘i’ of (iii).
A break of 1.1175 will signal that wave (iii) down has begun.
Wave (iii) has the potential to accelerate lower,
with the minimum target for wave (iii) at 109.50 or so.
This is where wave (iii) will equal wave (i).
[/vc_column_text][/vc_column][/vc_row]
[/_s2If]
[_s2If current_user_can(access_s2member_ccap_gbpusd)]
[vc_row][vc_column][vc_separator border_width=”5″][/vc_column][/vc_row][vc_row][vc_column][vc_column_text]
GBPUSD
[/vc_column_text][/vc_column][/vc_row][vc_row][vc_column][vc_separator border_width=”5″][/vc_column][/vc_row][vc_row][vc_column width=”2/3″][vc_custom_heading text=”1 hr” use_theme_fonts=”yes”][vc_column_text]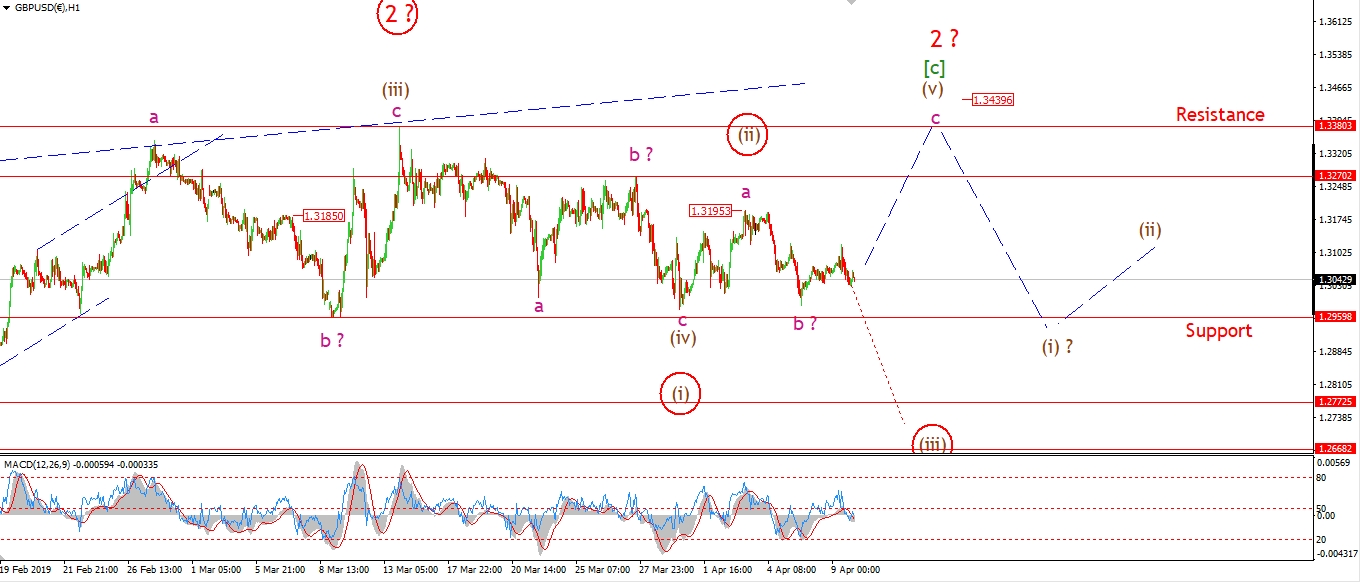 [/vc_column_text][/vc_column][vc_column width=”1/3″][vc_custom_heading text=”4 Hours” use_theme_fonts=”yes”][vc_column_text]
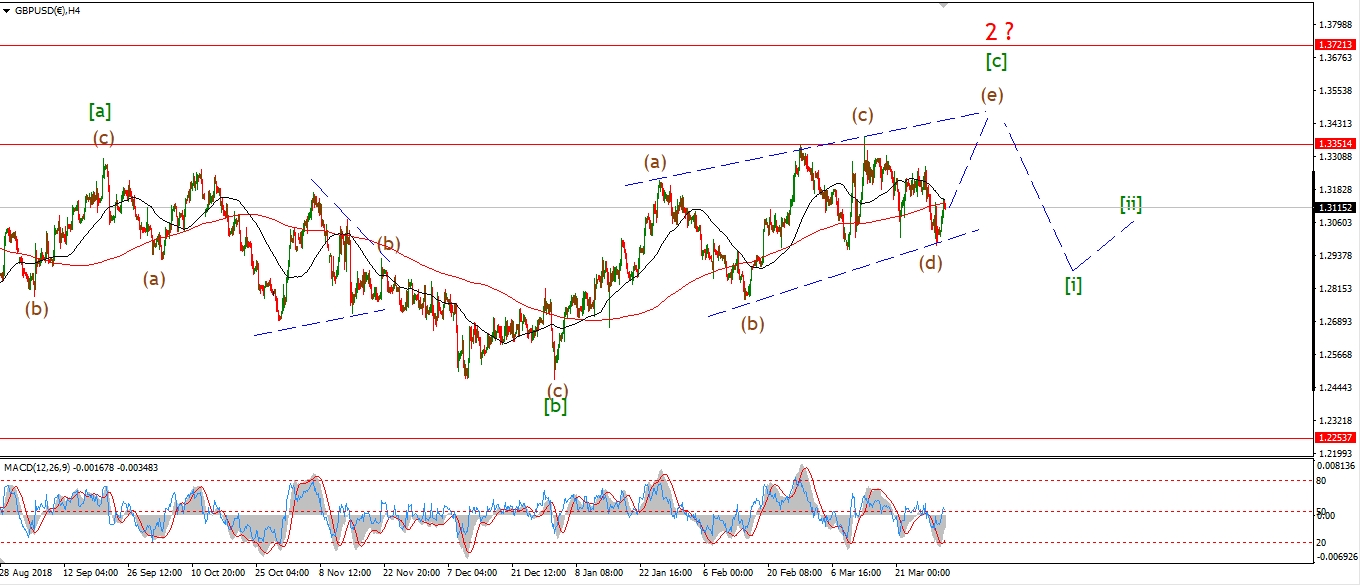 [/vc_column_text][vc_custom_heading text=”Daily” use_theme_fonts=”yes”][vc_column_text]
 [/vc_column_text][/vc_column][/vc_row]
[vc_row][vc_column][vc_column_text]
Cable has also created a small three wave rise off the low labelled wave ‘b’ of (v).
This could signal a correction higher.
Tonights drop back off the high is another vote in favor of the alternate count.
But still no confirmation of that alternate count yet.
If we see a break break of 1.2959 tomorrow,
then we can switch to that immediately bearish outlook.
Tomorrow;
Watch for confirmation of the bearish alternate count with a break of 1.2959.
[/vc_column_text][/vc_column][/vc_row]
[/_s2If]
[_s2If current_user_can(access_s2member_ccap_usdjpy)]
[vc_row][vc_column][vc_separator border_width=”5″][/vc_column][/vc_row][vc_row][vc_column][vc_column_text]
USDJPY
[/vc_column_text][/vc_column][/vc_row][vc_row][vc_column][vc_separator border_width=”5″][/vc_column][/vc_row][vc_row][vc_column width=”2/3″][vc_custom_heading text=”1 hr” use_theme_fonts=”yes”][vc_column_text]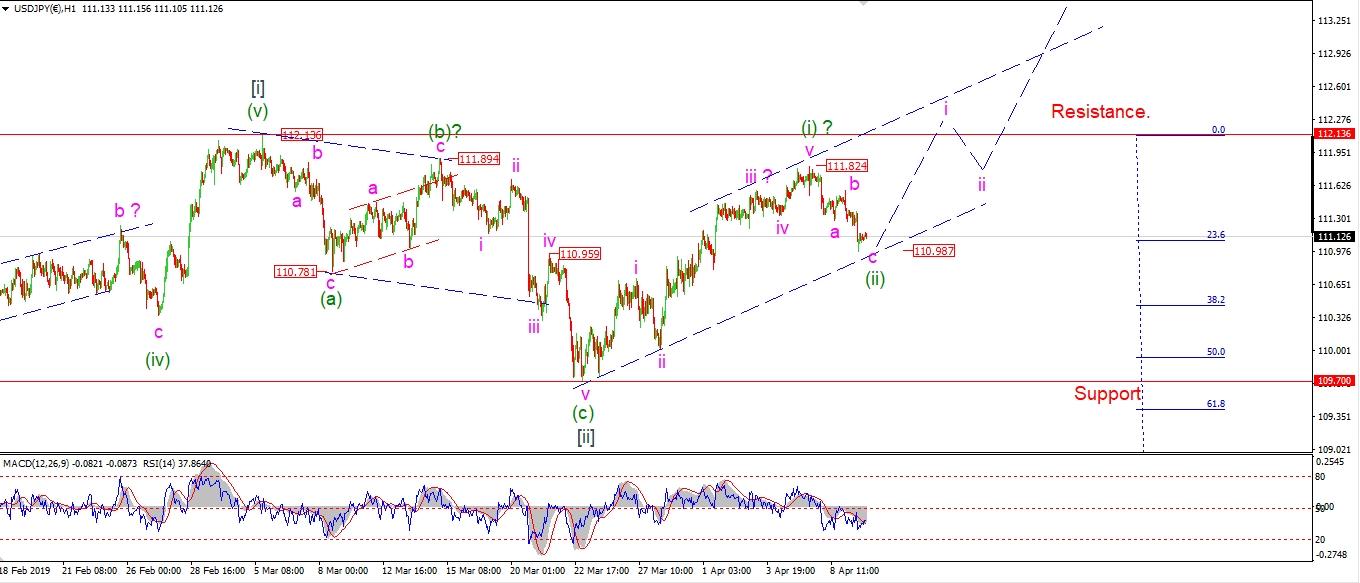 [/vc_column_text][/vc_column][vc_column width=”1/3″][vc_custom_heading text=”4 Hours” use_theme_fonts=”yes”][vc_column_text]
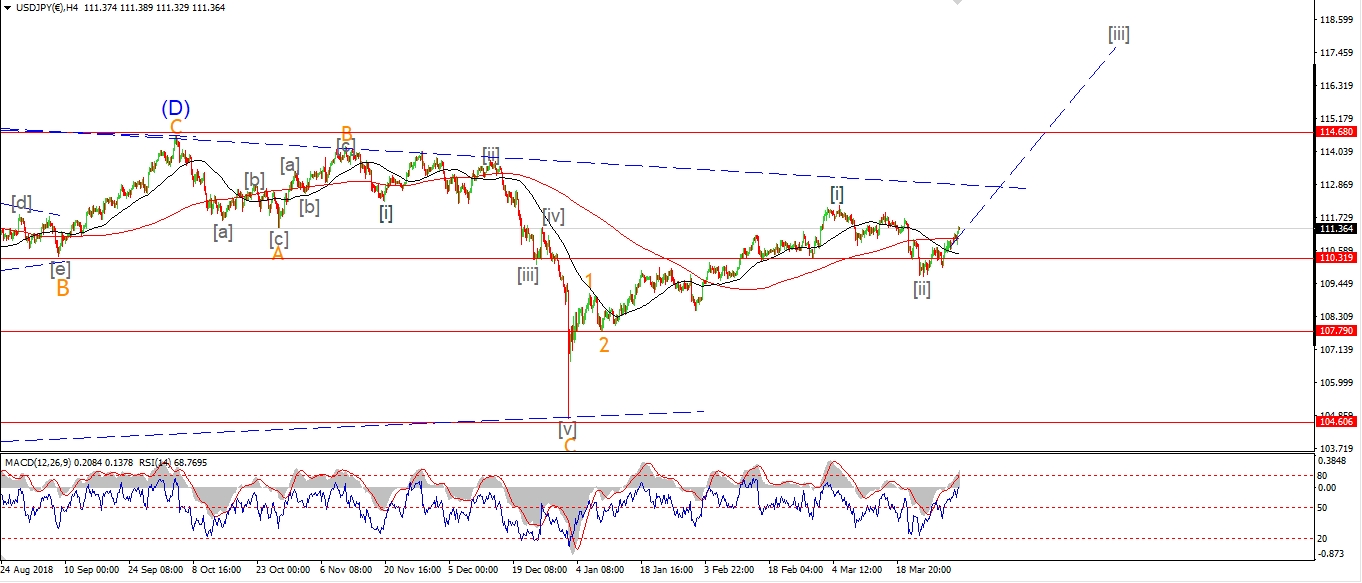 [/vc_column_text][vc_custom_heading text=”Daily” use_theme_fonts=”yes”][vc_column_text]
 [/vc_column_text][/vc_column][/vc_row]
[vc_row][vc_column][vc_column_text]
USDJPY has now dropped off the wave (i) high in three waves.
The price is close to completing wave ‘c’ of (ii) right now.
This should be achieved overnight with another slight decline
which will create a five wave structure in wave ‘c’.
Tomorrow;
The time is upon us now to look higher again in wave (iii) of [iii].
Watch for wave (ii) to complete overnight at the lower trend channel line.
Wave (iii) up should begin with a break of 111.83 in wave ‘i’.
[/vc_column_text][/vc_column][/vc_row]
[/_s2If]
[_s2If current_user_can(access_s2member_ccap_dow_jones)]
[vc_row][vc_column][vc_separator border_width=”5″][/vc_column][/vc_row][vc_row][vc_column][vc_column_text]
DOW JONES INDUSTRIALS
[/vc_column_text][/vc_column][/vc_row][vc_row][vc_column][vc_separator border_width=”5″][/vc_column][/vc_row][vc_row][vc_column width=”2/3″][vc_custom_heading text=”1 hr” use_theme_fonts=”yes”][vc_column_text]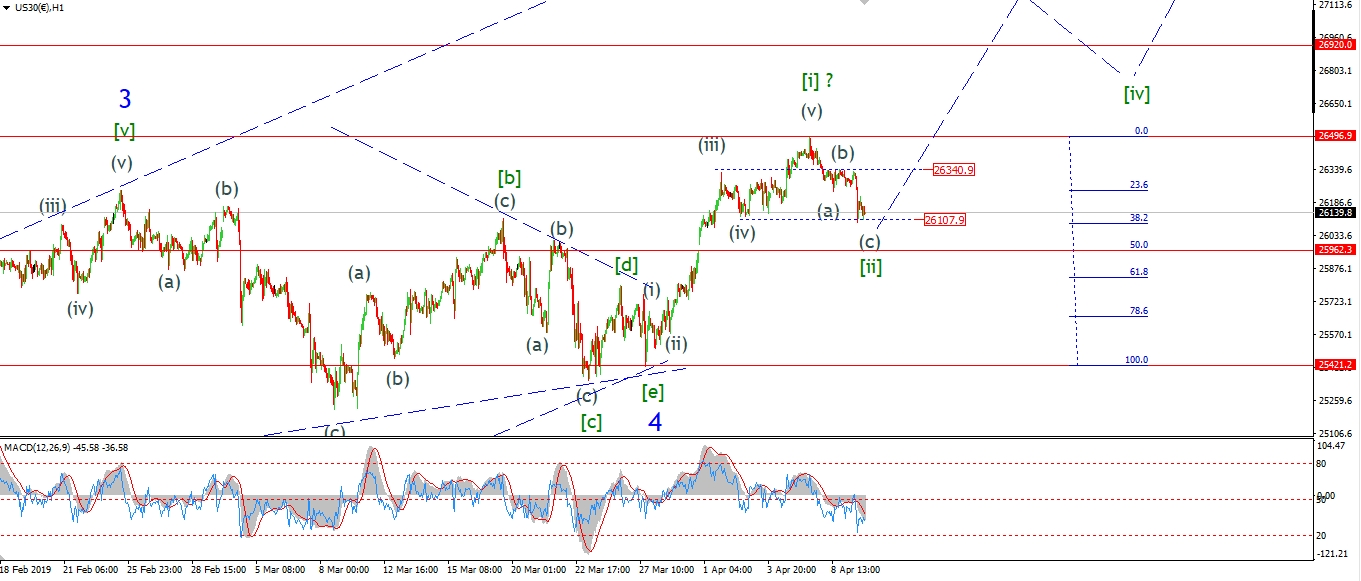 [/vc_column_text][/vc_column][vc_column width=”1/3″][vc_custom_heading text=”4 Hours” use_theme_fonts=”yes”][vc_column_text]
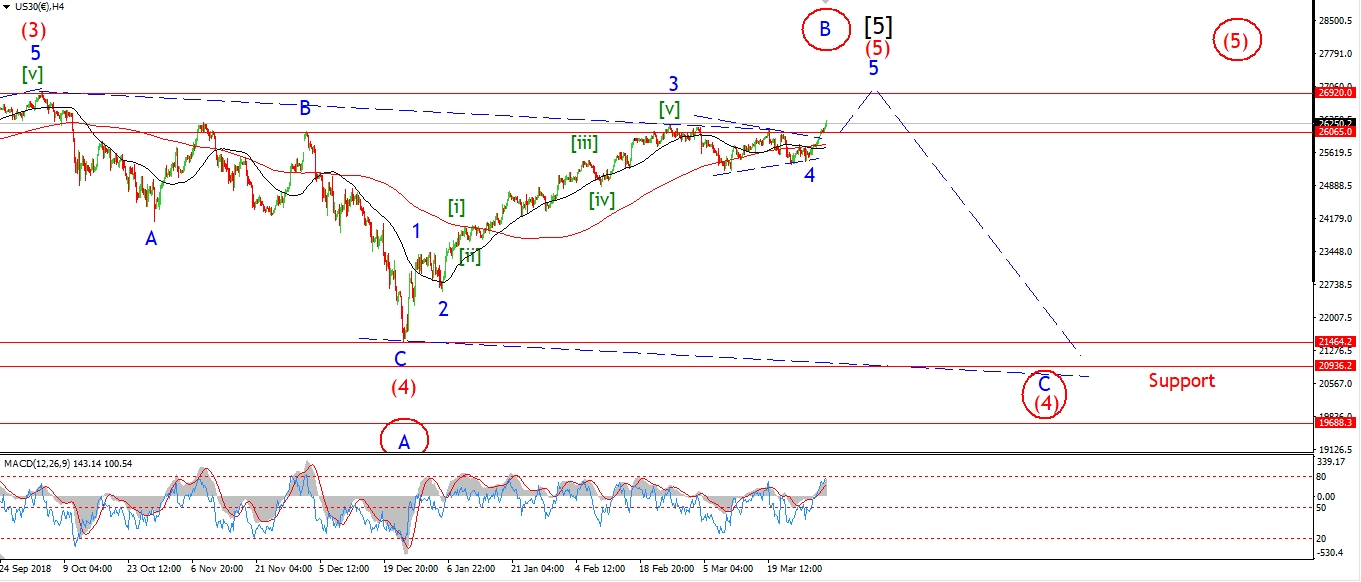 [/vc_column_text][vc_custom_heading text=”Daily” use_theme_fonts=”yes”][vc_column_text]
 [/vc_column_text][/vc_column][/vc_row]
[vc_row][vc_column][vc_column_text]
The DOW is declining in three waves off the wave [i] high.
Wave (c) of [ii] is well along the road to completion this evening.
Although I think we will see one more low,
to create a clear five wave structure in wave (c).
Price has hit the initial support at the previous fourth wave at 26100.
The more likely target for wave [ii] now is the 50% retracement level at 25960.
Once wave [ii] completes,
we can look higher again in wave [iii] of ‘5’.
A break of 26340 again will signal that wave [iii] has begun.
Tomorrow;
Watch for a final low in wave (c) of [ii] at about 25960.
Wave [iii] up may even begin by tomorrow evening.
[/vc_column_text][/vc_column][/vc_row]
[/_s2If]
[_s2If current_user_can(access_s2member_ccap_gold)]
[vc_row][vc_column][vc_separator border_width=”5″][/vc_column][/vc_row][vc_row][vc_column][vc_column_text]
GOLD
[/vc_column_text][/vc_column][/vc_row][vc_row][vc_column][vc_separator border_width=”5″][/vc_column][/vc_row][vc_row][vc_column width=”2/3″][vc_custom_heading text=”1 hr” use_theme_fonts=”yes”][vc_column_text]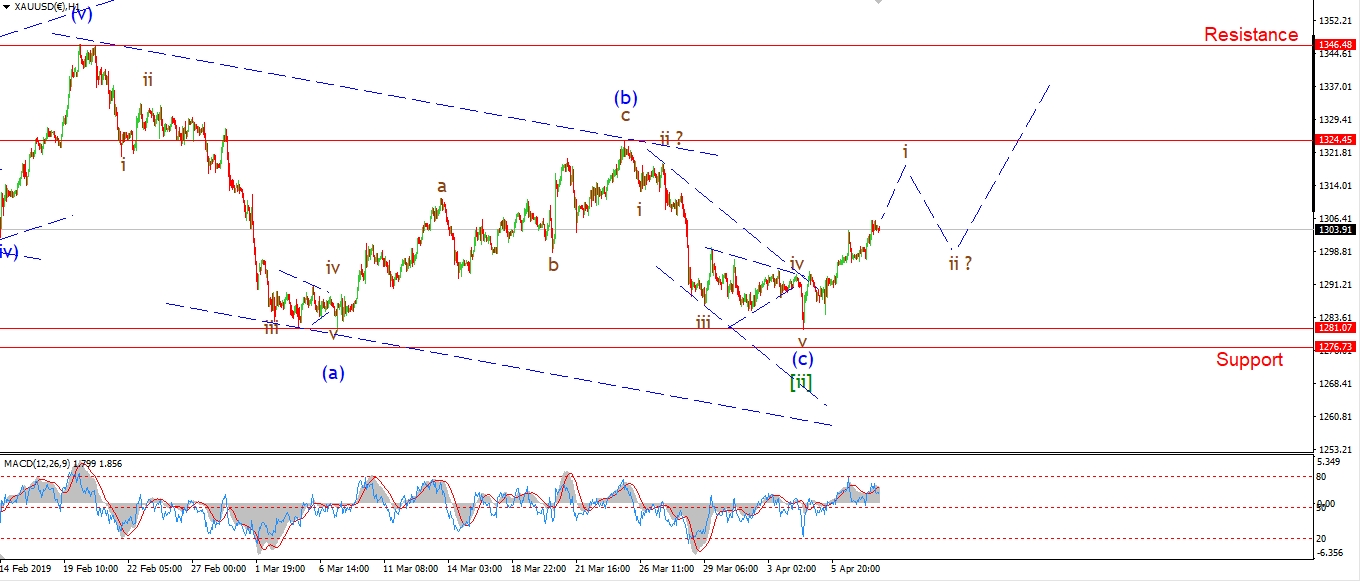 [/vc_column_text][/vc_column][vc_column width=”1/3″][vc_custom_heading text=”4 Hours” use_theme_fonts=”yes”][vc_column_text]
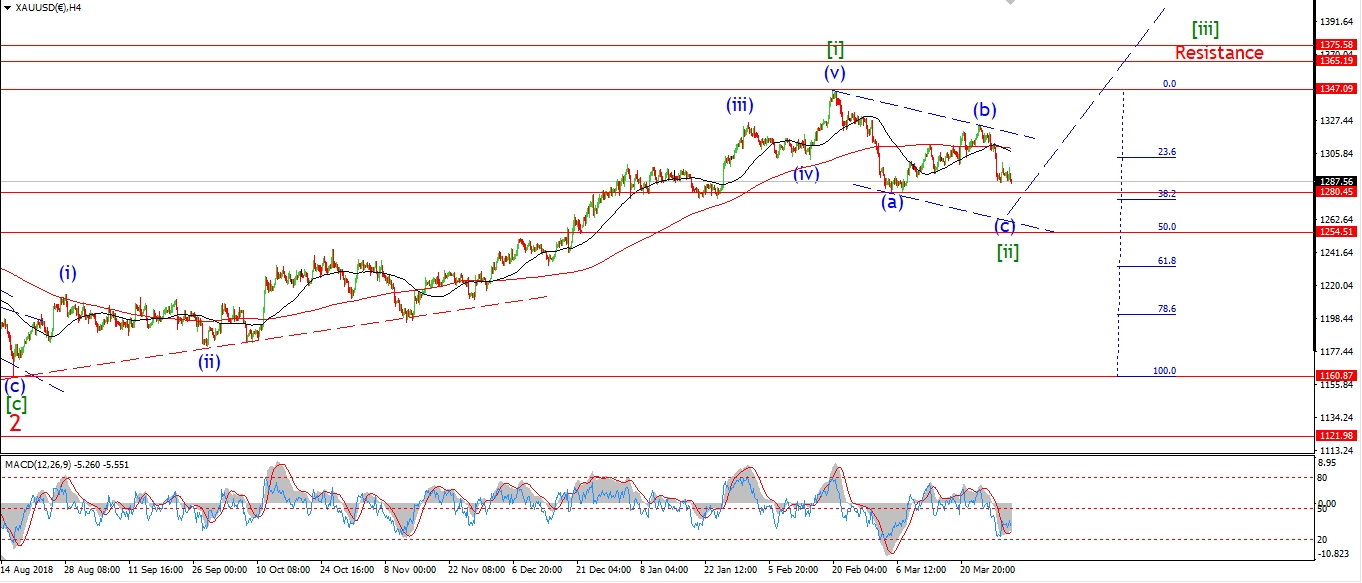 [/vc_column_text][vc_custom_heading text=”Daily” use_theme_fonts=”yes”][vc_column_text]
 [/vc_column_text][/vc_column][/vc_row]
[vc_row][vc_column][vc_column_text]
GOLD is higher again this evening and holding above 1300 again which is a good sign.
Wave ‘i’ up has not created a clear five wave pattern just yet.
I would like to see a push up to the previous wave (b) high at 1324 in wave ‘i’.
We will see how that fairs out tomorrow.
Tomorrow;
Watch for wave ‘i’ to reach higher and complete a five wave pattern in doing so.
The price should continue to hold above that 1300 level now.
[/vc_column_text][/vc_column][/vc_row]
[/_s2If]
[_s2If current_user_can(access_s2member_ccap_crude)]
[vc_row][vc_column][vc_separator border_width=”5″][/vc_column][/vc_row][vc_row][vc_column][vc_column_text]
U.S CRUDE OIL
[/vc_column_text][/vc_column][/vc_row][vc_row][vc_column][vc_separator border_width=”5″][/vc_column][/vc_row][vc_row][vc_column width=”2/3″][vc_custom_heading text=”1 hr” use_theme_fonts=”yes”][vc_column_text]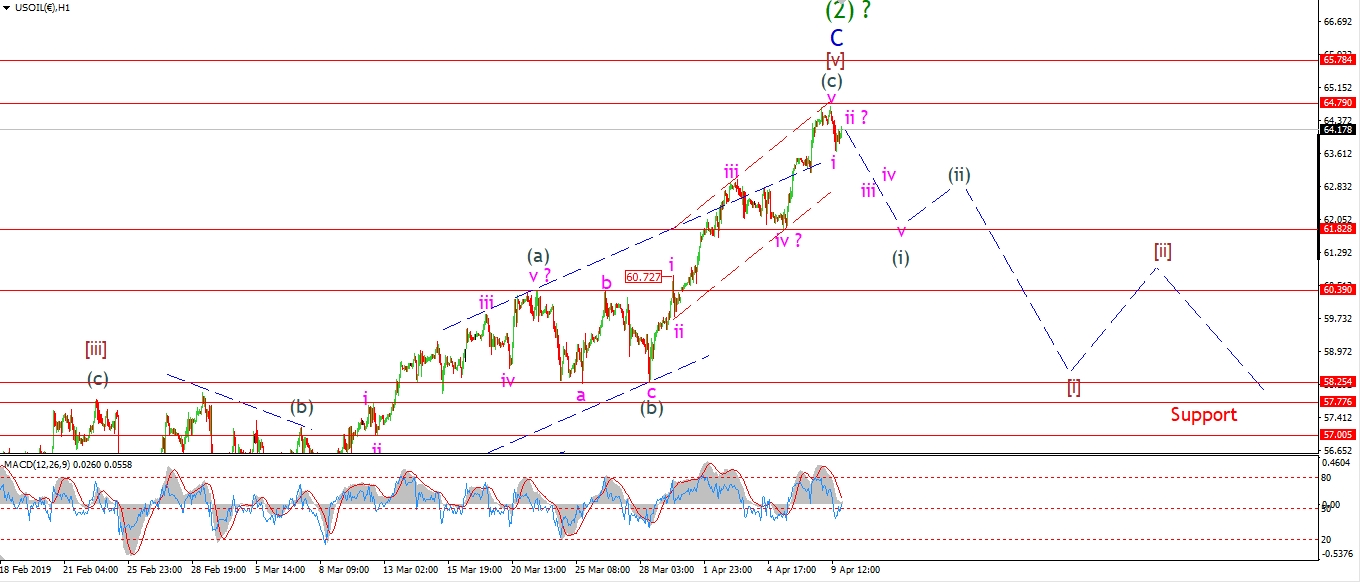 [/vc_column_text][/vc_column][vc_column width=”1/3″][vc_custom_heading text=”4 Hours” use_theme_fonts=”yes”][vc_column_text]
 [/vc_column_text][vc_custom_heading text=”Daily” use_theme_fonts=”yes”][vc_column_text]
 [/vc_column_text][/vc_column][/vc_row]
[vc_row][vc_column][vc_column_text]
Crude has dropped off the the morning highs with a fairly sharp move lower.
The extended nature of this rally is bound to cool off at some point,
but the question is;
will the price now finally drop off the highs in a five wave move.
To give us that bearish signal that I have been looking for.
I have labelled todays drop as wave ‘i’ down,
with wave ‘ii’ now underway to create a lower high.
If we see a sharp selloff tomorrow in wave ‘iii’ back towards the previous wave ‘iv’ low at 61.80.
That will be a good sign that the market has topped out.
A decline in five waves is what this week is all about!
Tomorrow;
Watch for wave ‘iii’ of (i) to continue lower.
The high at 64.79 should hold.
[/vc_column_text][/vc_column][/vc_row]
[/_s2If]
[_s2If current_user_can(access_s2member_ccap_us10yr)]
[vc_row][vc_column][vc_separator border_width=”5″][/vc_column][/vc_row][vc_row][vc_column][vc_column_text]
US 10 yr Treasuries.
[/vc_column_text][/vc_column][/vc_row][vc_row][vc_column][vc_separator border_width=”5″][/vc_column][/vc_row][vc_row][vc_column width=”2/3″][vc_custom_heading text=”1 hr” use_theme_fonts=”yes”][vc_column_text]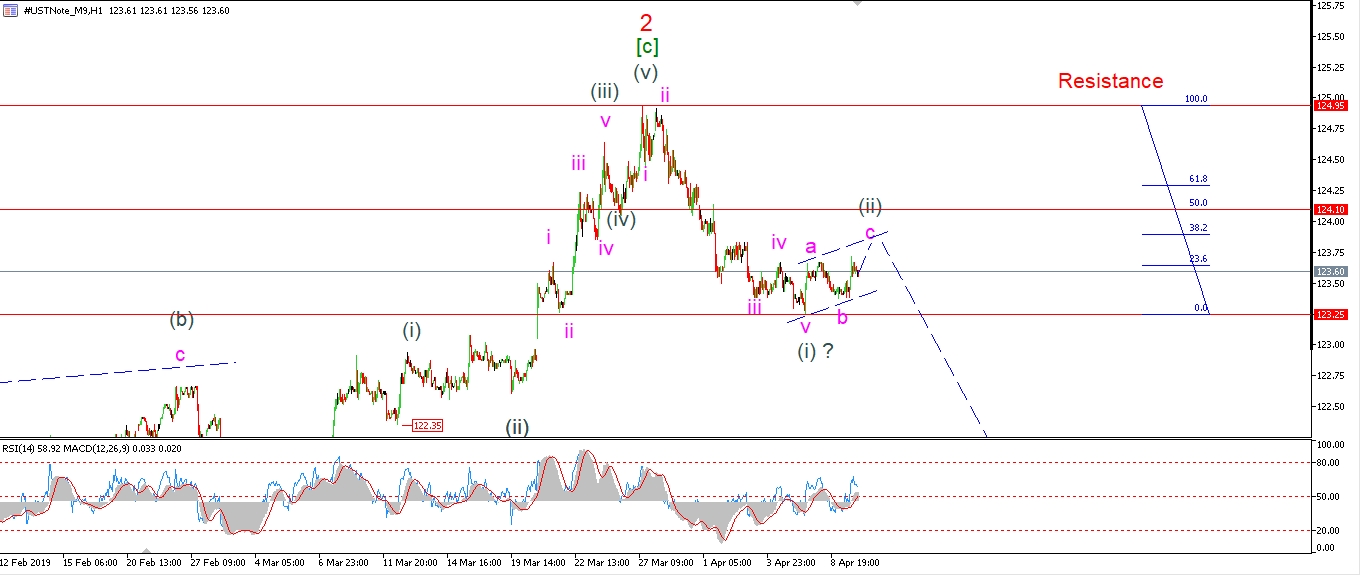 [/vc_column_text][/vc_column][vc_column width=”1/3″][vc_custom_heading text=”4 Hours” use_theme_fonts=”yes”][vc_column_text]
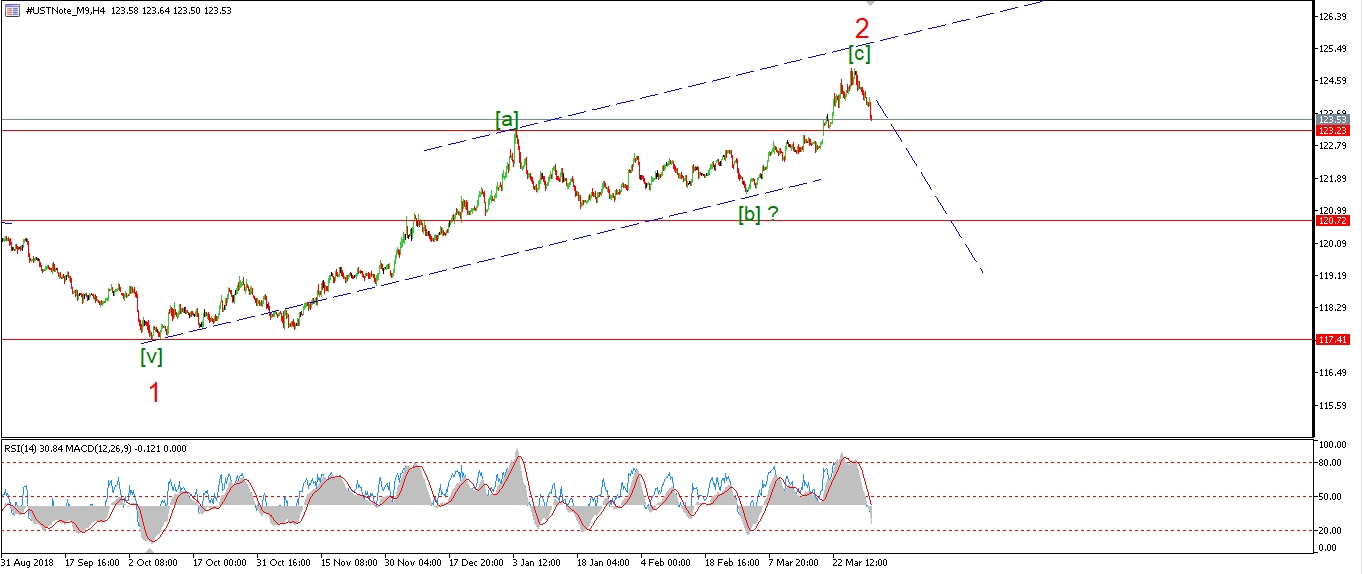 [/vc_column_text][vc_custom_heading text=”Daily” use_theme_fonts=”yes”][vc_column_text]
 [/vc_column_text][/vc_column][/vc_row]
[vc_row][vc_column][vc_column_text]
The three wave pattern in wave (ii) does not seem complete yet.
The price did make a weak new high today in wave ‘c’,
with a slight break of the wave ‘a’ high at 123.66.
So the minimum target has been met,
but I would expect a larger correction in a second wave in general.
With that in mind,
I will not rule out that 50% retracement level at 124.10 just yet.
Tomorrow;
Watch for wave ‘c’ of (ii) to complete with a tag of the upper trend channel line at about 123.90.
A break of 123.25 will signal that wave (iii) down has begun.
[/vc_column_text][/vc_column][/vc_row]
[/_s2If]
[_s2If current_user_can(access_s2member_ccap_silver)]
[vc_row][vc_column][vc_separator border_width=”5″][/vc_column][/vc_row][vc_row][vc_column][vc_column_text]
SILVER
[/vc_column_text][/vc_column][/vc_row][vc_row][vc_column][vc_separator border_width=”5″][/vc_column][/vc_row][vc_row][vc_column width=”2/3″][vc_custom_heading text=”1 hr” use_theme_fonts=”yes”][vc_column_text]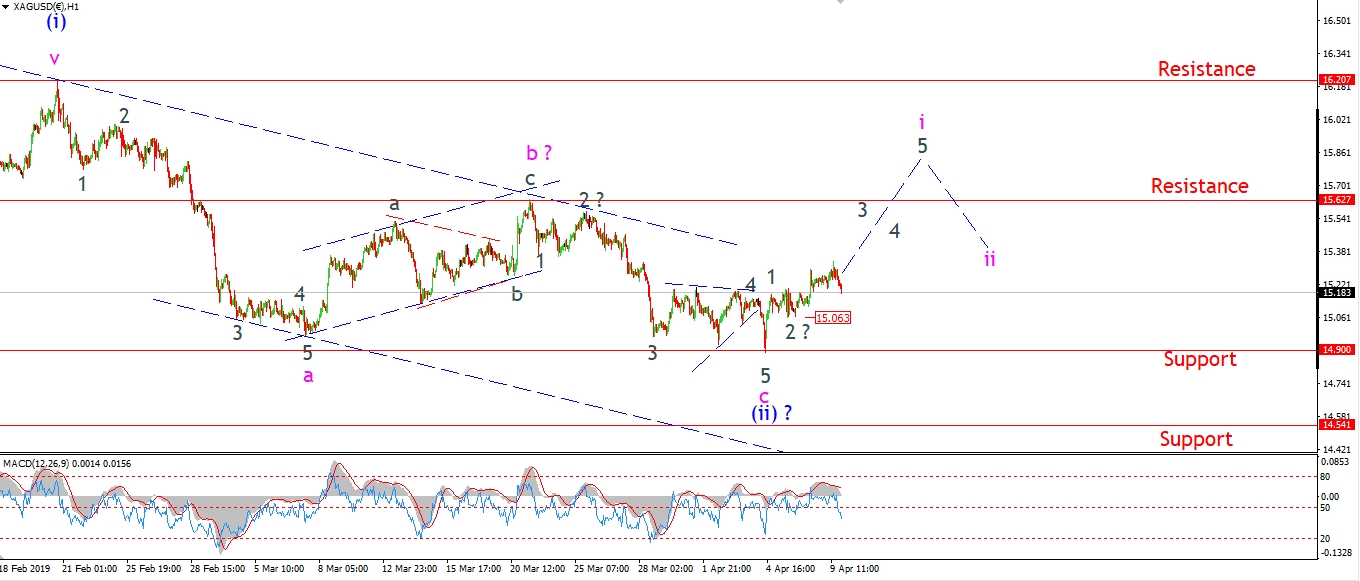 [/vc_column_text][/vc_column][vc_column width=”1/3″][vc_custom_heading text=”4 Hours” use_theme_fonts=”yes”][vc_column_text]
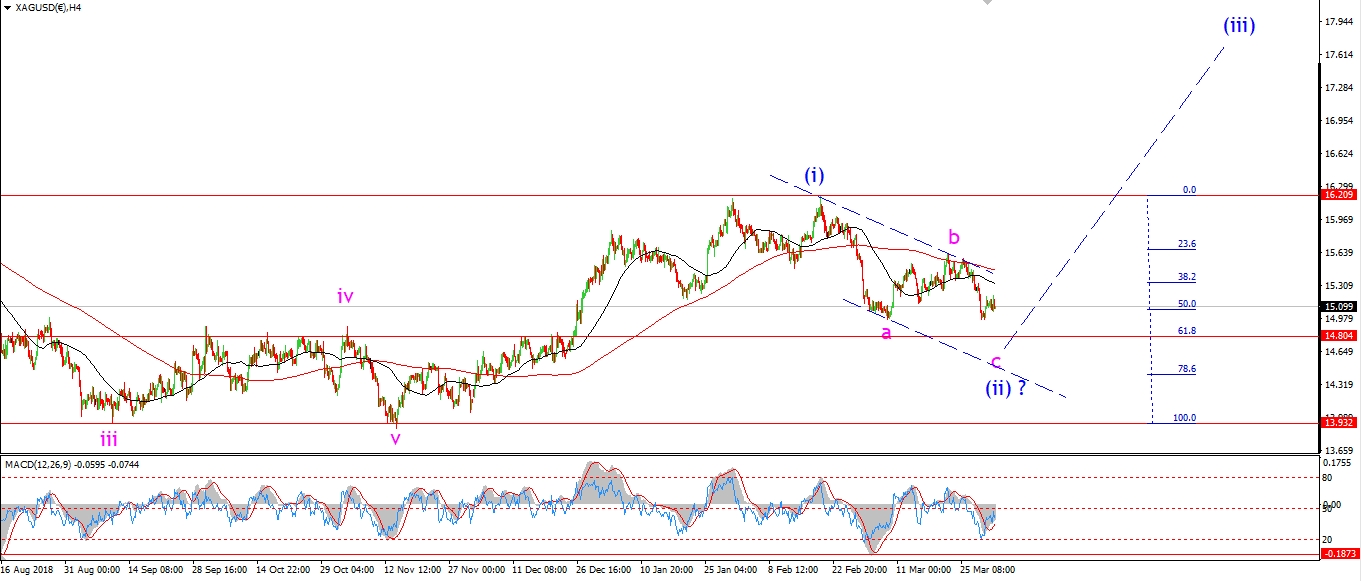 [/vc_column_text][vc_custom_heading text=”Daily” use_theme_fonts=”yes”][vc_column_text]
 [/vc_column_text][/vc_column][/vc_row]
[vc_row][vc_column][vc_column_text]
Silver is finding it hard to get off the ground in wave ‘i’ of (iii).
The pattern off the recent low at wave (ii) is still in three waves.
So the price must continue higher to create a clear five waves up.
It is possible that wave ‘3’ of ‘i’ is creating an extension,
with another higher low now tracing out.
Price must hold above 15.06 for that pattern remain valid.
Tomorrow;
Watch for wave ‘3’ of ‘i’ to return higher again and push towards resistance.
[/vc_column_text][/vc_column][/vc_row]
[/_s2If]
[_s2If current_user_can(access_s2member_ccap_sp500)]
[vc_row][vc_column][vc_separator border_width=”5″][/vc_column][/vc_row][vc_row][vc_column][vc_column_text]
S&P 500.
[/vc_column_text][/vc_column][/vc_row][vc_row][vc_column][vc_separator border_width=”5″][/vc_column][/vc_row][vc_row][vc_column width=”2/3″][vc_custom_heading text=”1 hr” use_theme_fonts=”yes”][vc_column_text]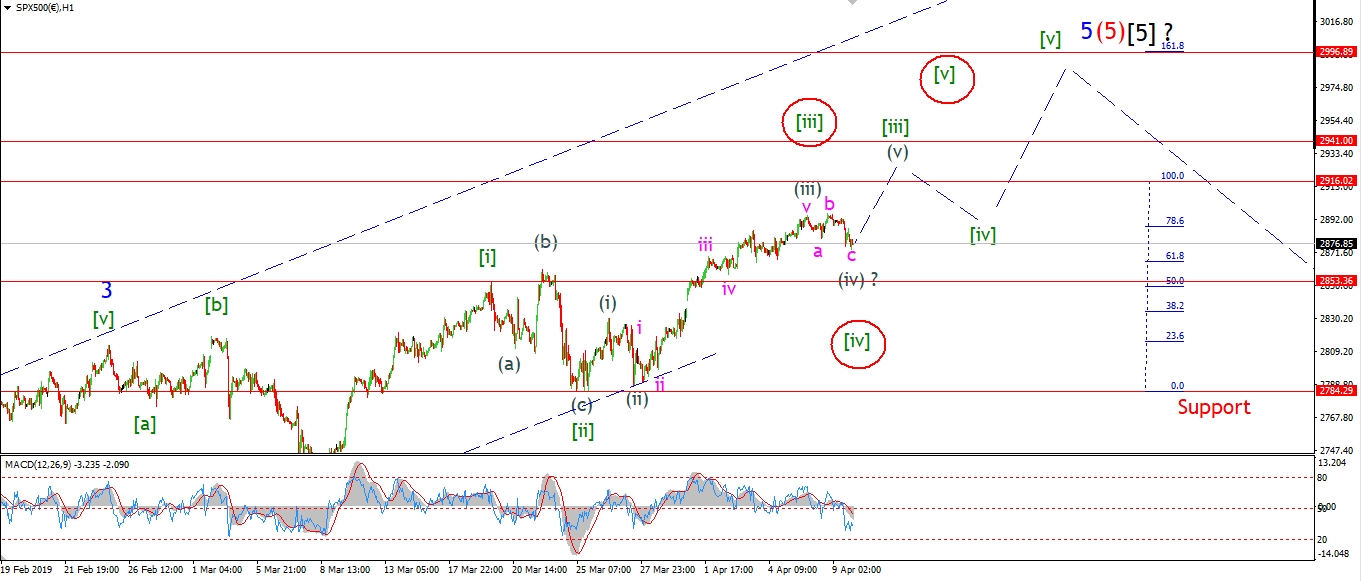 [/vc_column_text][/vc_column][vc_column width=”1/3″][vc_custom_heading text=”4 Hours” use_theme_fonts=”yes”][vc_column_text]
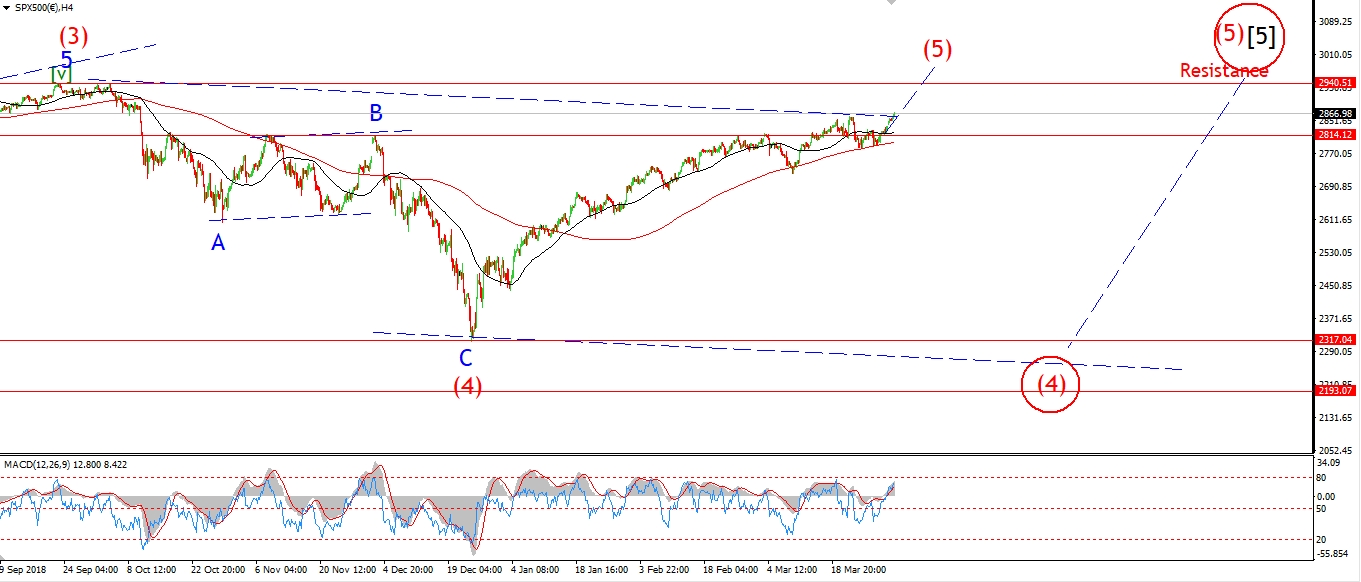 [/vc_column_text][vc_custom_heading text=”Daily” use_theme_fonts=”yes”][vc_column_text]
 [/vc_column_text][/vc_column][/vc_row]
[vc_row][vc_column][vc_column_text]
I have shown a slightly different interpretation of the short term action this evening.
The market is lower today but this drop is shown as wave ‘c’ of (iv).
With the recent high labelled wave (iii).
Wave (v) should turn higher tomorrow to close out the larger wave [iii] aver the next few days.
The alternate count shows this correction as wave [iv] at one degree higher.
It seems unlikely given the size of wave [ii].
But still possible, if the general deceleration continues,
we might just limp to a final new high in wave [v] to close out the rally sooner than anticipated.
Tomorrow;
Watch for wave (iv) to complete above 2853.
We should see the initial turn higher in wave (v).
[/vc_column_text][/vc_column][/vc_row]
[/_s2If]
[vc_row][vc_column][vc_column_text]
[/vc_column_text][/vc_column][/vc_row]
[vc_row][vc_column][vc_separator border_width=”5″][/vc_column][/vc_row]