
Good evening to you all folks, and the Lord’s blessings to you all tonight.
EURUSD.
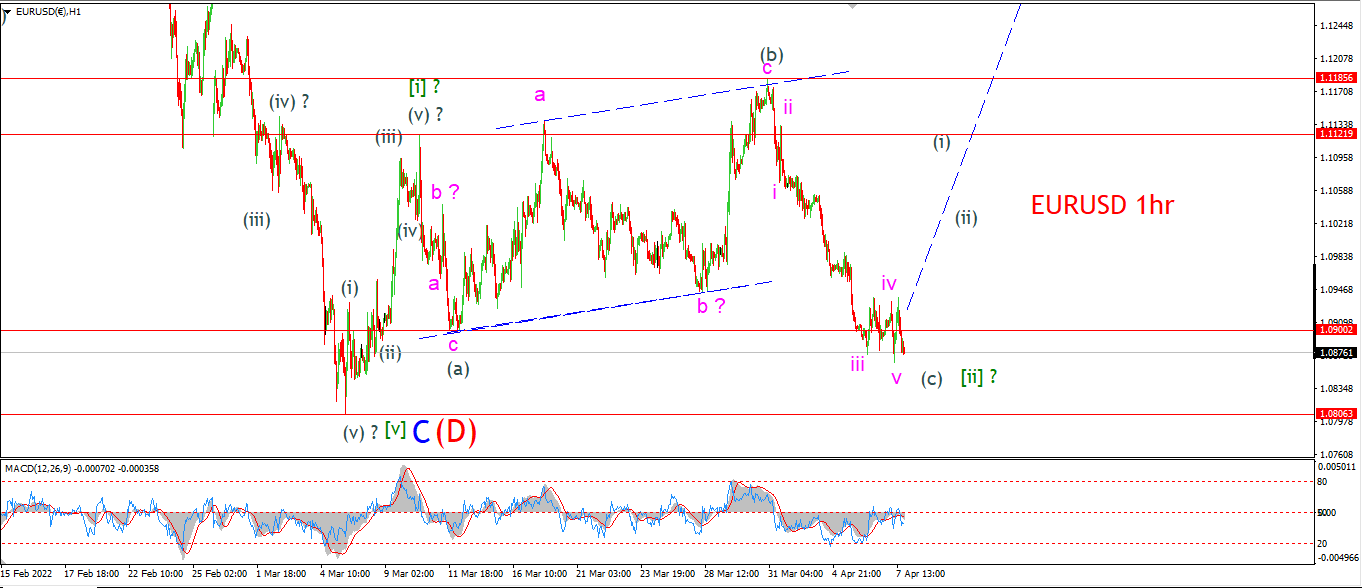
EURUSD 1hr.
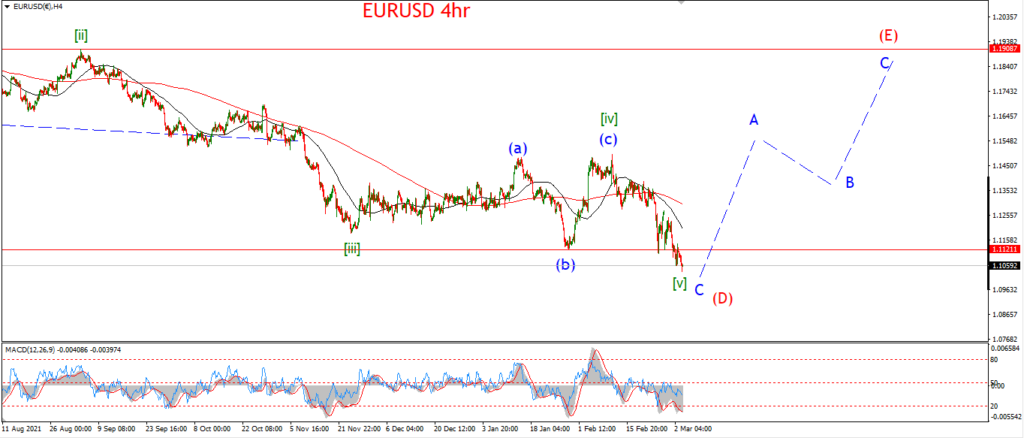
EURUSD 4hr.
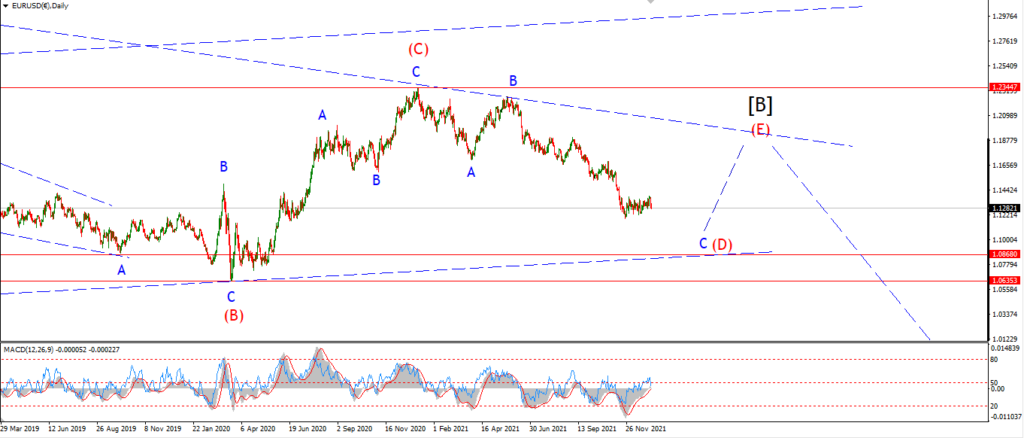
EURUSD daily.
EURUSD is quietly forming a bottom now in wave (c) of [ii].
The key level for this count lies at 1.0806,
so as long as the price holds above that level this count remains the best fit pattern.
I am still a little anxious for the rally into wave [ii] to begin now,
so I want to see that initial move higher into wave (i) of [iii] beginning tomorrow.
Tomorrow;
Watch for 1.0806 to hold again.
1.1122 marks the high of wave [i],
so a break of that level will signal wave [iii] is underway.
GBPUSD
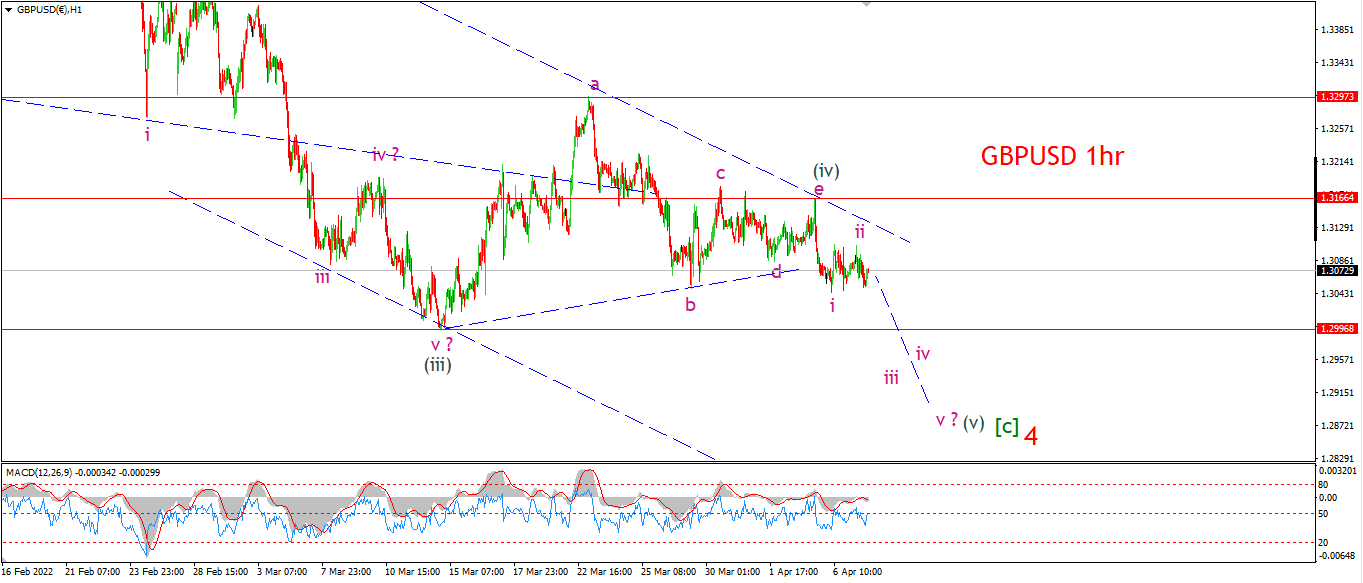
GBPUSD 1hr.
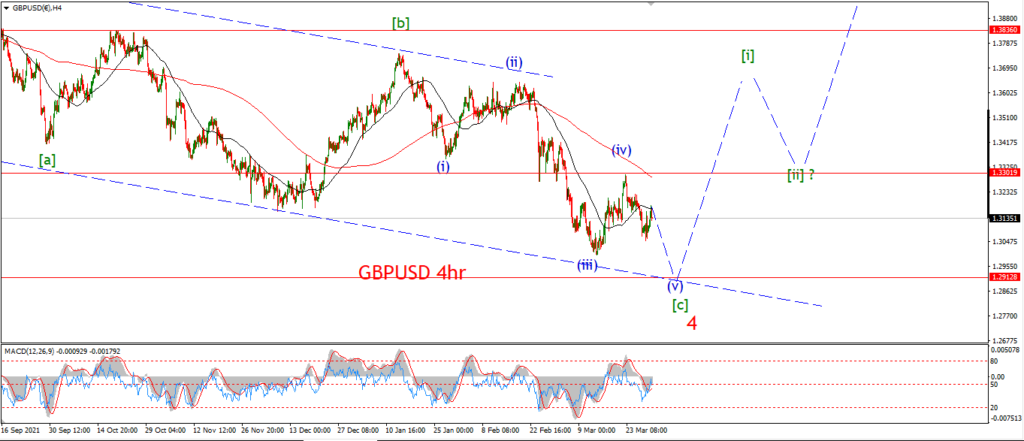
GBPUSD 4hr.
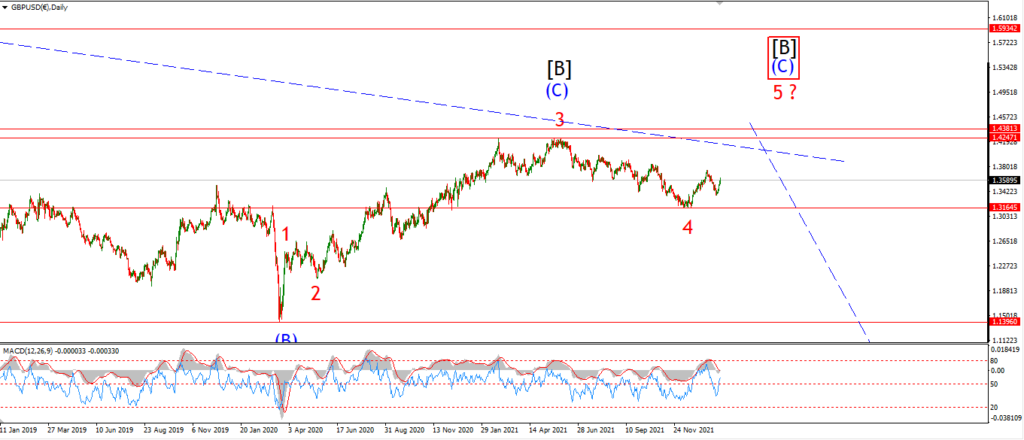
GBPUSD daily.
Cable is grinding sideways again today without much further movement into the pattern.
but I am more convinced now that the triangle interpretation for wave (iv) is the correct one.
Wave ‘i’ and ‘ii’ have traced out a classic impulse wave down.
So I am waiting for wave ‘iii’ to achieve the minimum target at 1.2996 tomorrow.
Tomorrow;
Watch for wave ‘iii’ of (v) to fall below 1.2996 again.
This pattern will likely take us into next week before we find a low in wave (v).
USDJPY.
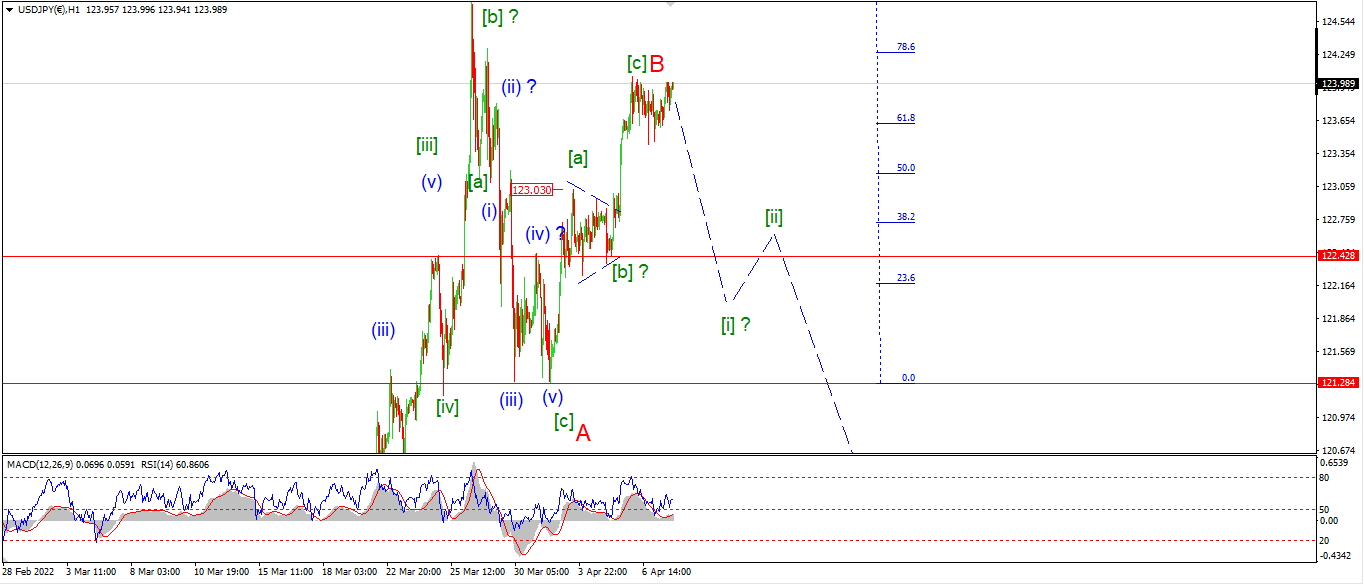
USDJPY 1hr.
USDJPY 4hr.
USDJPY daily.
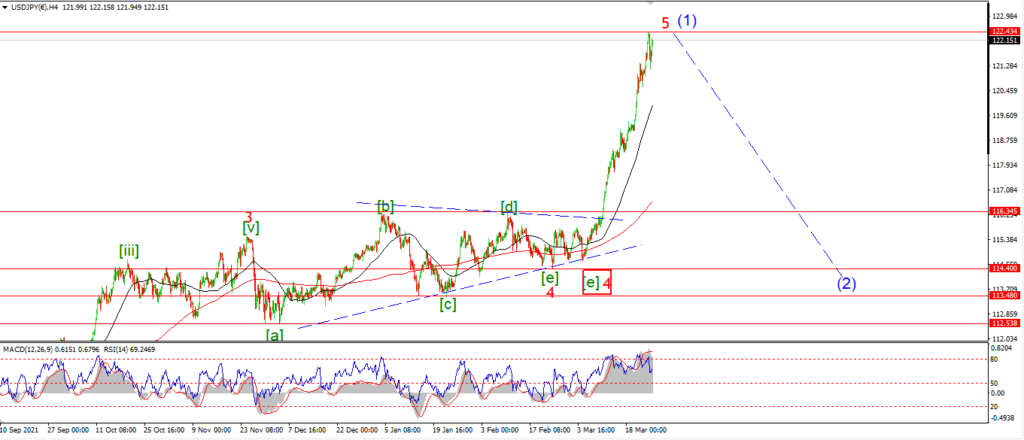
I am waiting,
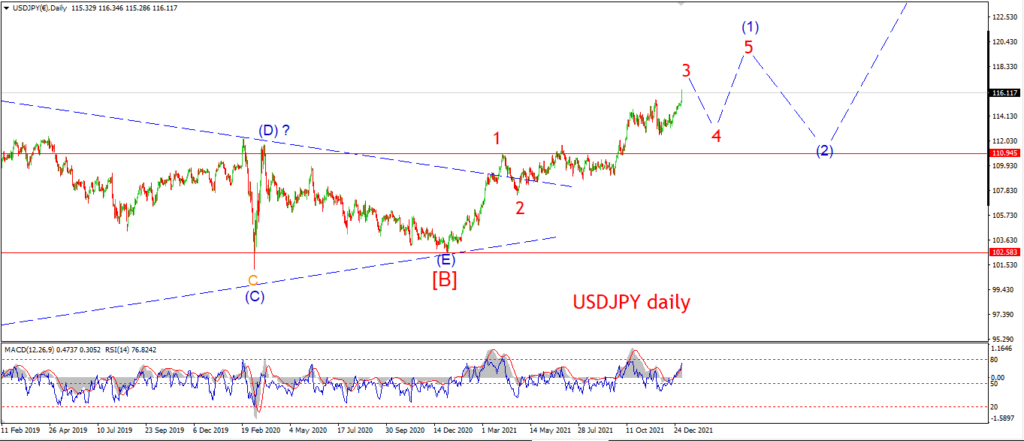
but USDJPY is not budging off the top of wave ‘B’ for another day.
I want to see this top complete tomorrow,
Wave [c] of ‘B’ may have a little more upside left in it,
but it cannot be much given that fact that the internal pattern of wave ‘B’ is a solid three wave pattern.
Also,
wave [a] and [c] have reached equality.
and the price has hit the expected Fib retracement level of wave ‘A’.
Tomorrow;
Watch for a decline off the top to break 123.00 again to signal wave [i] of ‘C’ is underway.
DOW JONES.
DOW 1hr.
DOW 4hr
DOW daily.
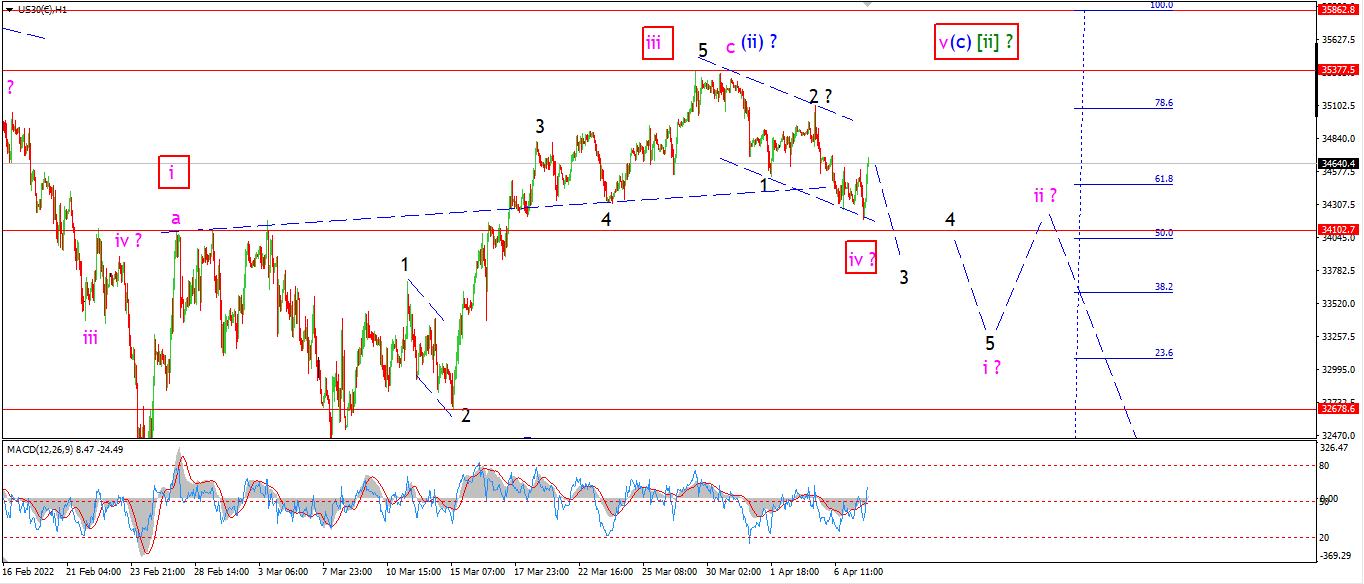
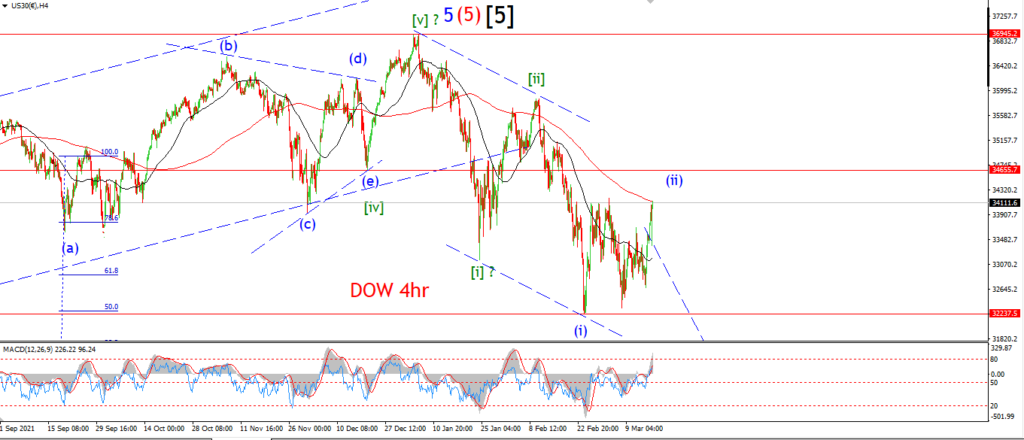
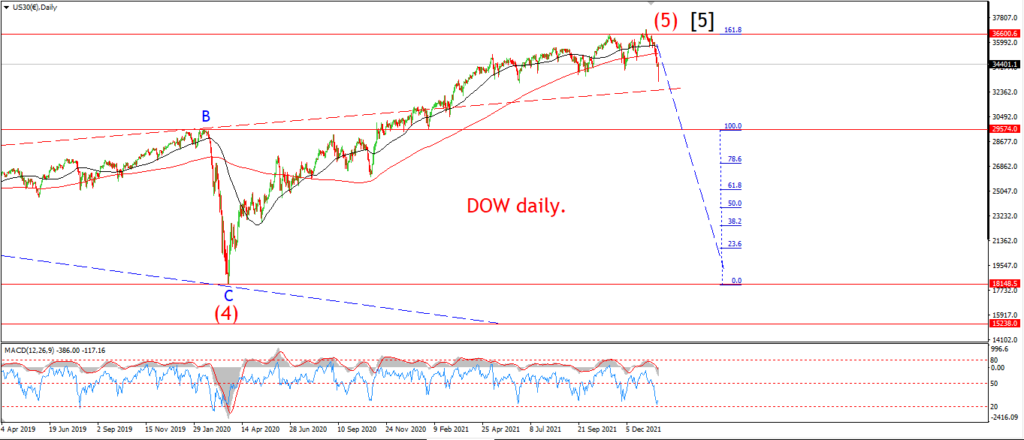
The price has failed to break down below the trend channel today,
which means the pattern off the top can still be counted as a three wave correction.
I have not given up on the main count yet though,
as I think it does have merit.
And if we see a break of that 34100 level again then the bearish interpretation is very much the favorite count.
the longer we go on here without extending lower into a five wave decline in wave ‘i’,
the more likely that this count will be invalidated.
So I want to see this wave ‘i’ pattern complete pretty soon!
Tomorrow;
Watch for wave ‘3’ of ‘i’ to fall out of the trend channel and break below 34100 again.
It looks like I will have to wait until next week now until this bearish count is confirmed.
GOLD
GOLD 1hr.
GOLD 4hr.
GOLD daily.
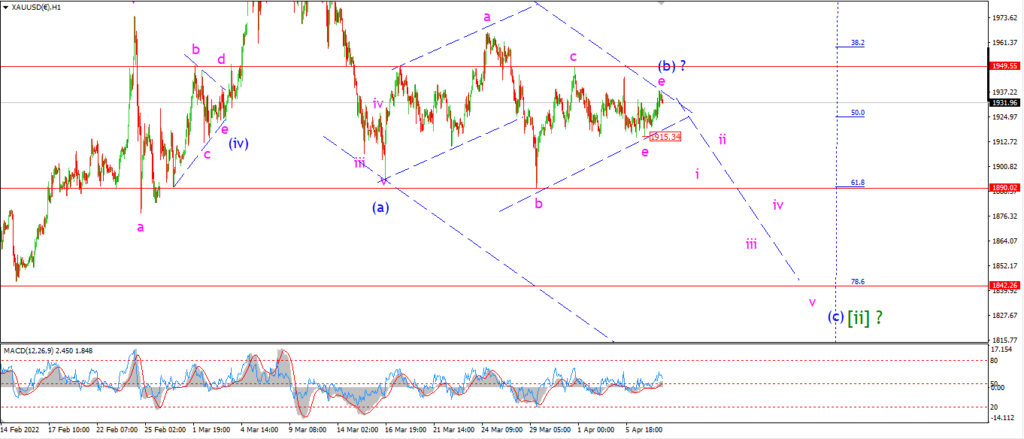
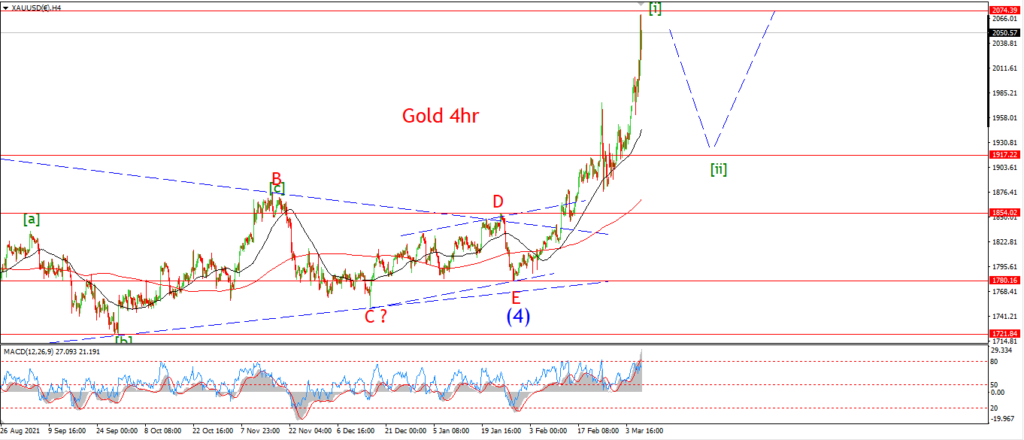
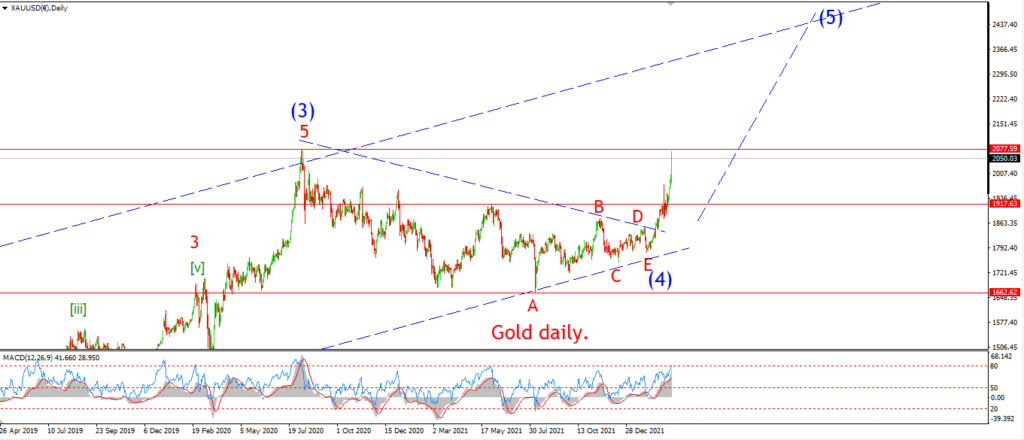
I have switched to the alternate count for wave (b) tonight.
The price action has created a further lower high at todays high at wave ‘e’.
And the overall pattern is in keeping with a triangle correction.
This pattern does suggest an immanent decline is coming in wave (c) over the next week.
And at the moment I am targeting the 78.6% Fib retracement level at 1842 to complete this pattern.
Tomorrow;
Watch for wave (b) to complete and wave (c) down to begin.
1949.50 must hold at the wave ‘c’ high.
and a break of the wave ‘e’ low at 1915 will signal wave (c) is underway.
CRUDE OIL.
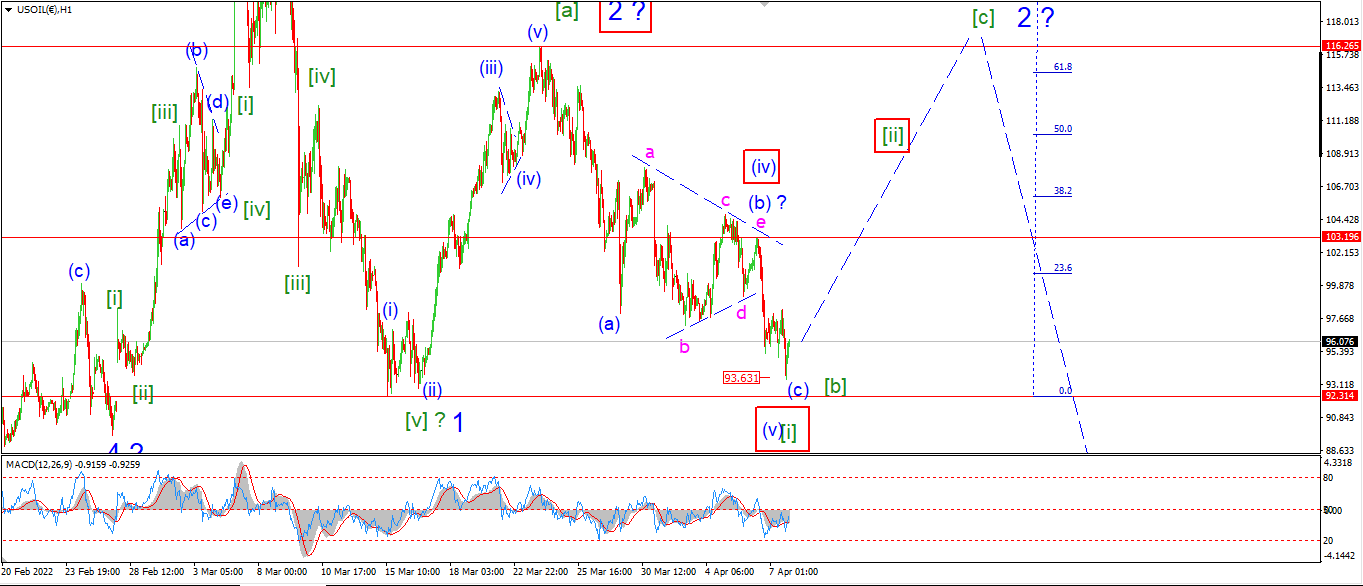
CRUDE OIL 1hr.
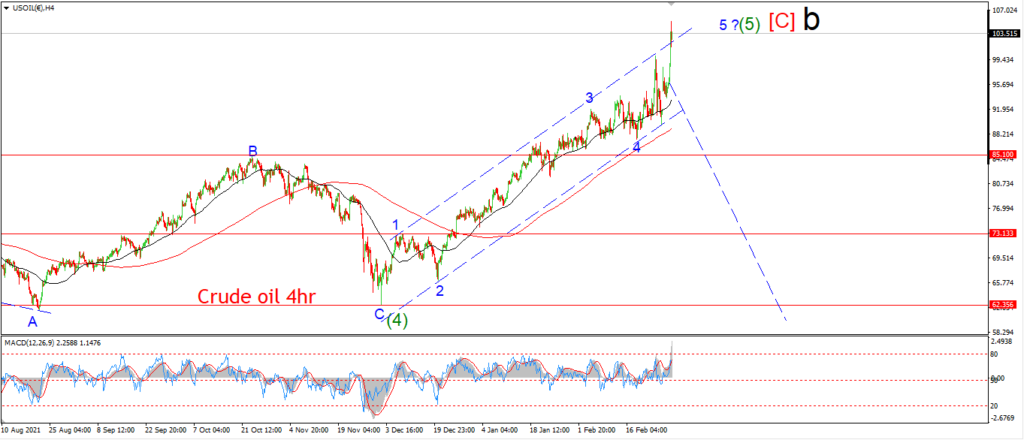
CRUDE OIL 4hr.

CRUDE OIL daily.
While the market hangs on for dear life above that 92.30 level for another day,
crude is still very close to triggering that alternate count here.
With that in mind,
I want to concentrate on that alternate count now.
the low of the session came within 30c of the invalidation line at the wave ‘1’ low.
So we are way too close for comfort here!
I have changed the alternate count this evening also to show todays low as a possible wave [i] down.
The reason is,
I can see a completed five wave pattern off the wave [a] high.
which includes a triangle wave (iv) where the wave (b) label is.
And the decline into todays low can be read as wave (v).
Tomorrow;
The main count is valid until the price breaks 92.30 again.
If that happens,
I will then look for a correction higher in wave [ii].
S&P 500.
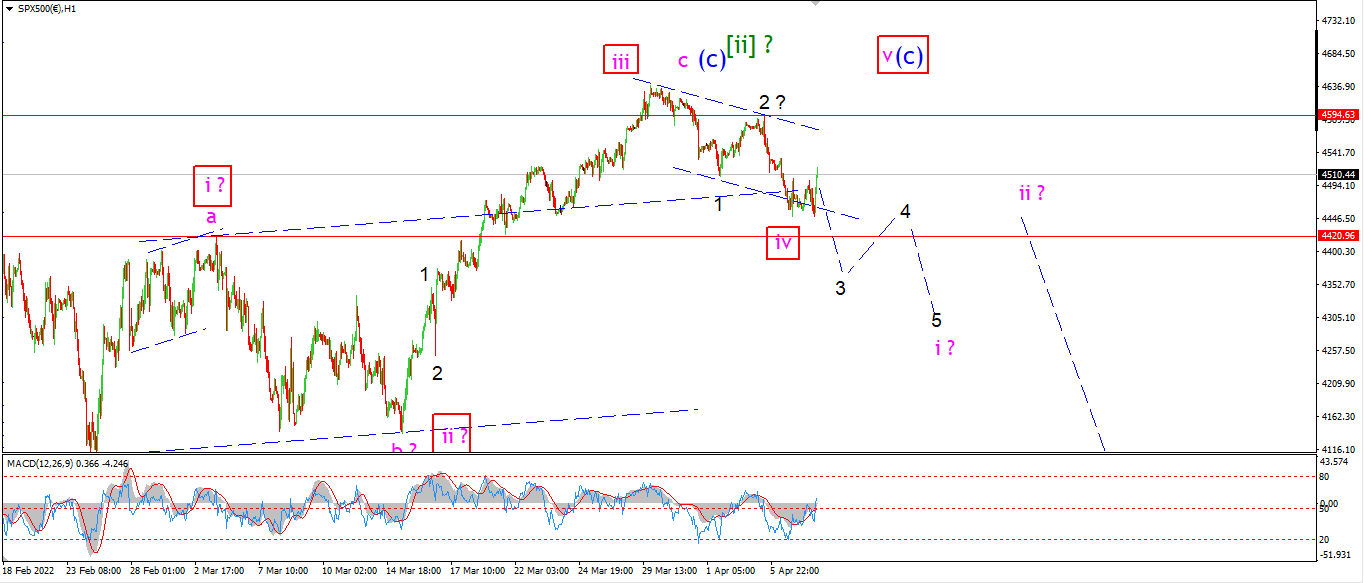
S&P 500 1hr
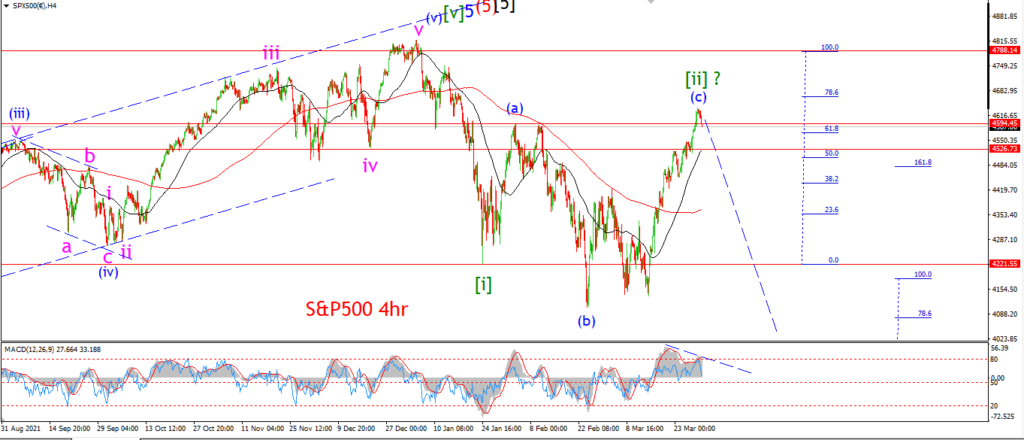
S&P 500 4hr
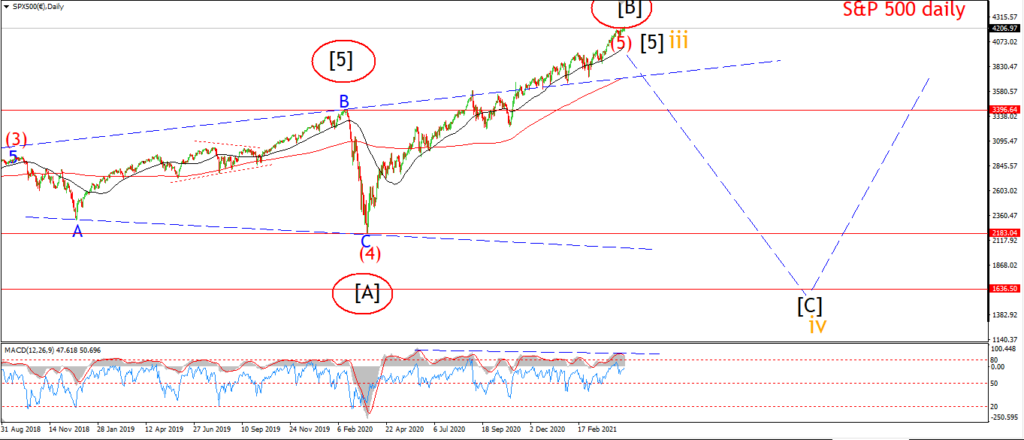
S&P 500 daily.
The S&P is following the them of ‘stuck in limbo’ tonight.
This evening the balance is shifting very slightly in favor of the alternate count.
the price did not manage to break to the downside out of the trend channel yet,
but I am willing to give this bearish pattern a chance.
If the market continues to rally tomorrow,
then I will switch to that alternate count for wave (c).
Tomorrow;
Watch for a break of that confirmation line at 4420 and a continued decline in five waves to complete wave ‘i’.
SILVER.
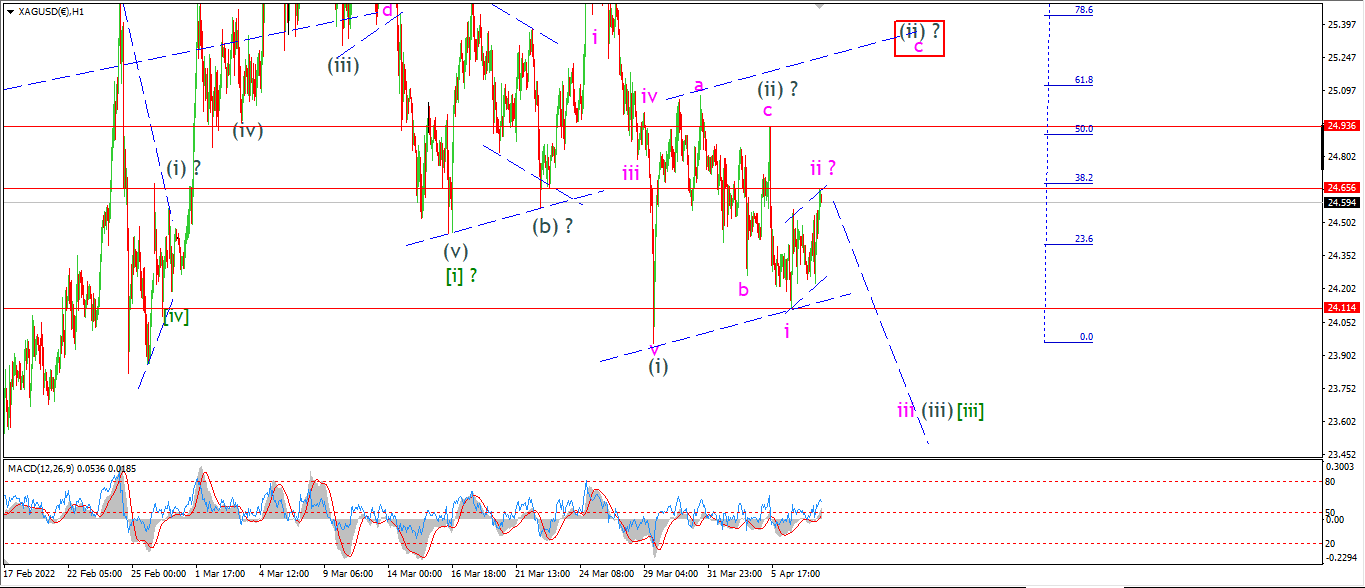
SILVER 1hr
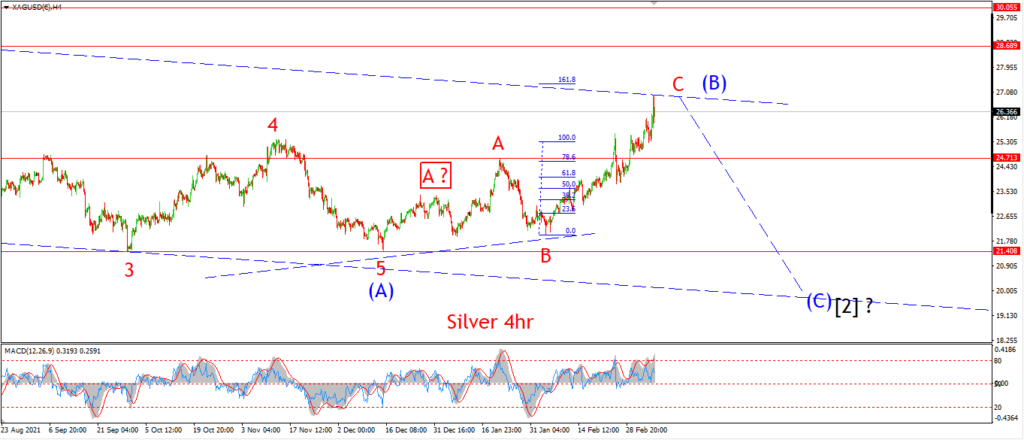
SILVER 4hr.
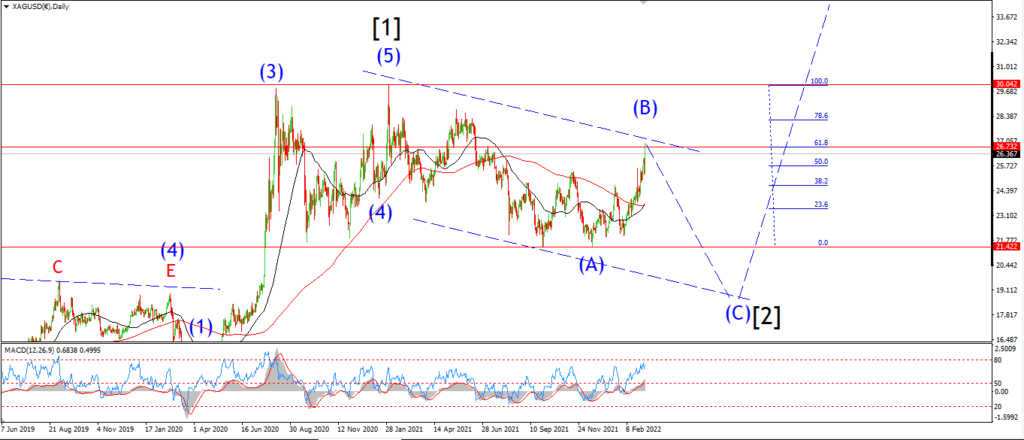
SILVER daily.
Silver completed three waves up and filled a trend channel at the session high.
The rally has now halted,
and if wave ‘ii’ is complete then we should see a return lower tomorrow to begin wave ‘iii’ of (iii) of [iii].
this count is at a critical point this evening.
As the next leg down into wave (iii) could be a rapid acceleration.
Tomorrow;
Watch for wave ‘ii’ to hold and wave ‘iii’ down to begin with a break of the wave ‘i’ low at 24.11.
BITCOIN
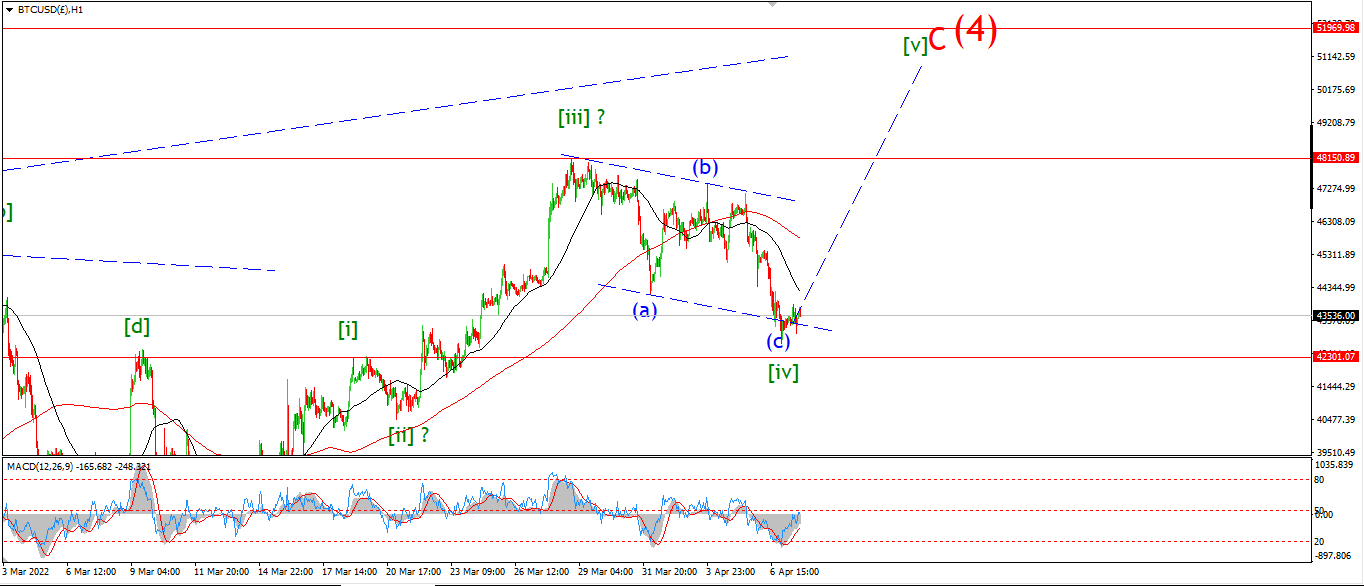
BITCOIN 1hr.
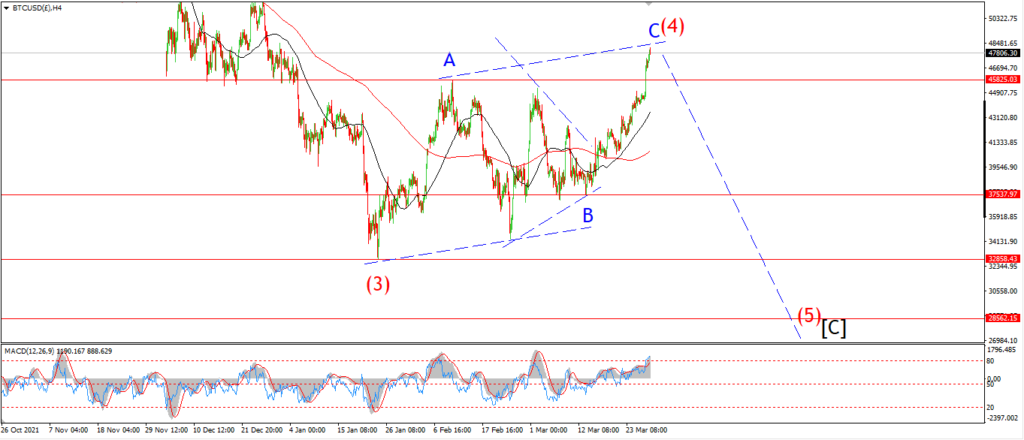
BITCOIN 4hr.

BITCOIN daily.
….
FTSE 100.
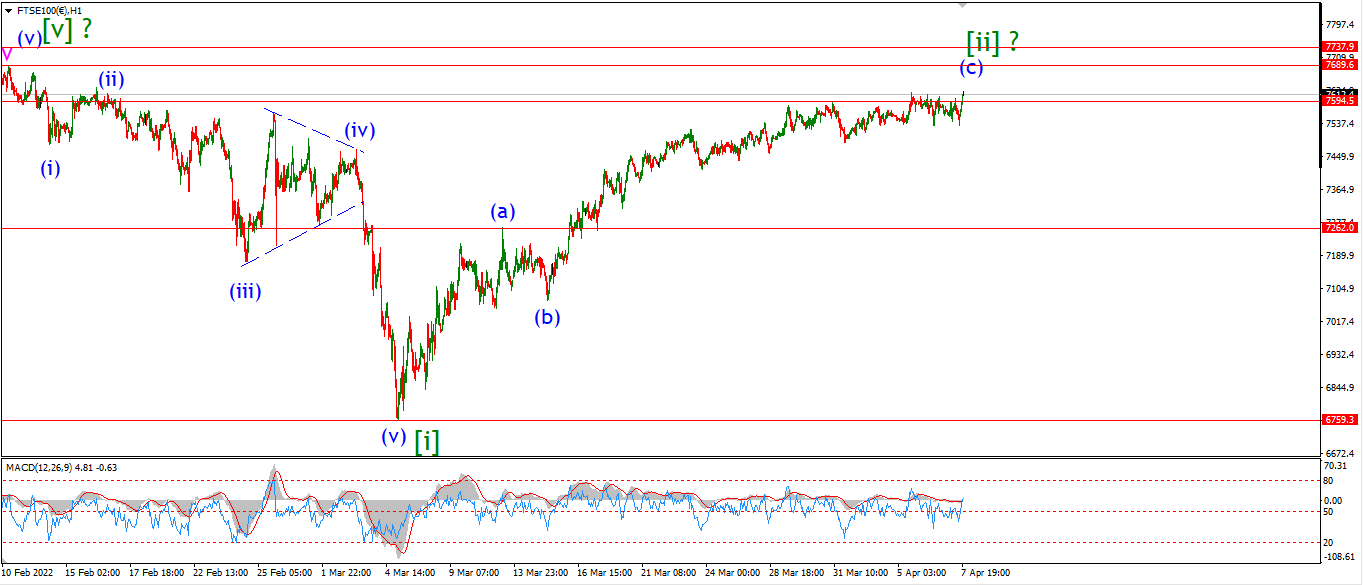
FTSE 100 1hr.
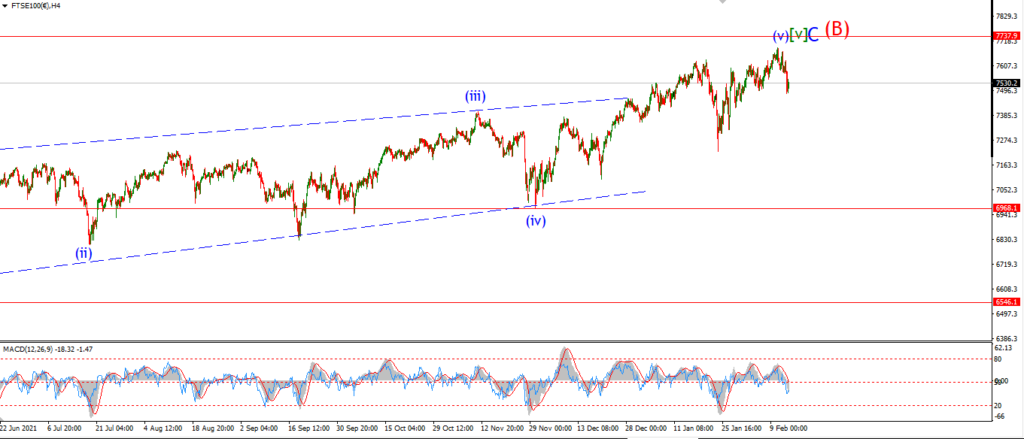
FTSE 100 4hr.

FTSE 100 daily.
….
DAX.
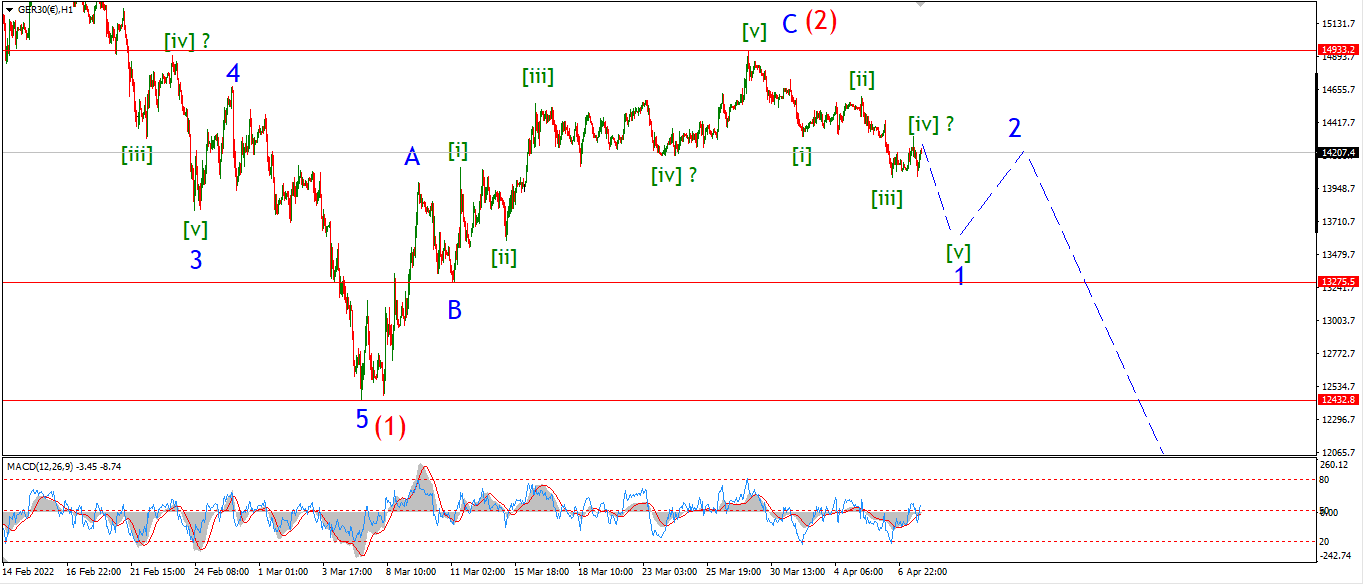
DAX 1hr
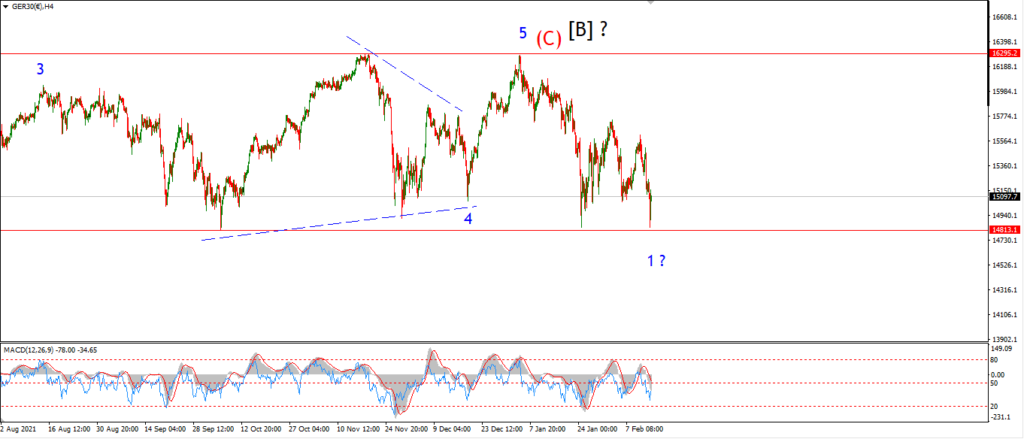
DAX 4hr
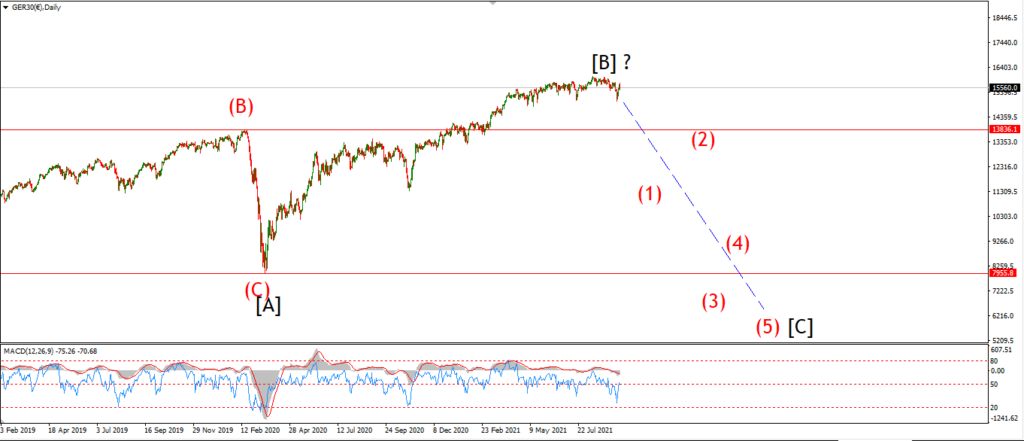
DAX daily.
….
NASDAQ 100.
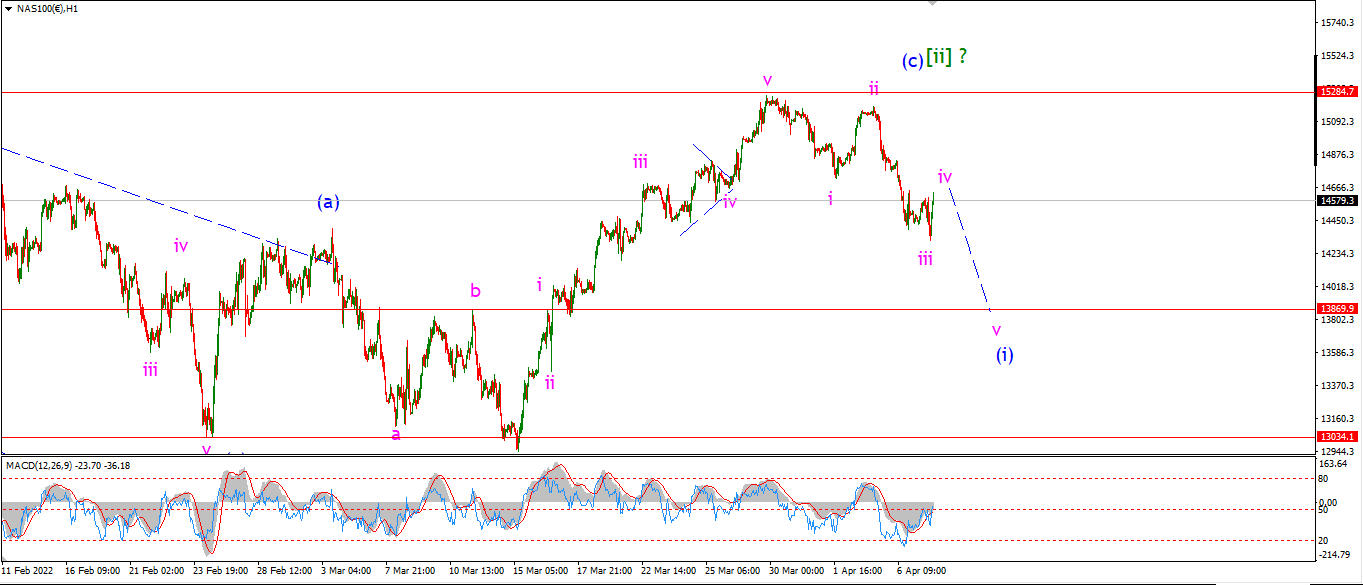
NASDAQ 1hr
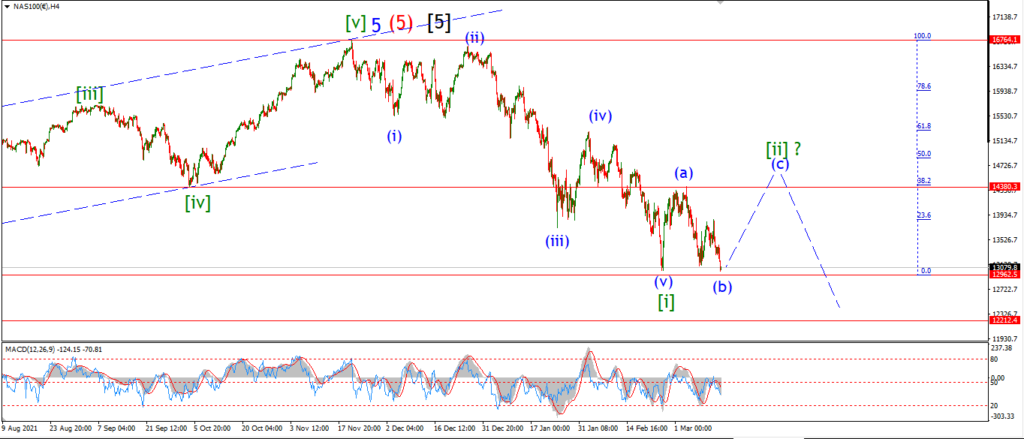
NASDAQ 4hr.
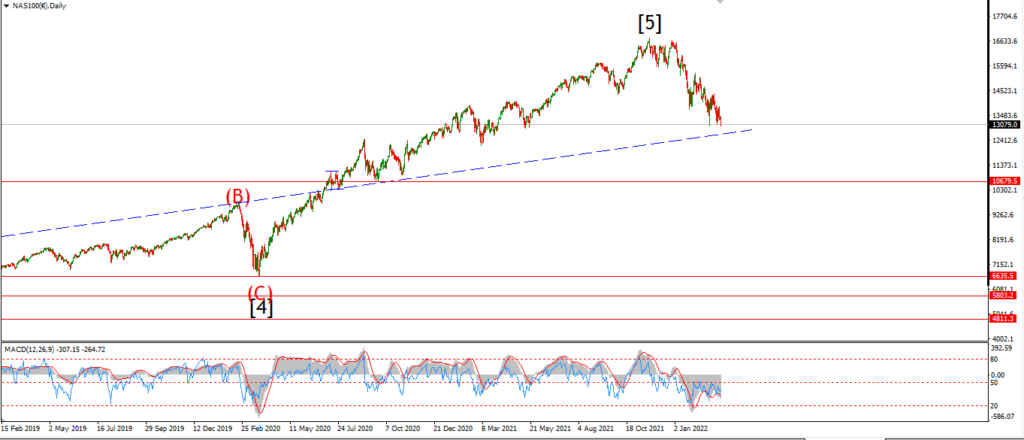
NASDAQ daily.
….