
Good evening to one and all.
The Lord’s Blessing’s to you all again tonight.
Some interesting charts to start the day!
Now THAT’S deflationary.

‘Short interest remains near multi-year lows.’

https://twitter.com/bullwavesreal
EURUSD.
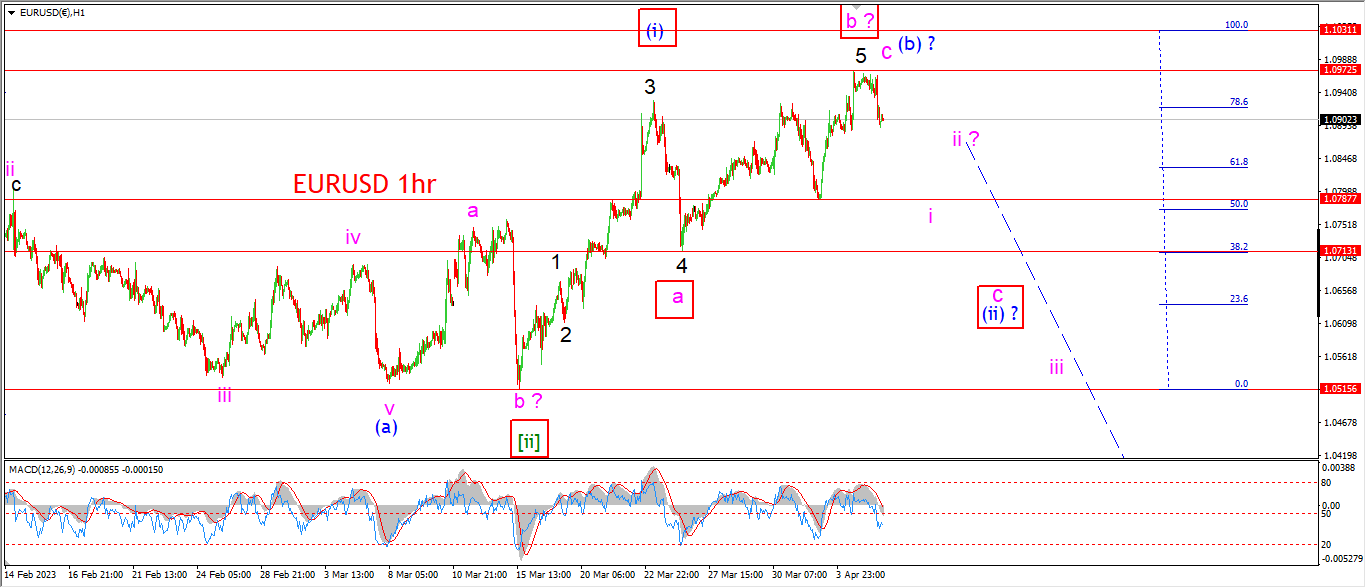
EURUSD 1hr.
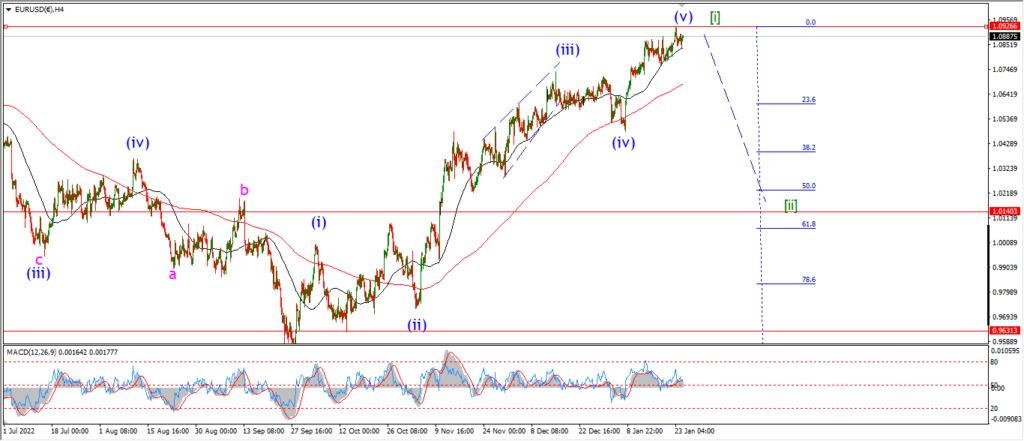
EURUSD 4hr.

EURUSD daily.
EURUSD is failing below the 100% retracement level today.
The price actually managed a small retreat off the highs at wave (b).
The margins are too tight here to read much into that decline.
But if we see a break below 1.0787 again,
that will be a more interesting signal pointing to a reversal into wave (c) of [ii].
That alternate count for wave (i) actually calls for a break below 1.0713 again,
so we can expect a higher low to build in that 1.07 area at a minimum.
Tomorrow;
Watch for wave ‘i’ of to fall back towards 1.0713 again to begin a five wave decline in wave (c).
GBPUSD
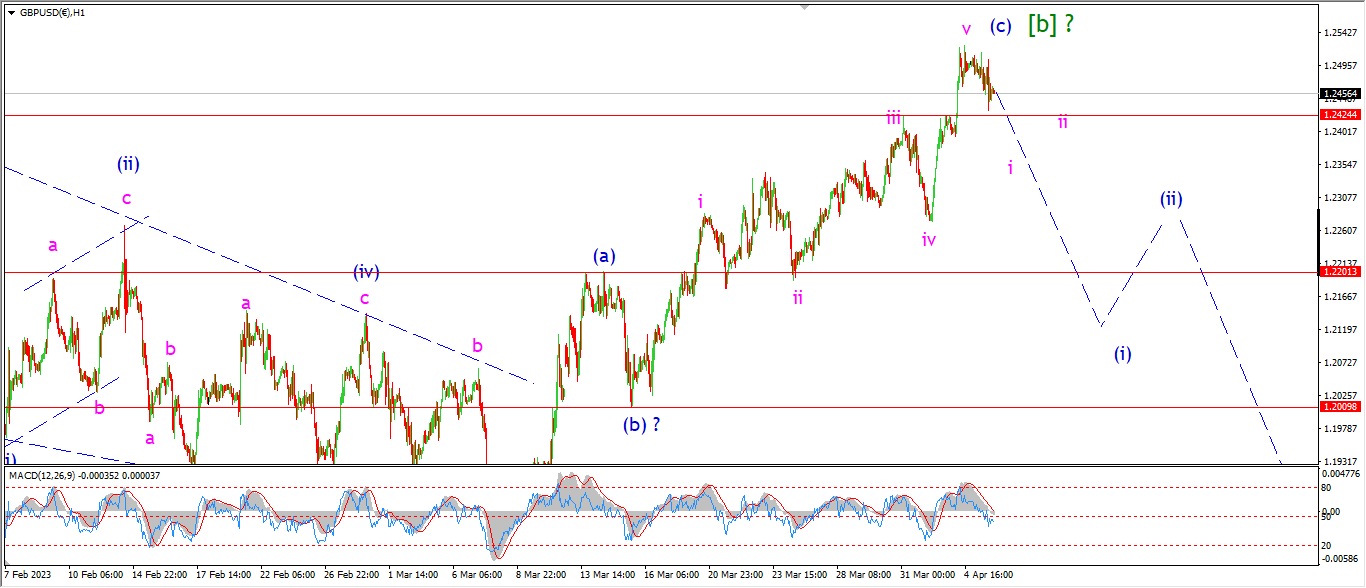
GBPUSD 1hr.
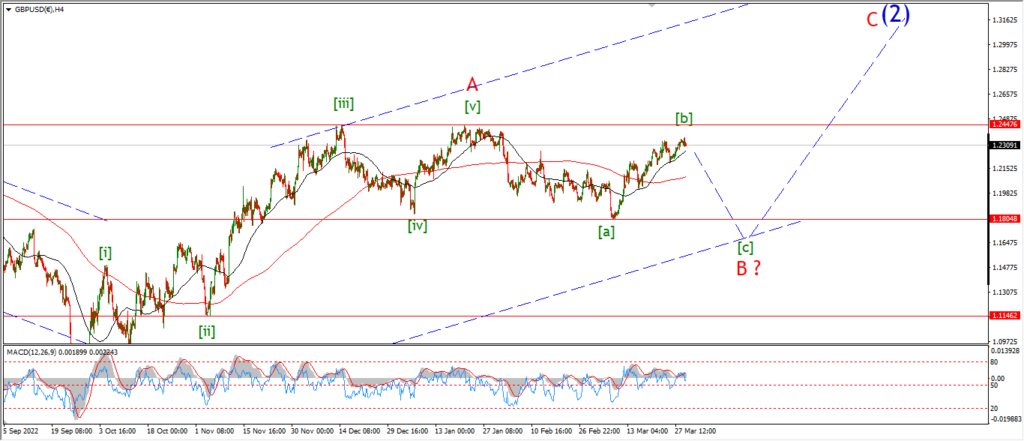
GBPUSD 4hr.

GBPUSD daily.
Its a similar setup in cable tonight with a small decline but not nearly enough to get worked up about yet.
The price has found support at the high of wave ‘iii’ pink today.
So far the action looks pretty corrective to be honest.
And I would expect at least a break of that level to indicate the price pattern is reversing off the top.
I want to see a five wave decline in wave (i) to break below the wave (a) top at 1.2201 again.
When that happens,
then we will have a pretty solid signal that the larger wave [c] has begun.
Tomorrow;
Watch for a bearish head and shoulders to form around the top at wave [b].
Wave ‘i’ and ‘ii’ should complete that lower high I am suggesting.
And then wave ‘iii’ of (i) will confirm the pattern with a break of 1.2200.
USDJPY.
USDJPY 1hr.
USDJPY 4hr.

USDJPY daily.
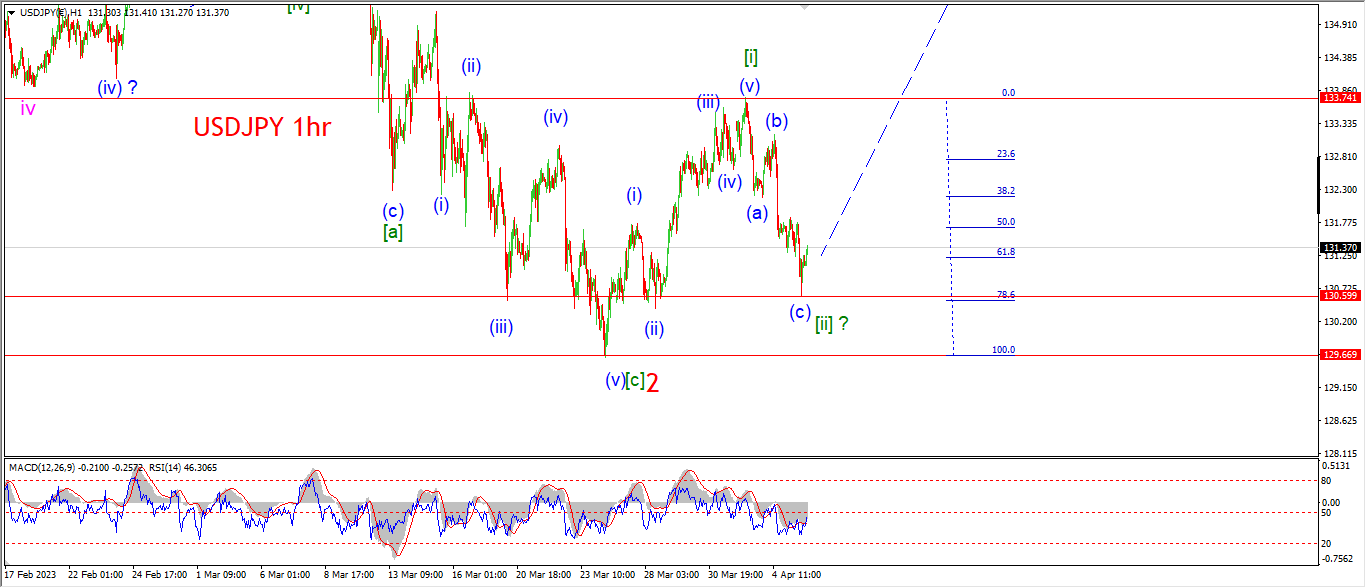
I am getting a little anxcious here after todays further dropbelow 131.00 again.
The decline in wave [ii] has retraced to the 78.6% level so far.
The margin for error here is getting too close for comfort now.
The low of the session has found some support at the previous wave (ii) low today.
And the price has bounced off that level also.
So all is not lost for this possible bullish reversal pattern.
It is imperative now that the market rally off this point and begin working higher into wave [iii] as expected.
Tomorrow;
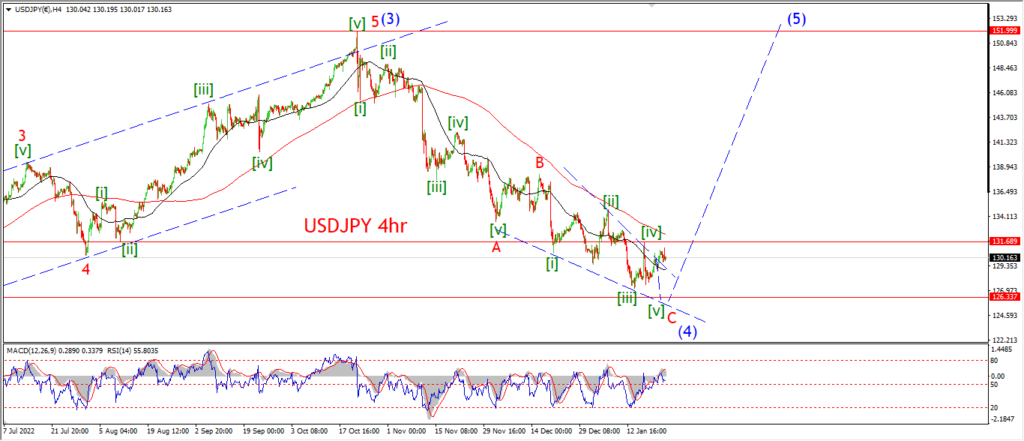
the price must hold above 129.66 at the wave ‘2’ low.
If wave [iii] of ‘3’ is about to take over here for a sustained rally,
then the initial rally must begin now into wave (i) of [iii] of ‘3’.
This pattern will be confirmed with a break of 133.74.
DOW JONES.
DOW 1hr.
DOW 4hr
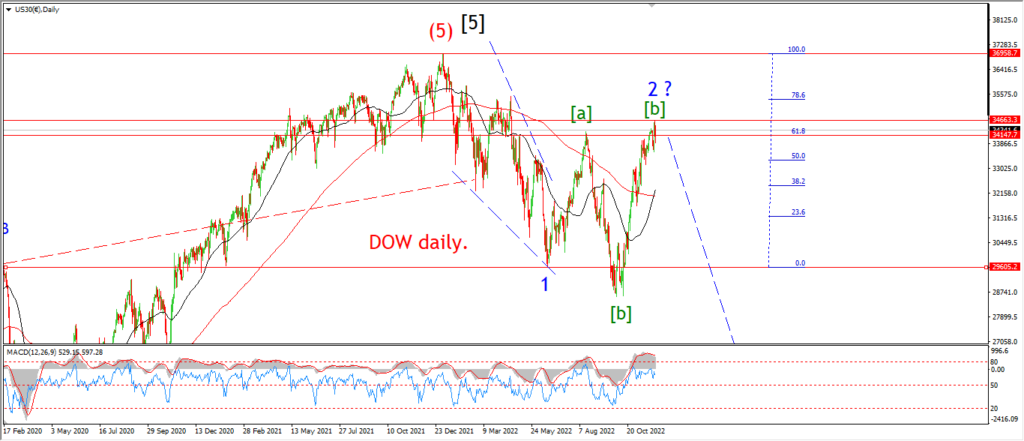
DOW daily.
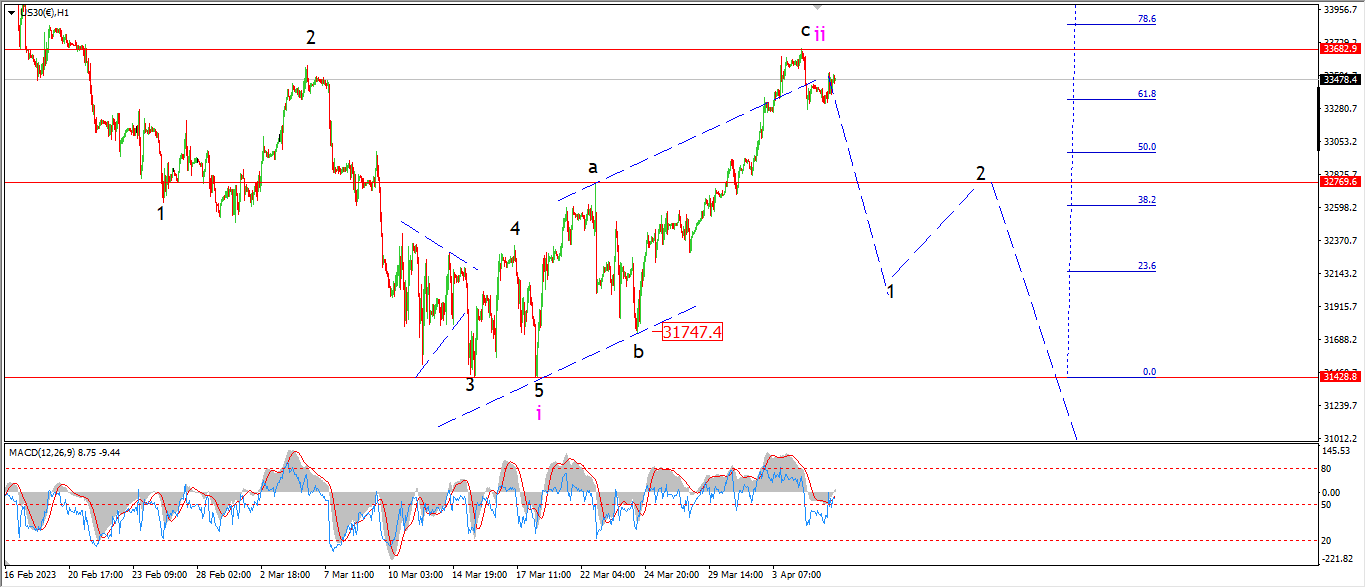
Not a whole lot of change here but at least a small reversal pattern is developing today.
The market is holding below the high at wave ‘ii’ again today,
that decline is not enough to seriously boost the short term wave count probability yet.
I will need to see a break of 32770 again to do that.
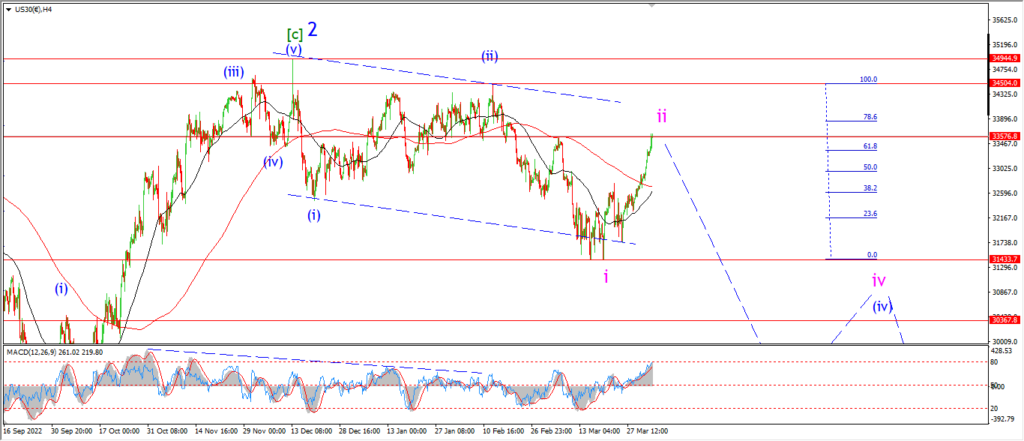
The initial drop into wave ‘iii’ should cause a bearish head and shoulders pattern over the next week.
the neckline of that pattern lies at 31747 at wave ‘b’ of ‘ii’.
So there is a little light at the end of the tunnel here,
but a whole lotta work left to do also!
Tomorrow;
It remains to be see if the high of wave ‘ii’ will hold at 33680.
I want to see wave ‘1’ of ‘iii’ continue lower and break 32770 at a minimum.
A preferred target for wave ‘1’ of ‘iii’ lies below 32000 again.
Like I said,
a lot of work to be done yet to confirm wave ‘iii’.
GOLD
GOLD 1hr.
GOLD 4hr.

GOLD daily.
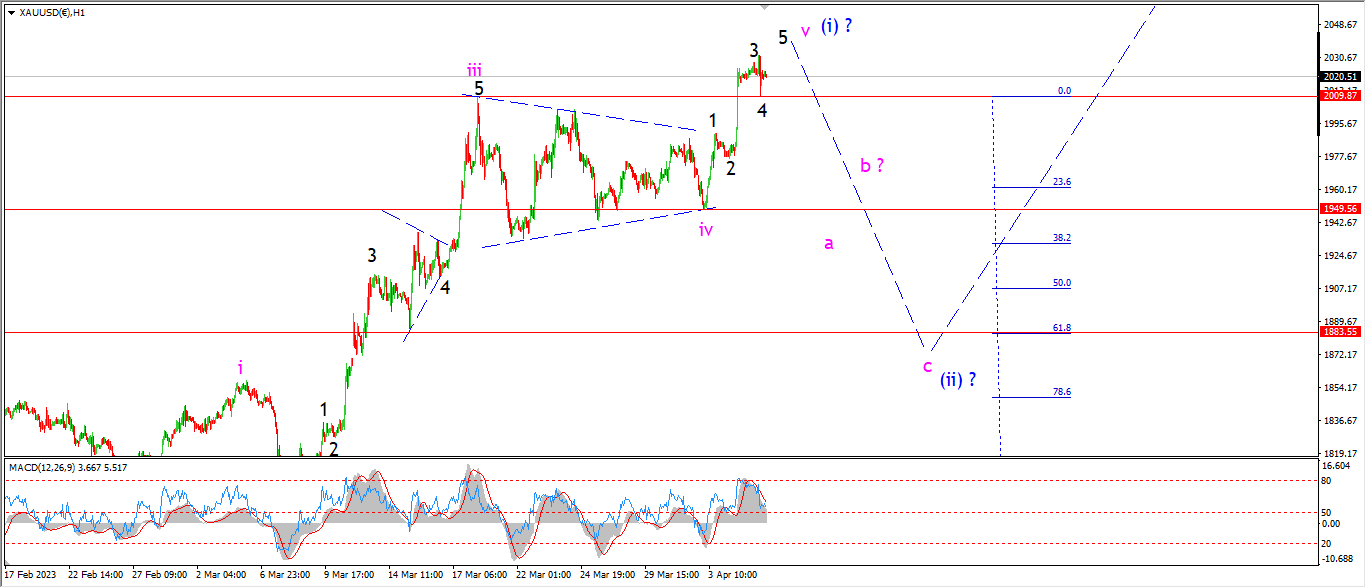
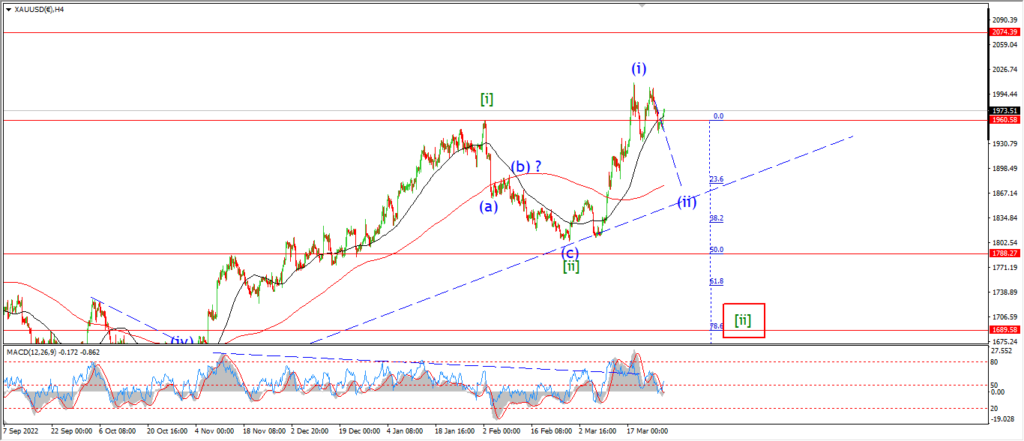
there is an emerging five wave pattern to complete wave ‘v’ of (i) today.
I have labelled this in black with wave ‘5’ of ‘v’ left to complete tomorrow.
Wave ‘v’ should complete the larger wave (i) tomorrow,
and all going well we should see a drop into wave ‘a’ of (ii) before the end of the week.
The initial target for wave ‘a’ lies at the wave ‘iv’ low of 1949.
Tomorrow;
Watch for wave ‘v’ to complete its internal five wave pattern as shown.
A break of the wave ‘iv’ level again will confirm wave (ii) is underway.
CRUDE OIL.
CRUDE OIL 1hr.
CRUDE OIL 4hr.
CRUDE OIL daily.
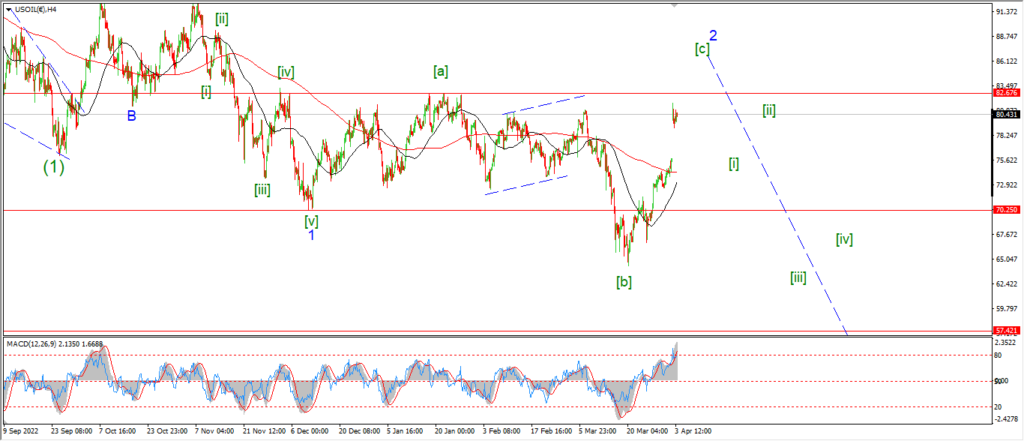
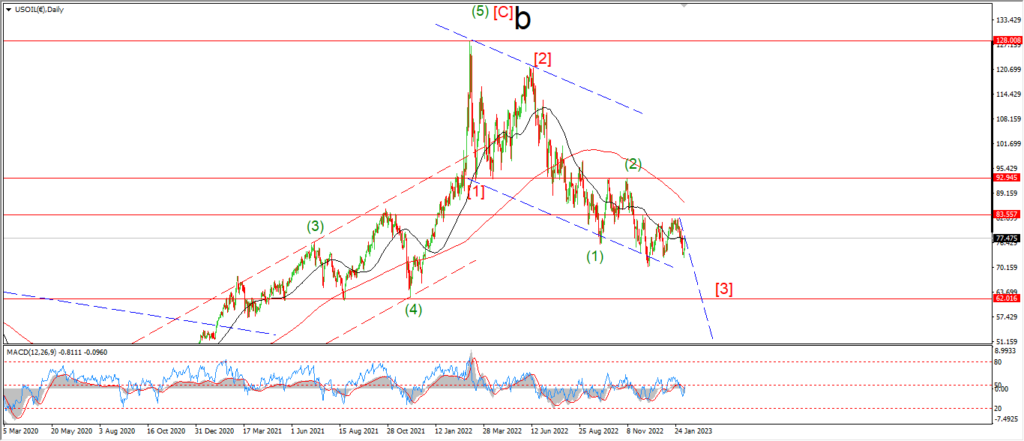
This is the 6th time in 5 months that crude has attempted to break out above the 82.00 handle.
So far it has failed each time,
Will this time be any different?
Not according to the main count it won’t!
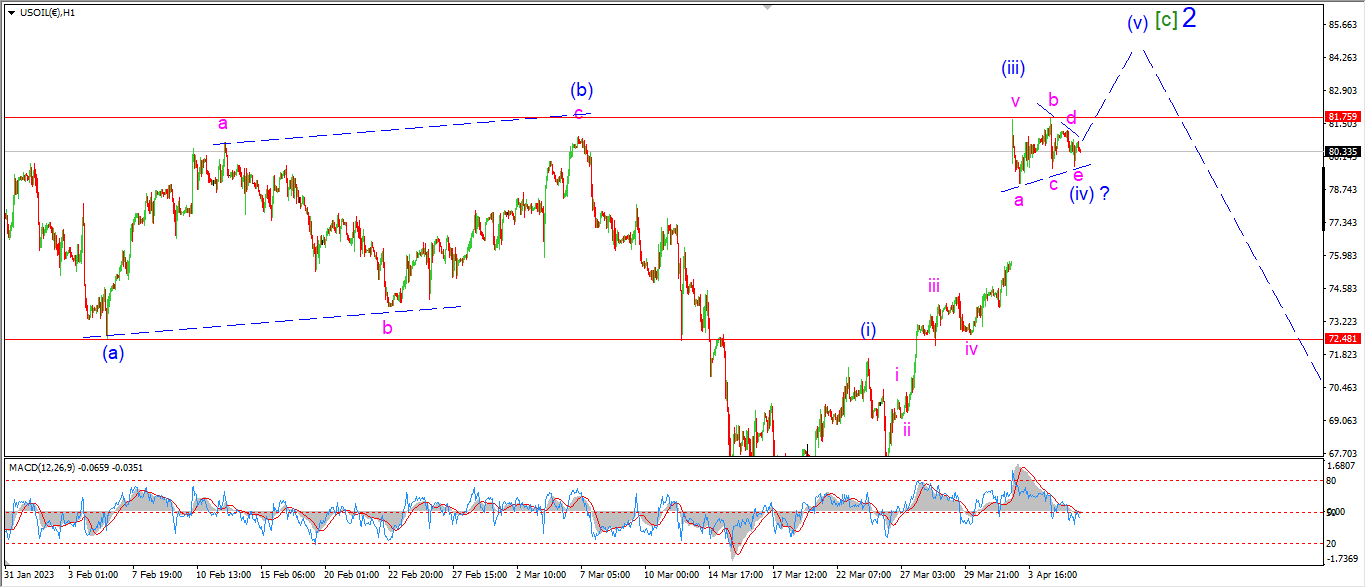
Wave (iv) of [c] is tracking sideways for the last few sessions now,
and I am proposing a triangle for wave (iv) now given that action.
This pattern should be followed by another pop into wave (v) of [c] over the coming days,
and then I will begin to look for a top in wave [c] of ‘2’ to form.
The main level of interest below us now is at the wave (a) low of 72.80.
A break of that support will signal wave [i] of ‘3’ is underway.
Tomorrow;
Watch for wave (iv) to complete that triangle pattern at todays lows.
A break of 81.75 again will signal wave (v) is underway.
S&P 500.
S&P 500 1hr
S&P 500 4hr
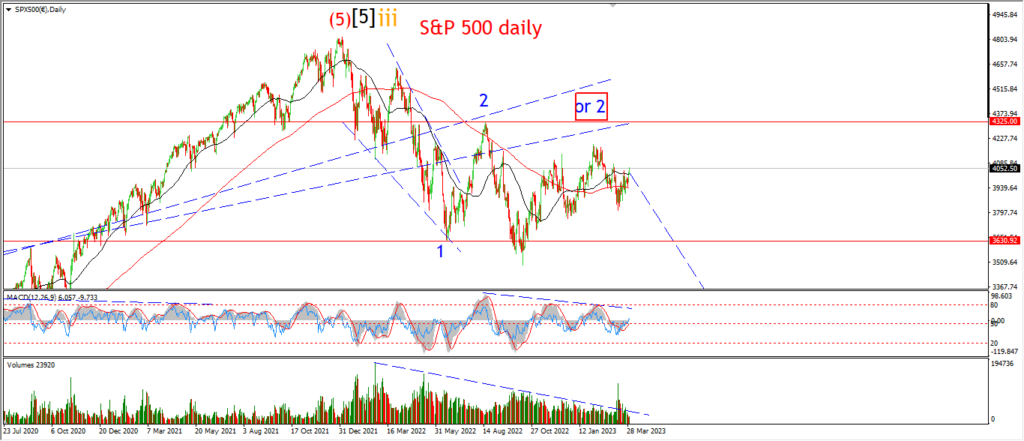
S&P 500 daily.
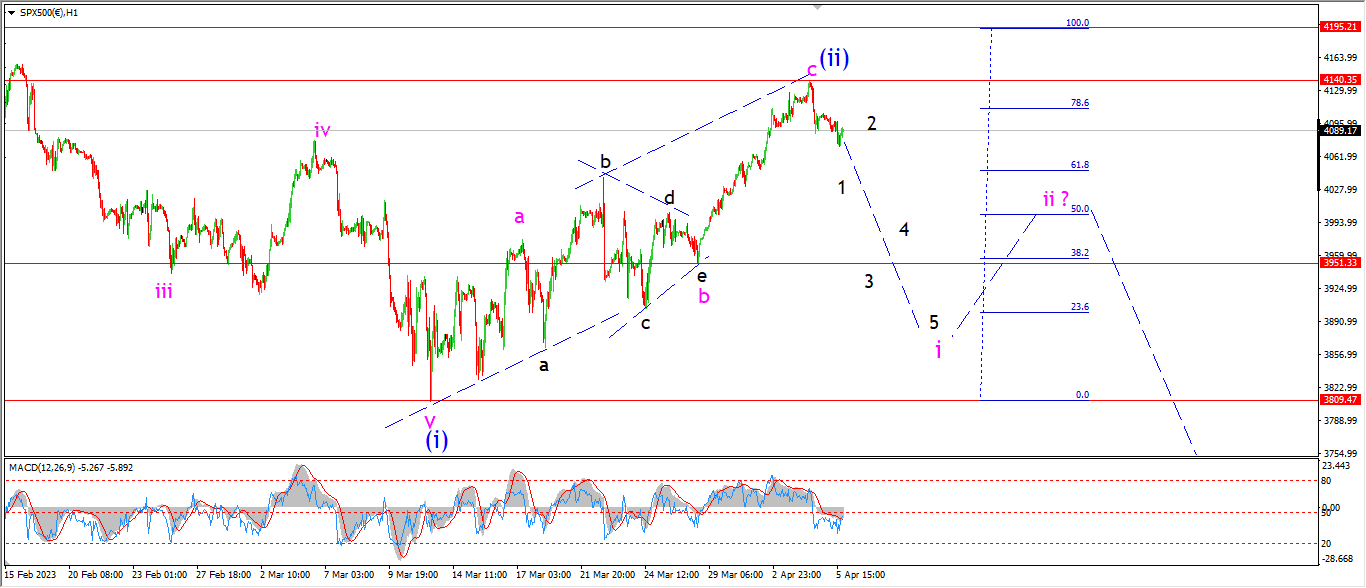
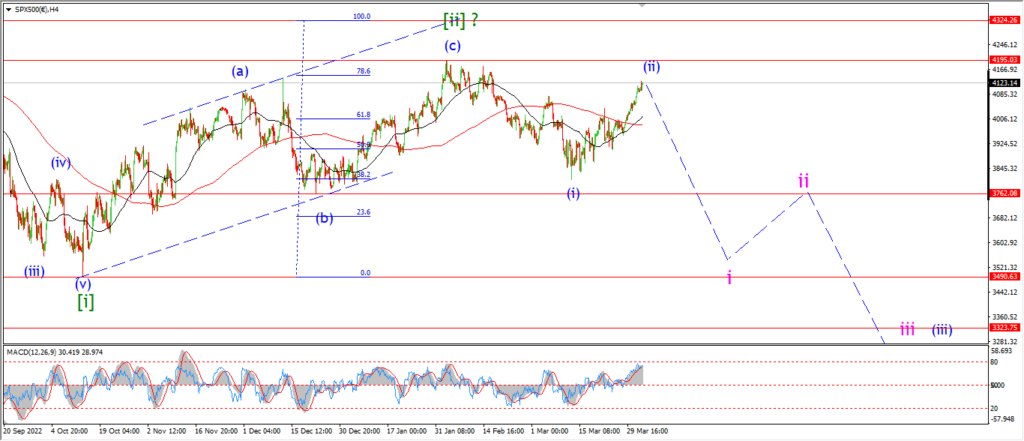
The S&P is holding below the highs at wave (ii) again today which does not confirm the top is in for wave (ii),
but it is definitely a welcome change from last weeks relentless rally in wave ‘c’.
I want to see the market fall back below the wave ‘b’ low at 3951 again in order to signal the wave (ii) top is in.
Wave ‘i’ of (iii) should achieve at least a full retracement of wave ‘c’.
A break below 3900 again would be even more convincing for wave ‘i’.
Tomorrow;
Watch for wave (ii) to continue to hold at 4140.
Wave ‘i’ must now track lower in five waves as shown.
The minimum target for wave ‘i’ lies at 3951.
SILVER.
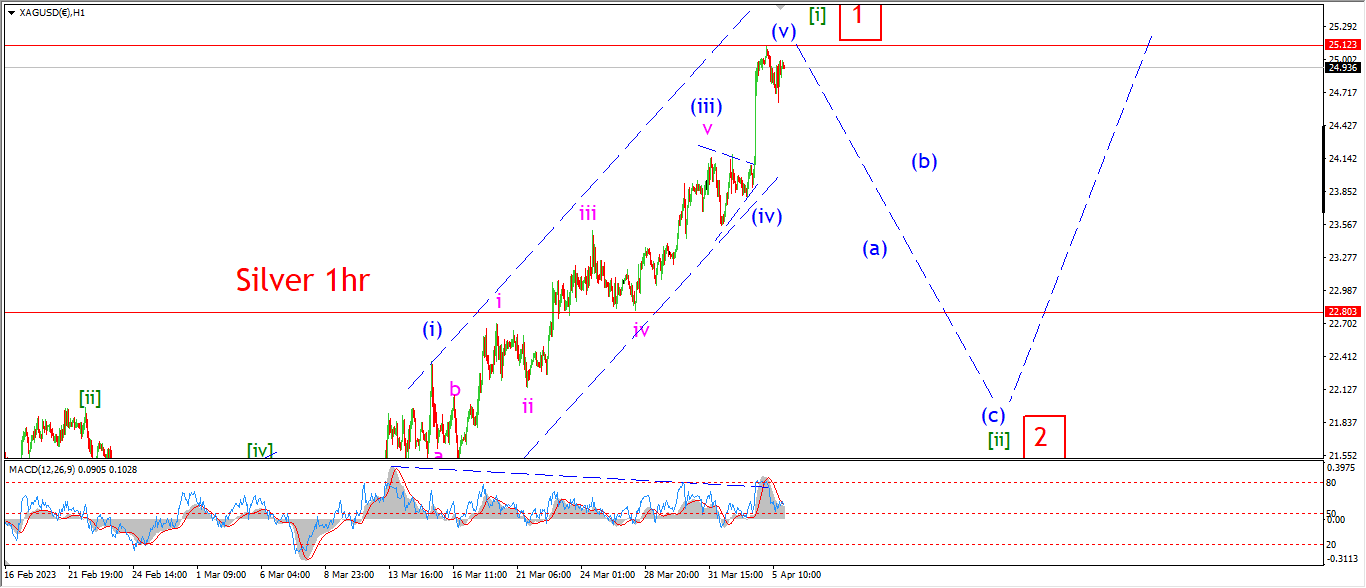
SILVER 1hr
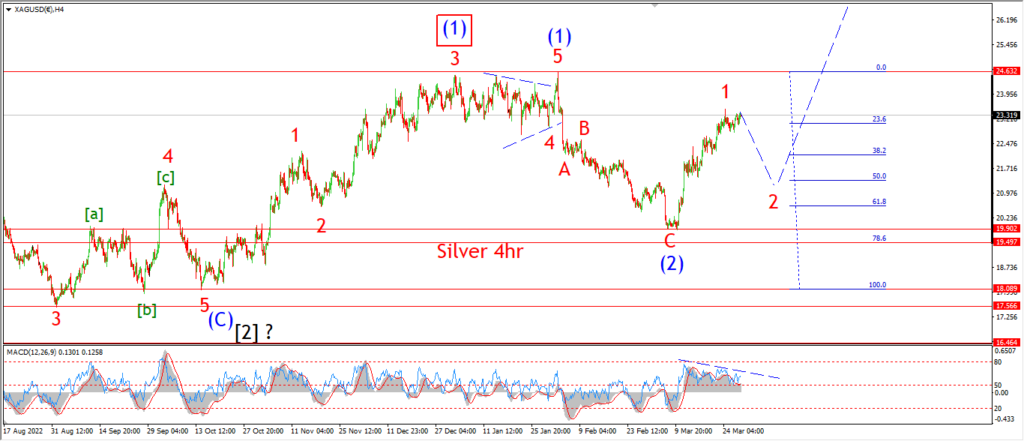
SILVER 4hr.
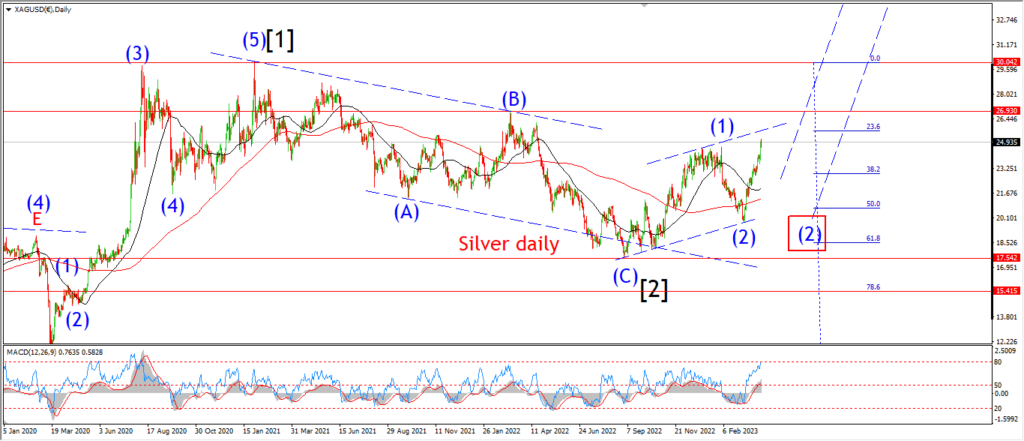
SILVER daily.
No change here is silver this evening.
We have a very small lower high this evening but I am not going to label this yet until we get some follow through on the downside.
Its been a wild year in silver so far.
The previous highs in February were followed by a $5 drop in one month,
and now another $5 move has retraced that previous decline fully.
This is a pretty impressive move for sure.
But I’m afraid it does not confirm any long term pattern at all yet!
The market has essentially spent the last 2 months going nowhere.
And just like the previous decline was followed by a massive rally,
this rally will be followed by a severe selloff,
that much is sure.
The question is this,
Will the next selloff create a bullish higher low,
or will se see a complete about face and head back into the $19 area again,
the more sever option will fit a possible alternate count for wave (2) on the daily chart.
At this point I don’t think we can rule anything out here.
Tomorrow;
For the moment I will stick with the second wave retracement idea as shown on the hourly chart.
I will have to wait to see if wave (a) can manage to take us lower before the end of this week.
BITCOIN
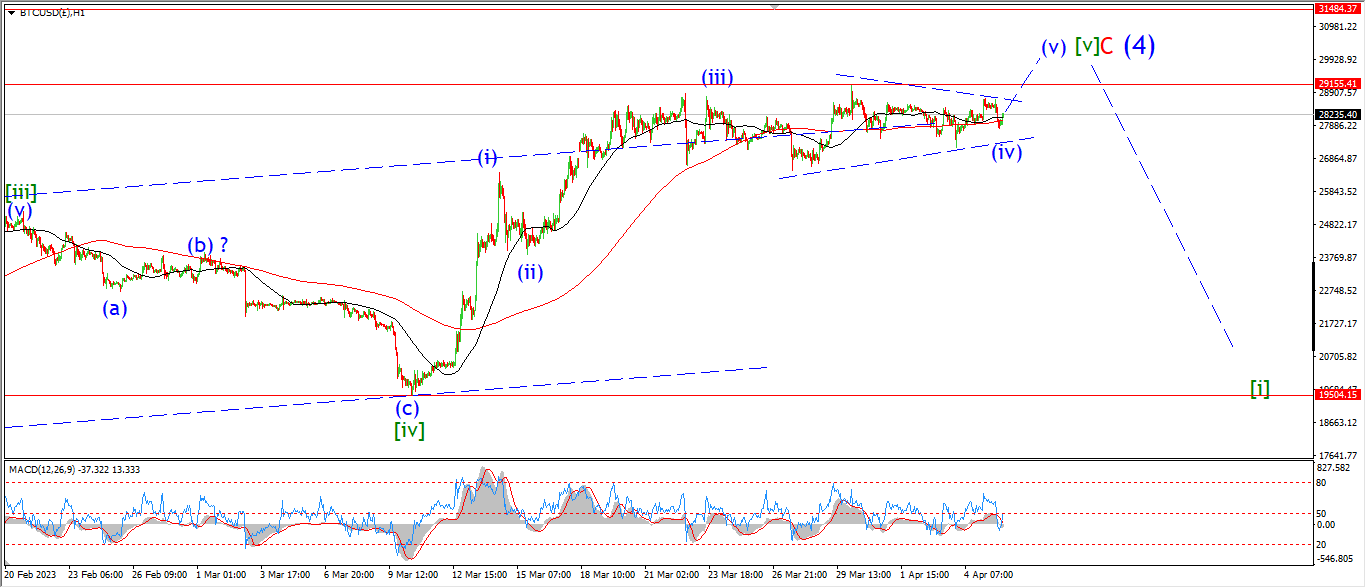
BITCOIN 1hr.

BITCOIN 4hr.
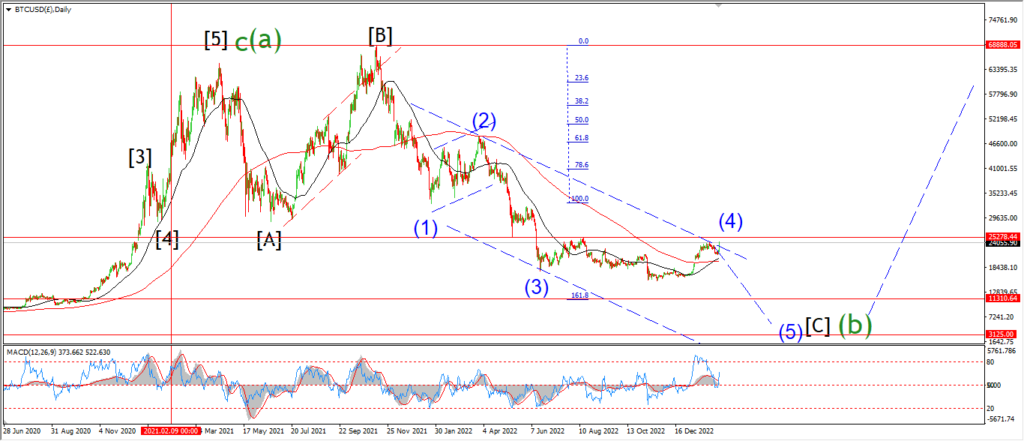
BITCOIN daily.
….
FTSE 100.
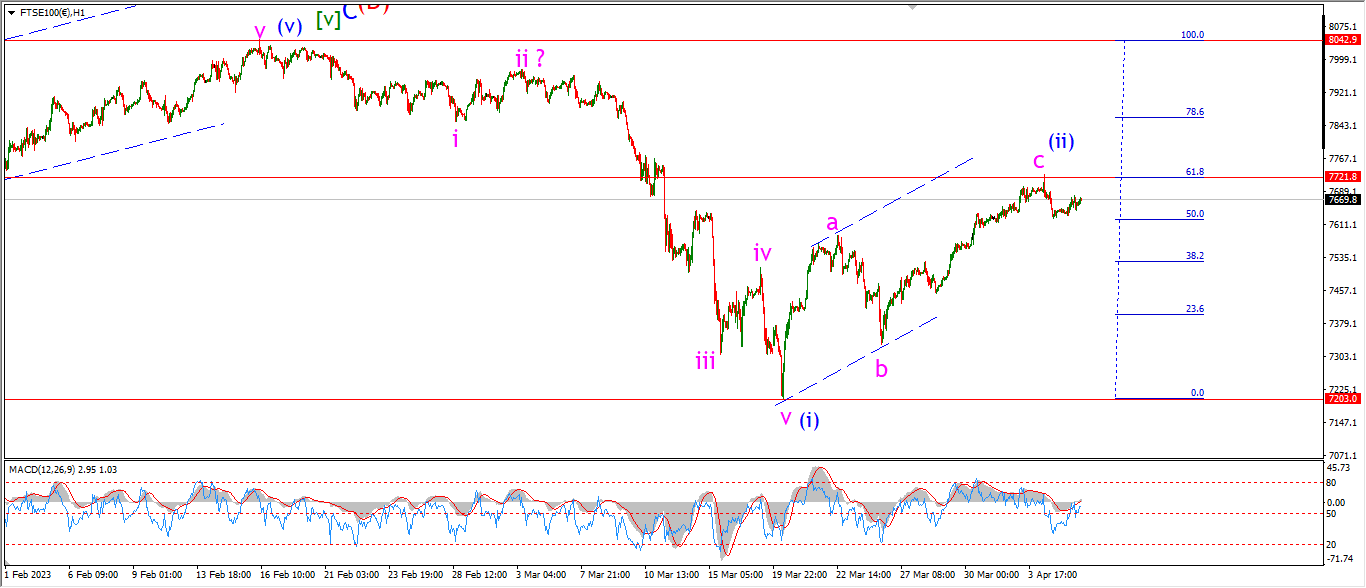
FTSE 100 1hr.
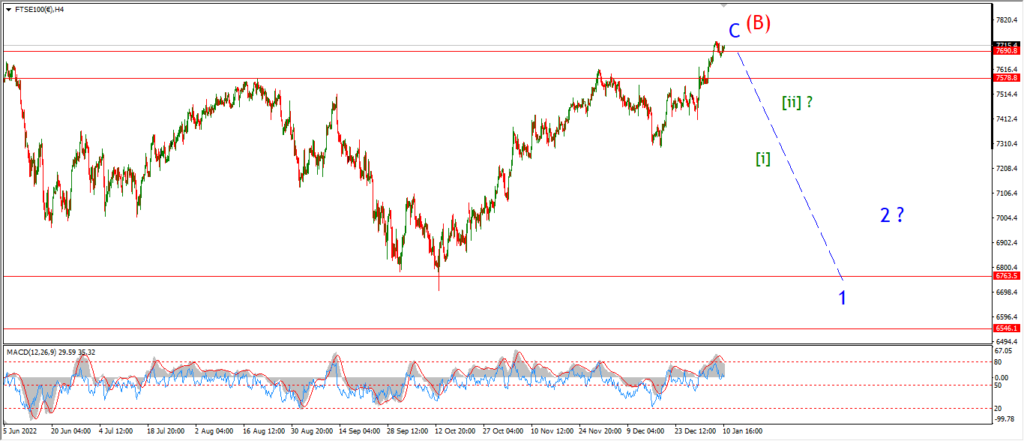
FTSE 100 4hr.

FTSE 100 daily.
….
DAX.
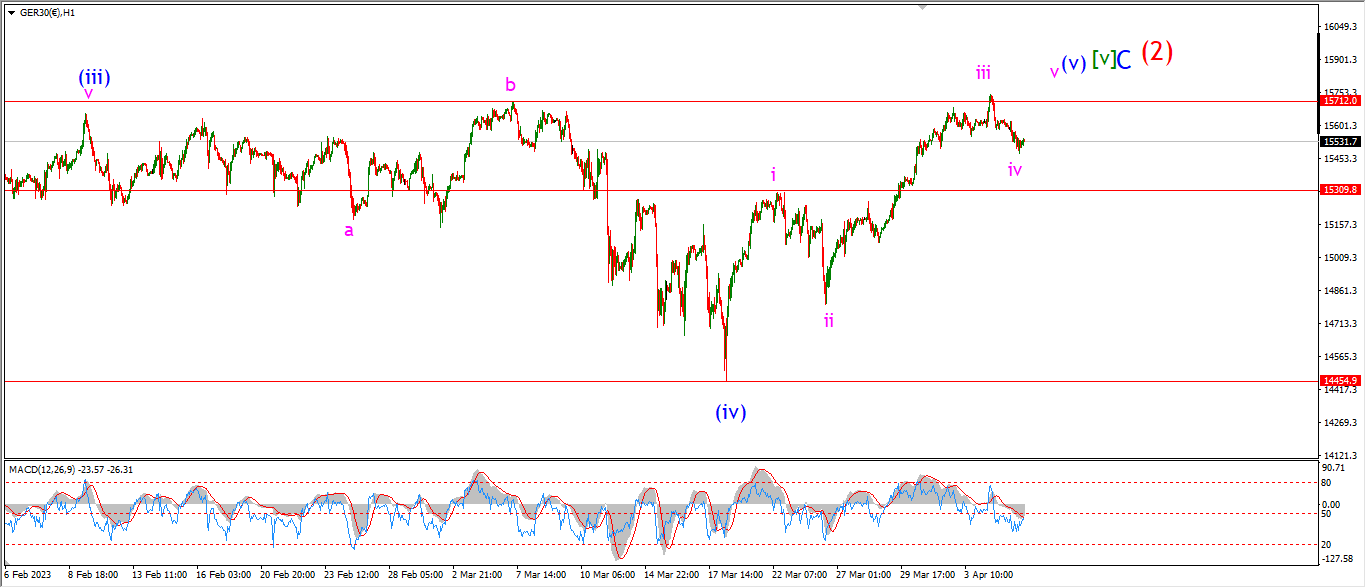
DAX 1hr
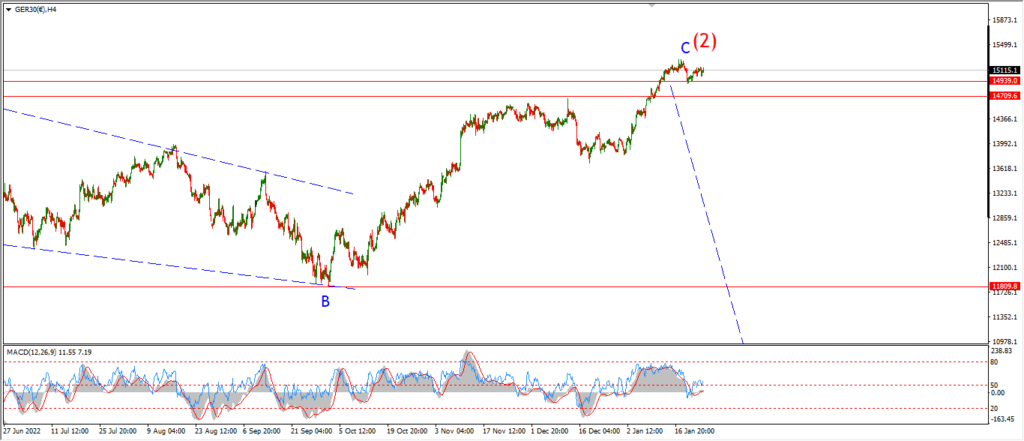
DAX 4hr

DAX daily.
….
NASDAQ 100.
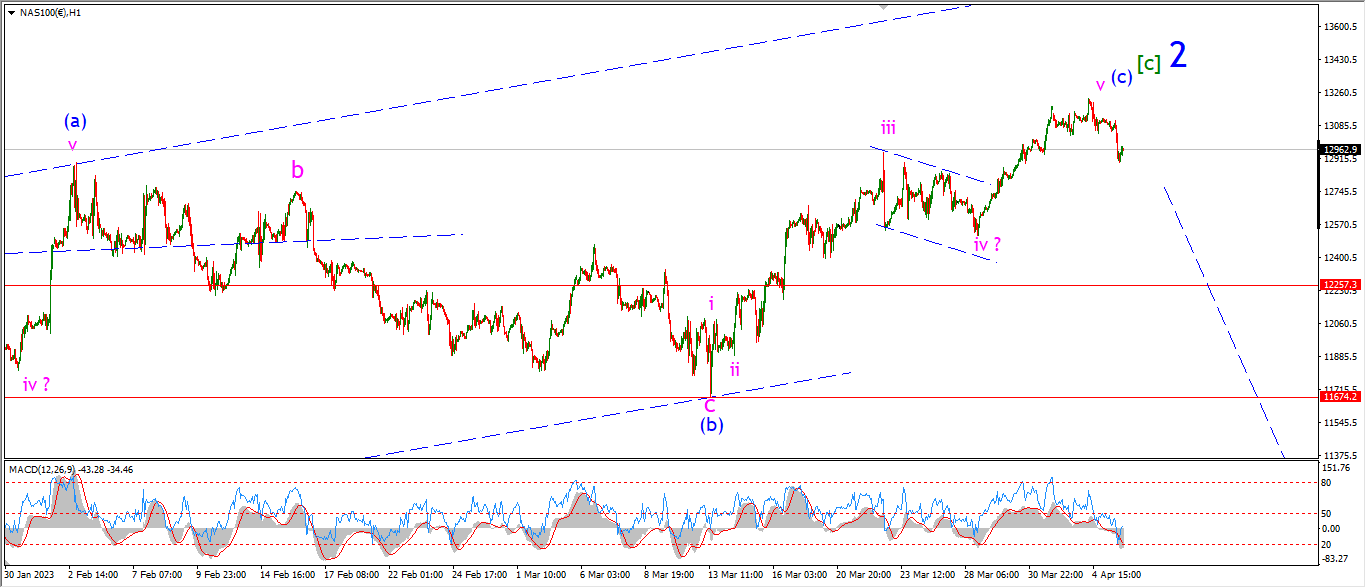
NASDAQ 1hr
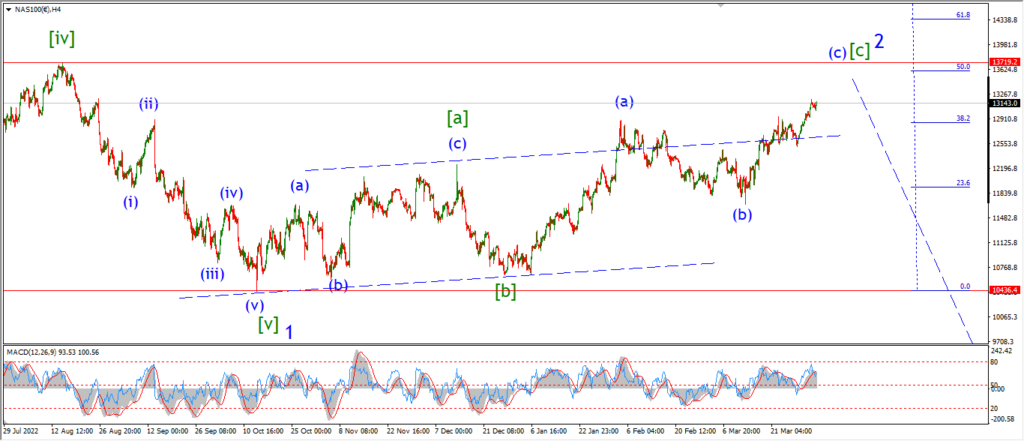
NASDAQ 4hr.

NASDAQ daily.
….