
[vc_row][vc_column][vc_separator border_width=”5″][/vc_column][/vc_row]
[vc_row][vc_column][vc_column_text]
Hi everyone.
The main lesson I have learned over the last year is this:
Never underestimate how far a speculative extreme can extend to.
Even when the means to speculate has all but disappeared,
even when the underlying data is screaming ‘Imminent recession’.
It seems that when the public is locked within a stock-market feeding frenzy.
The upper limit to the gluttony just evaporates.
But……….
What people seem to forget is,
the market will always find the last marginal buyer
who will pay through the nose for one more final high.
And when it does,
the end will come quicker than they could ever have imagined.
As shown by the chart below.
On a weekly basis the S&P is tracing out a five wave terminal move off the 2009 lows.
The current euphoria is occurring in wave ‘5’ of (5) of [5].
The rally may well bring us to a new all time high above 3000, but this will be short lived.
As the current deceleration in the credit markets and general economic activity is typical of the end of a trend.
Fifth wave euphoria even when the ground is opening up below you, now thats impressive!

[/vc_column_text][/vc_column][/vc_row]
[vc_row][vc_column][vc_separator border_width=”5″][/vc_column][/vc_row][vc_row][vc_column][vc_column_text]
S&P 500.
[/vc_column_text][/vc_column][/vc_row][vc_row][vc_column][vc_separator border_width=”5″][/vc_column][/vc_row][vc_row][vc_column width=”2/3″][vc_custom_heading text=”1 hr” use_theme_fonts=”yes”][vc_column_text] [/vc_column_text][/vc_column][vc_column width=”1/3″][vc_custom_heading text=”4 Hours” use_theme_fonts=”yes”][vc_column_text]
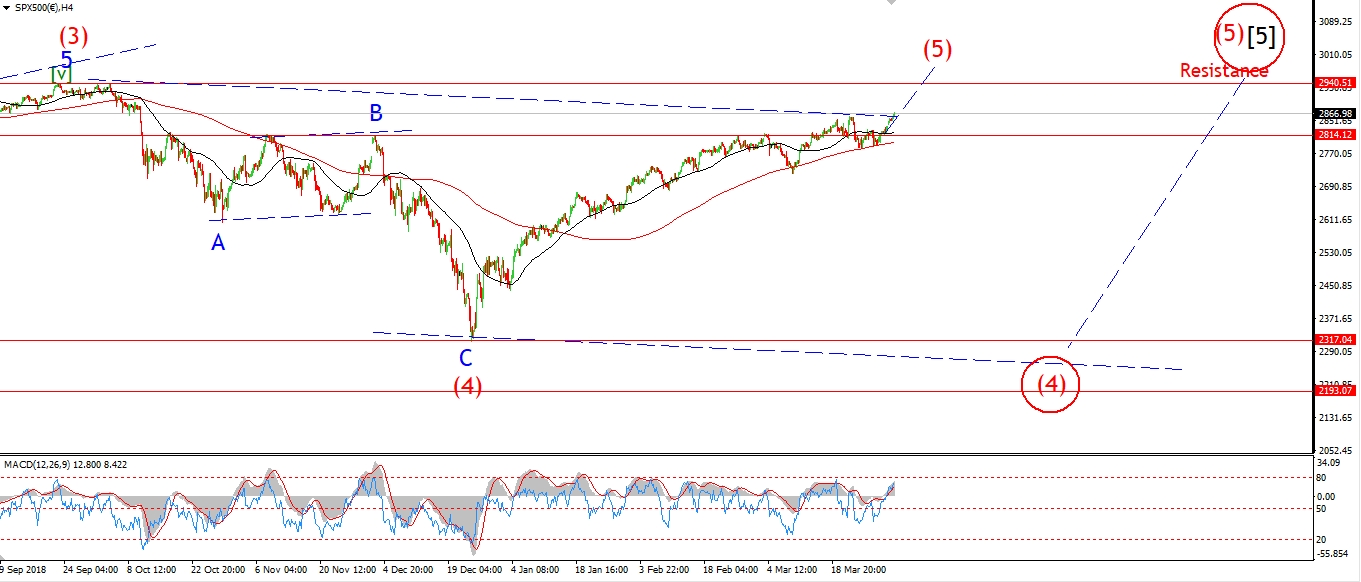 [/vc_column_text][vc_custom_heading text=”Daily” use_theme_fonts=”yes”][vc_column_text][/vc_column_text][/vc_column][/vc_row]
[vc_row][vc_column][vc_column_text]
The S&P broke out of the previous pattern at todays highs.
This rules out the idea of a top in wave ‘B’ in place.
And as with the wave count in the DOW,
The wave ‘B’ top has been relegated to the alternate count.
I have switched to the idea that we will see a new all time high in wave (5) of [5] again over the coming few weeks.
This is best viewed on the 4hr chart.
If this is wave [iii] of ‘5’ now underway,
then we will likely see an acceleration above the previous highs at 2941 this week.
Wave [iii] itself will meet the upper trendline at 2995 or so.
this is also where wave [iii] reaches 162% of wave [i].
If we do hit 3000 in wave [iii],
Then I think wave [v] will not push much beyond that level.
As the major psychological work will be done with the break of 3000.
Tomorrow;
Wave (iii) of [iii] is now in force.
This wave should break back above 2900 again before correcting in wave (iv).
[/vc_column_text][/vc_column][/vc_row]
[vc_row][vc_column][vc_column_text]
IF You want nightly Elliott Wave Updates,
to help you stay ahead of the next BIG market move.
Then check out the Membership offers.
[/vc_column_text][/vc_column][/vc_row]
[vc_row][vc_column][vc_separator border_width=”5″][/vc_column][/vc_row]