
[vc_row][vc_column][vc_separator border_width=”5″][/vc_column][/vc_row]
[vc_row][vc_column][vc_column_text]
Hi everyone.
My main lesson I have learned over the last year is this:
Never underestimate how far a speculative extreme can extend to.
Even when the means to speculate has all but disappeared,
even when the underlying data is screaming ‘Imminent recession’.
It seems that when the public is locked within a stock-market feeding frenzy.
The upper limit to the gluttony just evaporates.
But……….
What people seem to forget is,
the market will always find the last marginal buyer
who will pay through the nose for one more final high.
And when it does,
the end will come quicker than they could ever have imagined.

[/vc_column_text][/vc_column][/vc_row]
[_s2If current_user_can(access_s2member_ccap_eurusd)]
[vc_row][vc_column][vc_separator border_width=”5″][/vc_column][/vc_row]
[vc_row][vc_column][vc_column_text]
EURUSD
[/vc_column_text][/vc_column][/vc_row]
[vc_row][vc_column][vc_separator border_width=”5″][/vc_column][/vc_row][vc_row][vc_column width=”2/3″][vc_custom_heading text=”1 hr” use_theme_fonts=”yes”][vc_column_text]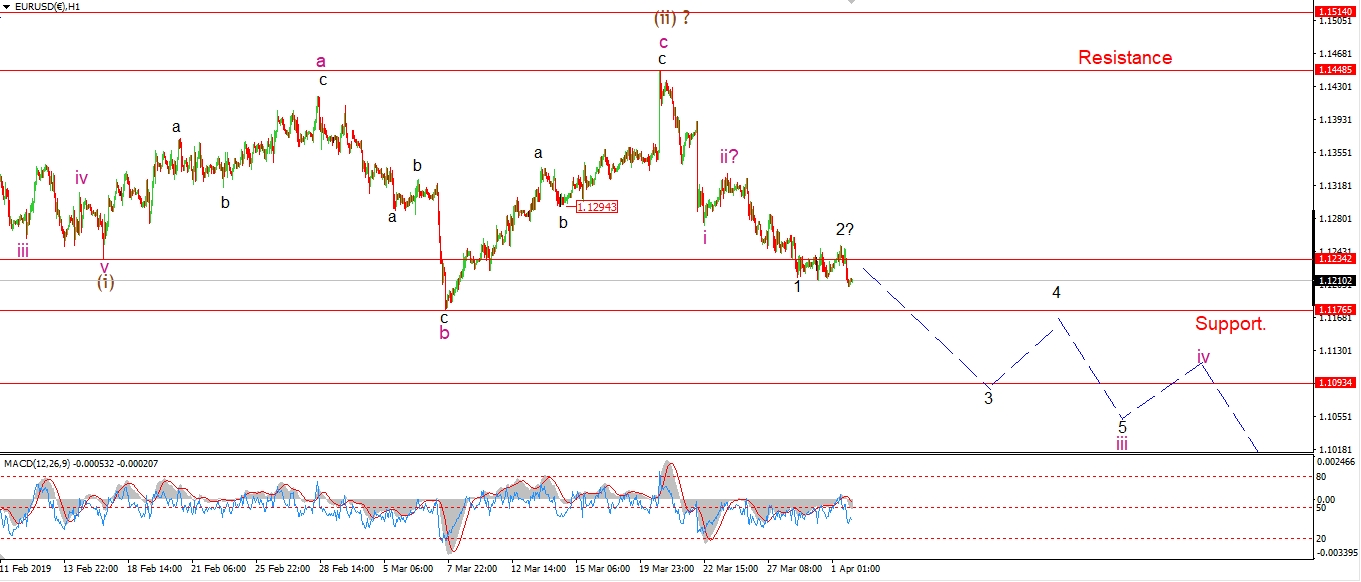 [/vc_column_text][/vc_column][vc_column width=”1/3″][vc_custom_heading text=”4 Hours” use_theme_fonts=”yes”][vc_column_text]
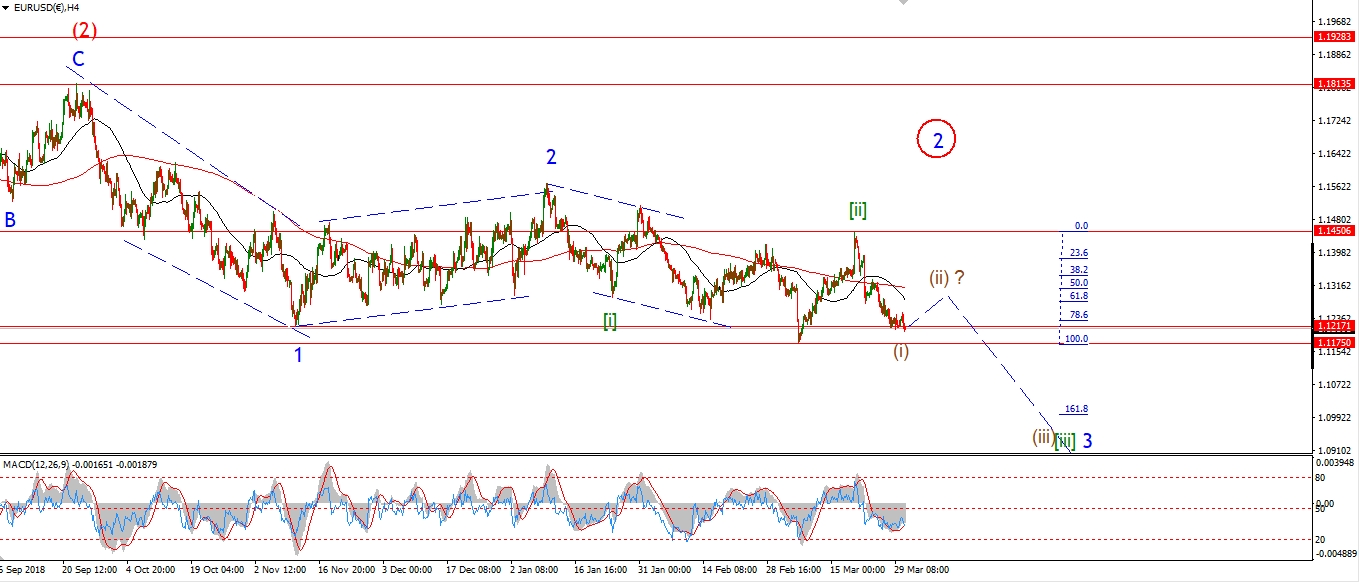 [/vc_column_text][vc_custom_heading text=”Daily” use_theme_fonts=”yes”][vc_column_text]
 [/vc_column_text][/vc_column][/vc_row]
[vc_row][vc_column][vc_column_text]
The last few sessions have gone by without any significant retracement higher in a larger second wave.
And today was no different.
EURUSD is now likely moving lower in a possible third wave extension.
I have shown waves ‘1’ and ‘2’ complete at todays high.
A further break of 1.1176 tomorrow will favor this new wave count.
There is a possibility that the recent high at 1.1448 was wave [ii] at one degree higher as a running flat.
This is shown on the 4hr chart as a possible alternate.
Tomorrow;
Watch for wave (iii) to continue lower with an extension in wave ‘iii’ pink.
[/vc_column_text][/vc_column][/vc_row]
[/_s2If]
[_s2If current_user_can(access_s2member_ccap_gbpusd)]
[vc_row][vc_column][vc_separator border_width=”5″][/vc_column][/vc_row][vc_row][vc_column][vc_column_text]
GBPUSD
[/vc_column_text][/vc_column][/vc_row][vc_row][vc_column][vc_separator border_width=”5″][/vc_column][/vc_row][vc_row][vc_column width=”2/3″][vc_custom_heading text=”1 hr” use_theme_fonts=”yes”][vc_column_text]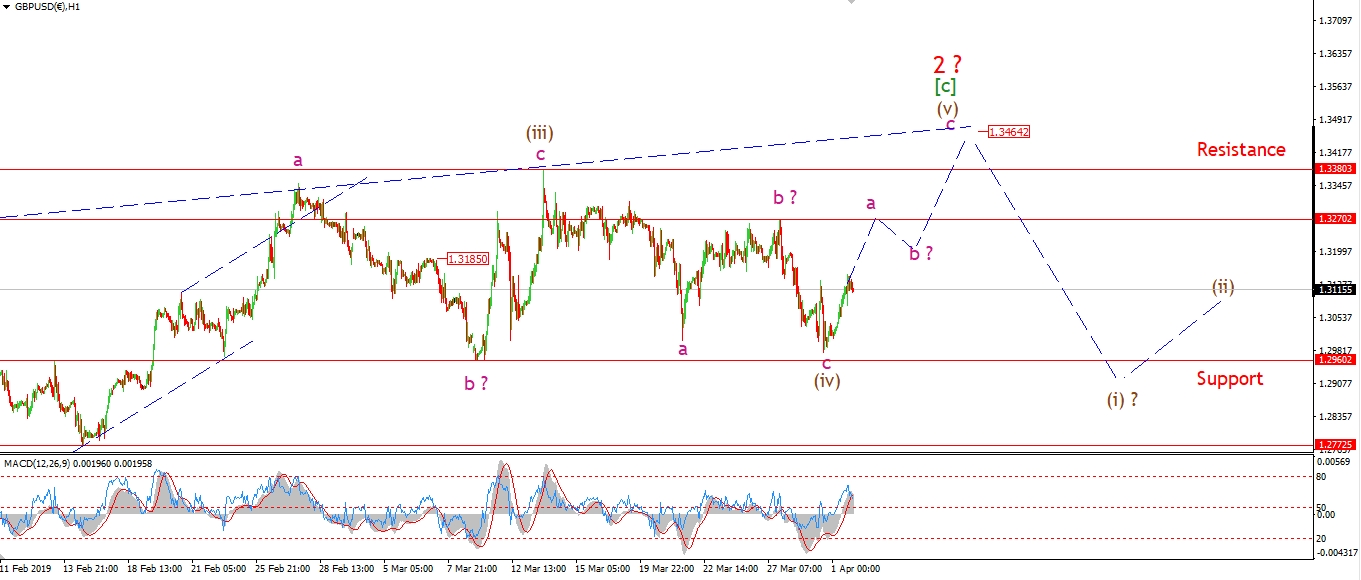 [/vc_column_text][/vc_column][vc_column width=”1/3″][vc_custom_heading text=”4 Hours” use_theme_fonts=”yes”][vc_column_text]
 [/vc_column_text][vc_custom_heading text=”Daily” use_theme_fonts=”yes”][vc_column_text]
 [/vc_column_text][/vc_column][/vc_row]
[vc_row][vc_column][vc_column_text]
The action in cable today is beginning to favor the larger ending diagonal pattern in wave [c].
I have changed the short term count to illustrate this pattern.
The decline off the 1.3380 high is still corrective looking and in three waves.
This decline takes the wave (iv) label
and wave (v) is now shown as another three wave pattern higher
to complete the ending diagonal wave [c].
Todays rally is wave ‘a’ of (v).
Wave ‘b’ and ‘c’ should take us up to the 1.3460 level at the upper trendline again.
Tomorrow;
Watch for wave ‘a’ of (v) to complete at the previous shoulder resistance of 1.3270.
[/vc_column_text][/vc_column][/vc_row]
[/_s2If]
[_s2If current_user_can(access_s2member_ccap_usdjpy)]
[vc_row][vc_column][vc_separator border_width=”5″][/vc_column][/vc_row][vc_row][vc_column][vc_column_text]
USDJPY
[/vc_column_text][/vc_column][/vc_row][vc_row][vc_column][vc_separator border_width=”5″][/vc_column][/vc_row][vc_row][vc_column width=”2/3″][vc_custom_heading text=”1 hr” use_theme_fonts=”yes”][vc_column_text]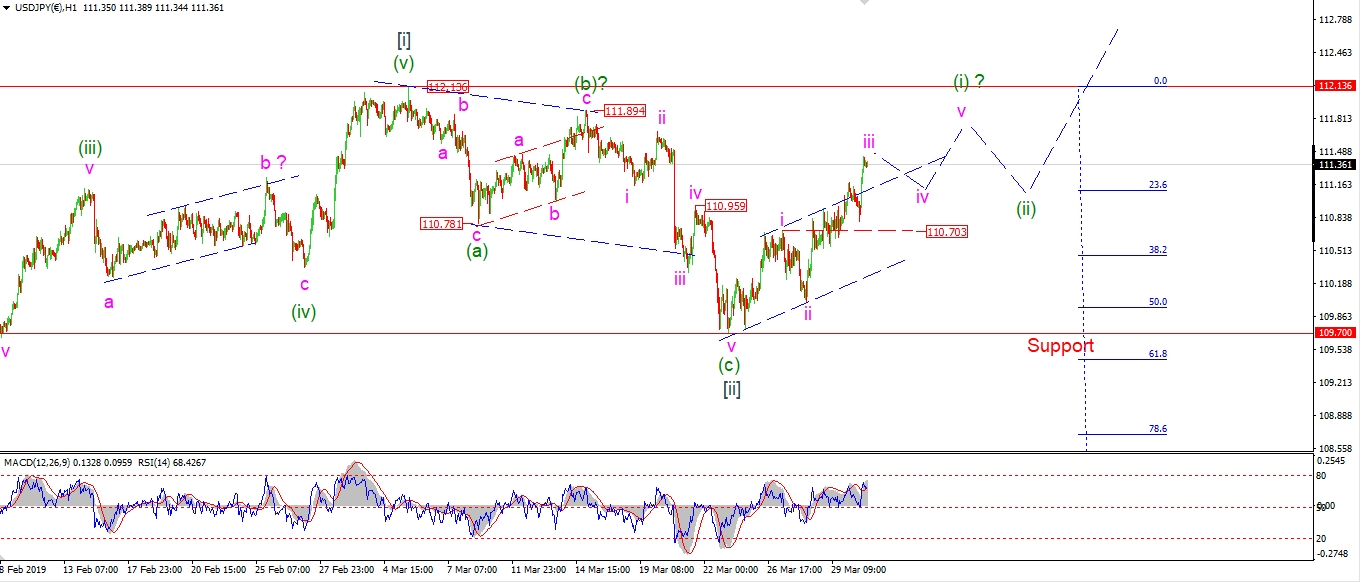 [/vc_column_text][/vc_column][vc_column width=”1/3″][vc_custom_heading text=”4 Hours” use_theme_fonts=”yes”][vc_column_text]
 [/vc_column_text][vc_custom_heading text=”Daily” use_theme_fonts=”yes”][vc_column_text]
 [/vc_column_text][/vc_column][/vc_row]
[vc_row][vc_column][vc_column_text]
USDJPY rallied this evening along with stocks.
I have labelled this wave ‘iii’ of (i).
The high may not be reached in wave ‘iii’ either,
so it is possible that the rally in wave ‘iii’ will continue into tomorrow.
Although I expect wave ‘iii’ will complete below resistance at 112.36.
A correction in wave ‘iv’ should appear by midweek.
And this correction must hold above 110.70, the wave ‘i’ high.
Tomorrow.
Watch for wave ‘iii’ of (i) to continue higher and hold above 110.70.
[/vc_column_text][/vc_column][/vc_row]
[/_s2If]
[_s2If current_user_can(access_s2member_ccap_dow_jones)]
[vc_row][vc_column][vc_separator border_width=”5″][/vc_column][/vc_row][vc_row][vc_column][vc_column_text]
DOW JONES INDUSTRIALS
[/vc_column_text][/vc_column][/vc_row][vc_row][vc_column][vc_separator border_width=”5″][/vc_column][/vc_row][vc_row][vc_column width=”2/3″][vc_custom_heading text=”1 hr” use_theme_fonts=”yes”][vc_column_text]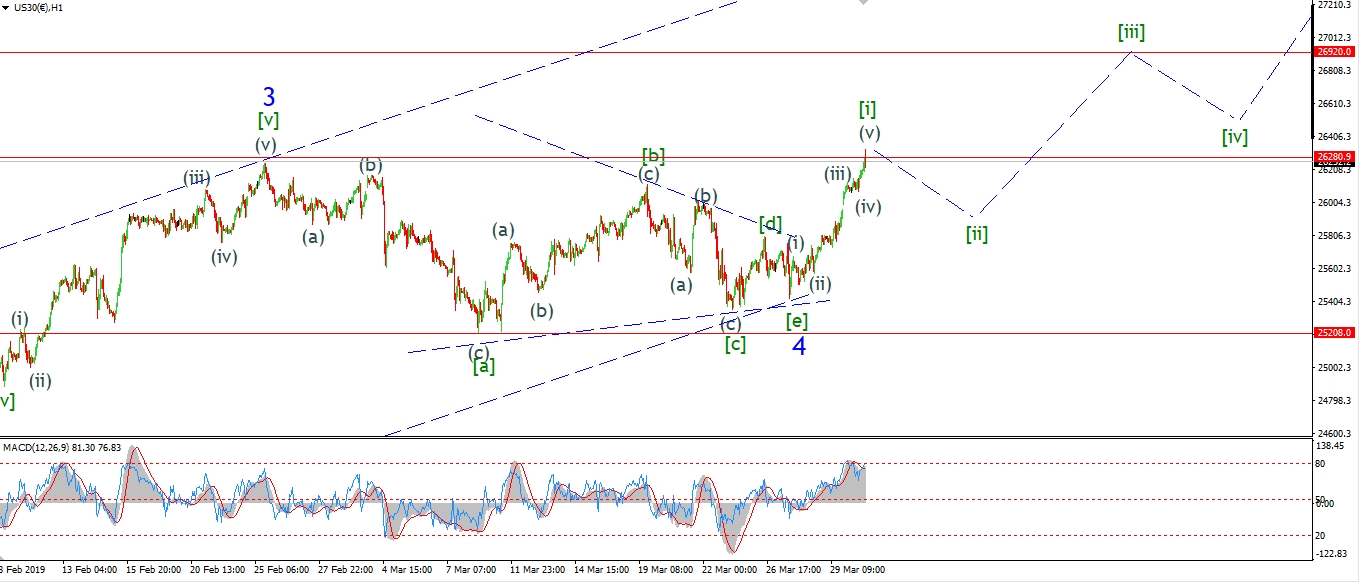 [/vc_column_text][/vc_column][vc_column width=”1/3″][vc_custom_heading text=”4 Hours” use_theme_fonts=”yes”][vc_column_text]
 [/vc_column_text][vc_custom_heading text=”Daily” use_theme_fonts=”yes”][vc_column_text]
 [/vc_column_text][/vc_column][/vc_row]
[vc_row][vc_column][vc_column_text]
Todays rally has ruled out the idea of a top in-place for wave ‘B’.
In fact,
I think todays high has all but ruled out wave the idea of a ‘B’ wave high altogether.
I have now switched to the alternate count showing the rally off the December lows as wave (5) of [5].
The wave which previously was put on the long finger
is now front and center again.
The action over the last few weeks is most likely a triangle wave ‘4’ of (5),
which is now complete.
So this means wave ‘5’ of (5) will carry the market to a new and final all time high.
This will complete five waves off the 2009 lows in wave [5] black.
Back to the short term.
The 4hr chart shows the rise off the December lows as a five waves,
with a long extension in wave ‘3’.
On the 1hr chart,
The market broke out of the wave ‘4’ triangle in a five wave pattern.
This will either be wave [i] of ‘5’,
or wave ‘5’ itself.
The count will again depend on how the market corrects over the coming days.
Tomorrow;
Watch for a top in wave [i] to complete early this week.
Wave [ii] will correct in three waves.
[/vc_column_text][/vc_column][/vc_row]
[/_s2If]
[_s2If current_user_can(access_s2member_ccap_gold)]
[vc_row][vc_column][vc_separator border_width=”5″][/vc_column][/vc_row][vc_row][vc_column][vc_column_text]
GOLD
[/vc_column_text][/vc_column][/vc_row][vc_row][vc_column][vc_separator border_width=”5″][/vc_column][/vc_row][vc_row][vc_column width=”2/3″][vc_custom_heading text=”1 hr” use_theme_fonts=”yes”][vc_column_text]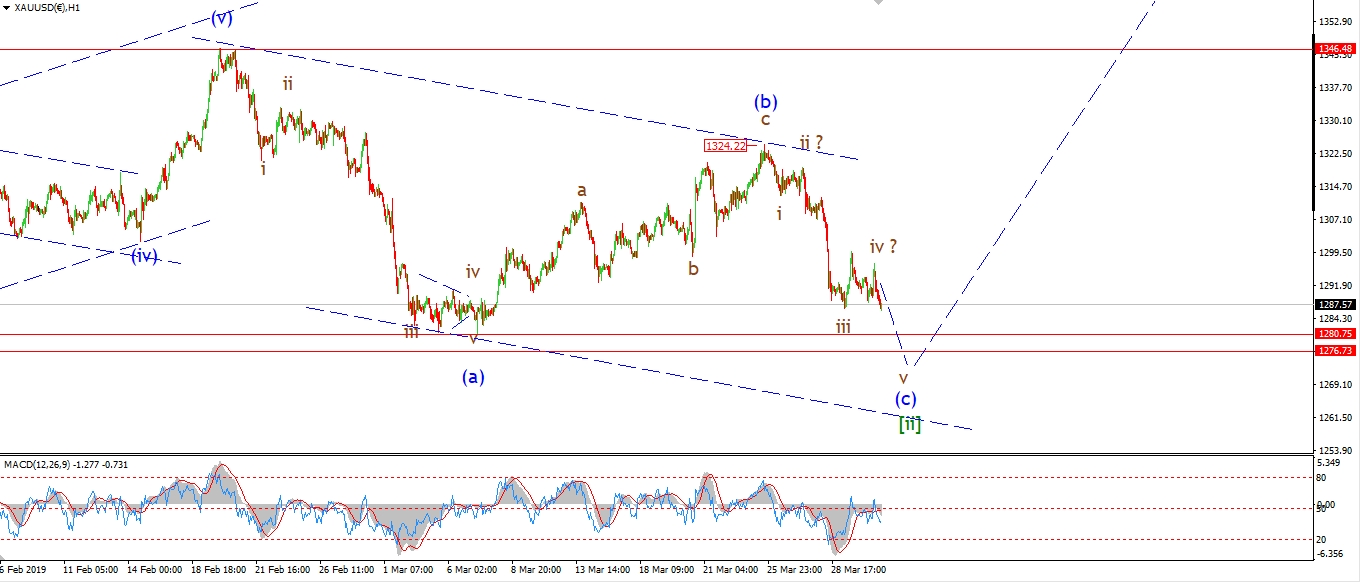 [/vc_column_text][/vc_column][vc_column width=”1/3″][vc_custom_heading text=”4 Hours” use_theme_fonts=”yes”][vc_column_text]
 [/vc_column_text][vc_custom_heading text=”Daily” use_theme_fonts=”yes”][vc_column_text]
 [/vc_column_text][/vc_column][/vc_row]
[vc_row][vc_column][vc_column_text]
Wave ‘iv’ of (c) in GOLD is now complete as a running flat at todays highs.
The price is moving lower again this evening
and should break to a new low tomorrow as wave ‘v’ down completes.
The target for wave ‘v’ and wave (c) is set at the minimum of 1280,
which is the previous low of wave (a).
And the lower range of that target at 1276 at the lower trend channel line.
Tomorrow;
Watch for wave ‘v’ to break 1280 at a minimum.
We should reach the lows of wave [ii] by the middle of the week.
where we can work on the rally ahead again.
[/vc_column_text][/vc_column][/vc_row]
[/_s2If]
[_s2If current_user_can(access_s2member_ccap_crude)]
[vc_row][vc_column][vc_separator border_width=”5″][/vc_column][/vc_row][vc_row][vc_column][vc_column_text]
U.S CRUDE OIL
[/vc_column_text][/vc_column][/vc_row][vc_row][vc_column][vc_separator border_width=”5″][/vc_column][/vc_row][vc_row][vc_column width=”2/3″][vc_custom_heading text=”1 hr” use_theme_fonts=”yes”][vc_column_text]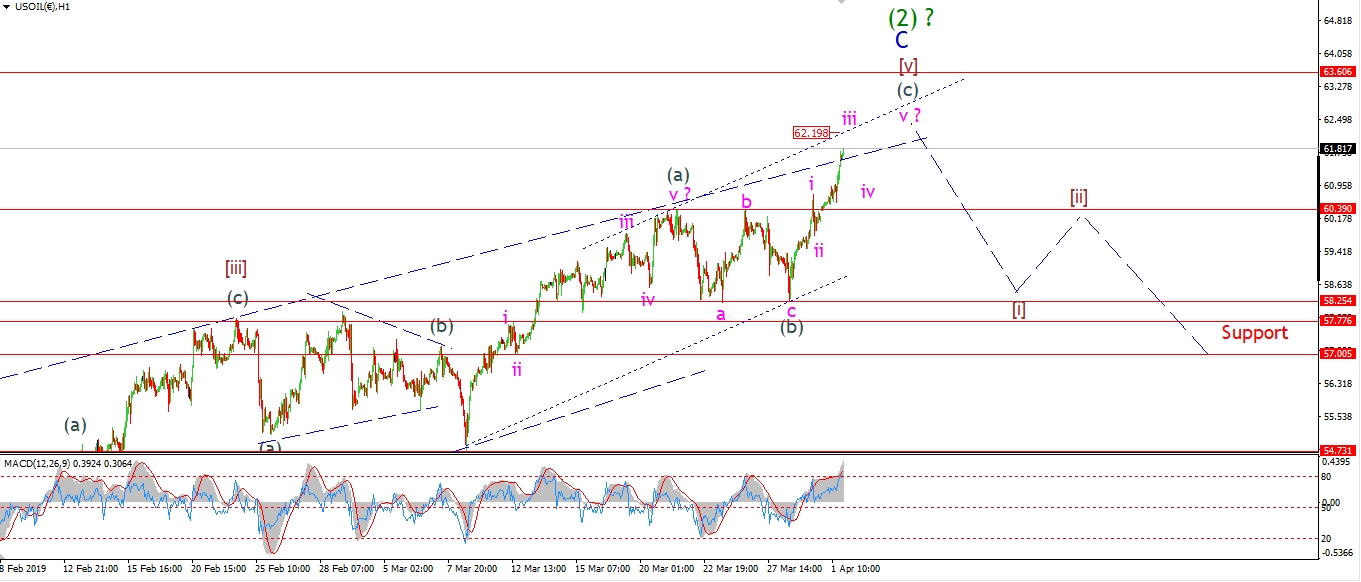 [/vc_column_text][/vc_column][vc_column width=”1/3″][vc_custom_heading text=”4 Hours” use_theme_fonts=”yes”][vc_column_text]
 [/vc_column_text][vc_custom_heading text=”Daily” use_theme_fonts=”yes”][vc_column_text]
 [/vc_column_text][/vc_column][/vc_row]
[vc_row][vc_column][vc_column_text]
Anyone who thinks that crude oil is now breaking out into a new bull run,
will be pretty shocked when wave (3) down hits.
The rally in wave [v] of ‘C’ is continuing, and pushed to a new high today.
the price is fast approaching the next major target area.
Tht is the 62% retracement level of the previous decline in wave (1).
This level lies at 63.60.
And if we do reach this level,
it will be the last hurrah of this corrective rebound.
Tomorrow;
the price is near to reaching the upper trendline of the wave [v] channel after todays rally.
Watch for wave ‘iii’ to complete at about 62.20,
and wave ‘iv’ should then correct but hold above the wave ‘i’ high.
[/vc_column_text][/vc_column][/vc_row]
[/_s2If]
[_s2If current_user_can(access_s2member_ccap_us10yr)]
[vc_row][vc_column][vc_separator border_width=”5″][/vc_column][/vc_row][vc_row][vc_column][vc_column_text]
US 10 yr Treasuries.
[/vc_column_text][/vc_column][/vc_row][vc_row][vc_column][vc_separator border_width=”5″][/vc_column][/vc_row][vc_row][vc_column width=”2/3″][vc_custom_heading text=”1 hr” use_theme_fonts=”yes”][vc_column_text]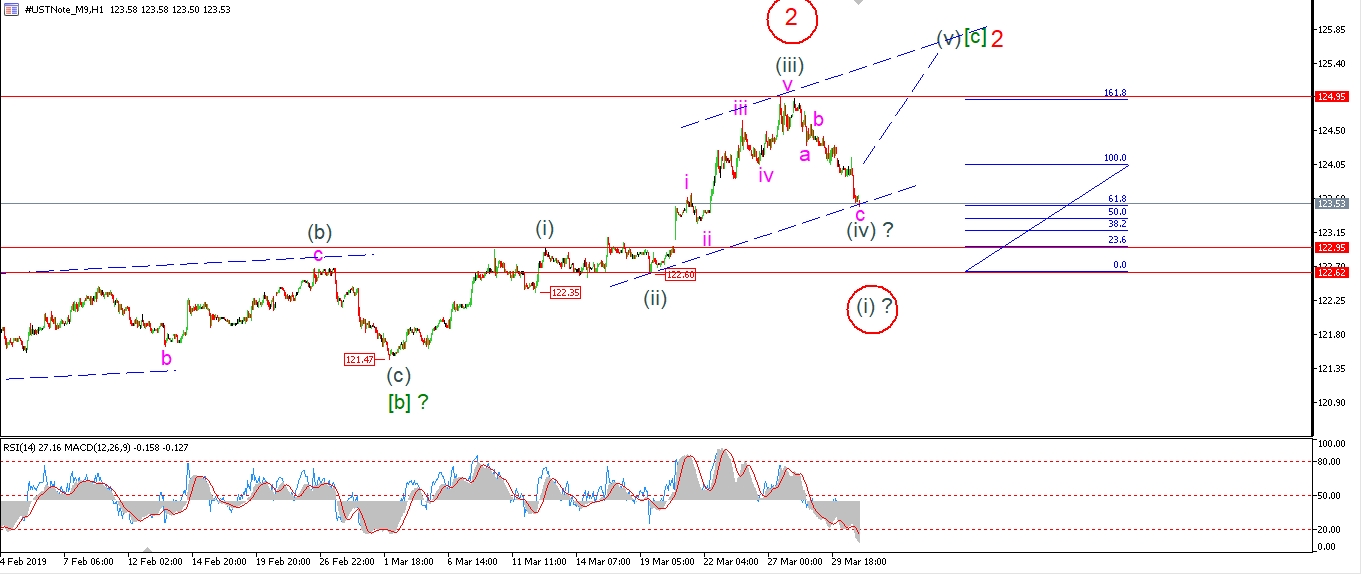 [/vc_column_text][/vc_column][vc_column width=”1/3″][vc_custom_heading text=”4 Hours” use_theme_fonts=”yes”][vc_column_text]
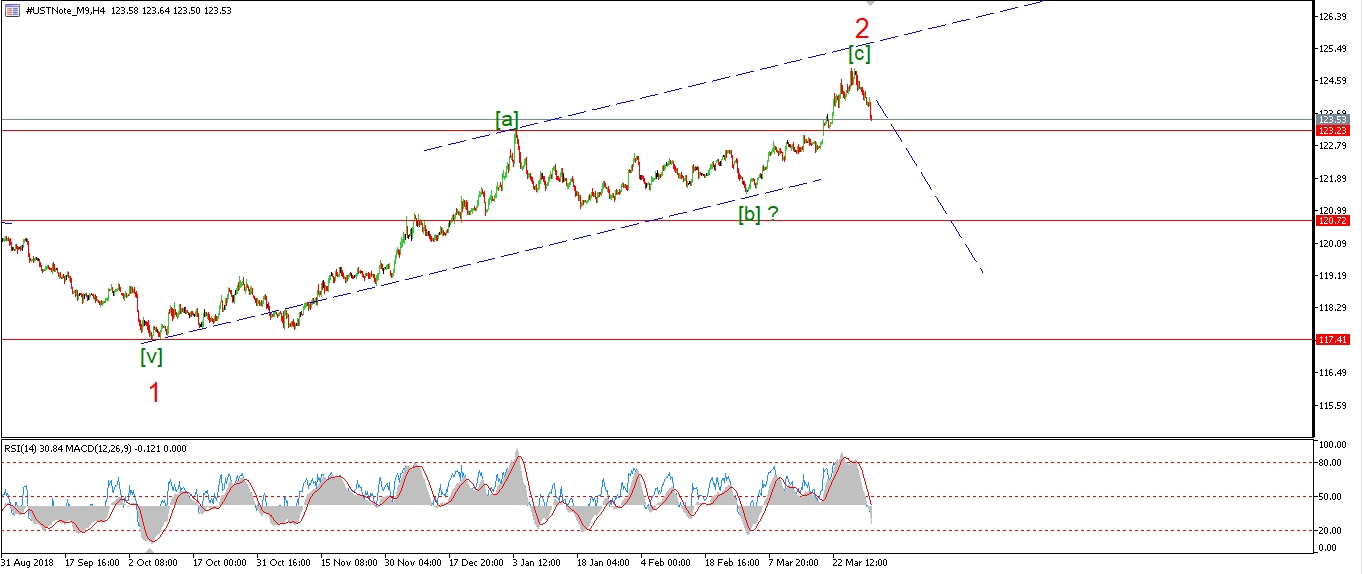 [/vc_column_text][vc_custom_heading text=”Daily” use_theme_fonts=”yes”][vc_column_text]
 [/vc_column_text][/vc_column][/vc_row]
[vc_row][vc_column][vc_column_text]
With the final hours of trading today bringing a sharp drop in bonds,
that does open up the possibility that wave ‘2’ has now topped at the recent high of 124.95.
This idea now becomes the alternate count on the short term chart.
a break of 122.95, at wave (i), will signal the top is in.
While a break of the previous wave [b] at 121.47 will confirm that wave ‘3’ down has begun.
Tomorrow;
I have continued to label this decline as wave (iv).
Watch for an impulsive turn higher in wave (v) off nearby lows.
122.95 must hold to remain with the bullish short term count.
[/vc_column_text][/vc_column][/vc_row]
[/_s2If]
[_s2If current_user_can(access_s2member_ccap_silver)]
[vc_row][vc_column][vc_separator border_width=”5″][/vc_column][/vc_row][vc_row][vc_column][vc_column_text]
SILVER
[/vc_column_text][/vc_column][/vc_row][vc_row][vc_column][vc_separator border_width=”5″][/vc_column][/vc_row][vc_row][vc_column width=”2/3″][vc_custom_heading text=”1 hr” use_theme_fonts=”yes”][vc_column_text]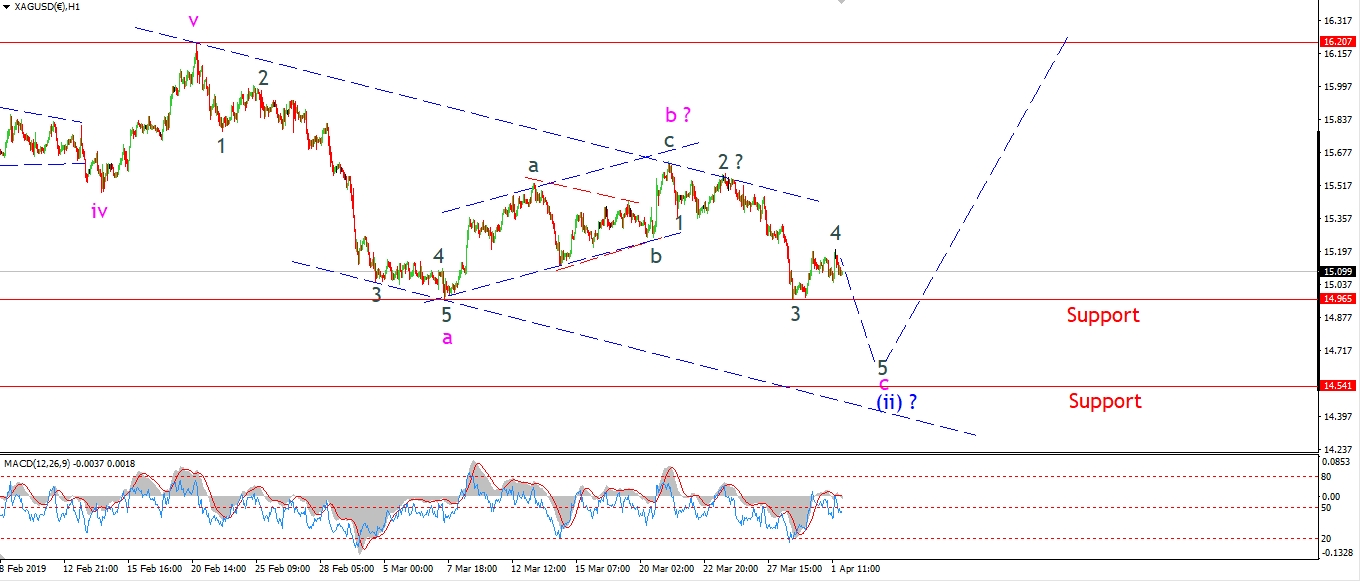 [/vc_column_text][/vc_column][vc_column width=”1/3″][vc_custom_heading text=”4 Hours” use_theme_fonts=”yes”][vc_column_text]
 [/vc_column_text][vc_custom_heading text=”Daily” use_theme_fonts=”yes”][vc_column_text]
 [/vc_column_text][/vc_column][/vc_row]
[vc_row][vc_column][vc_column_text]
Silver likely topped in wave ‘4’ of ‘c’ today.
The market is moving lower again and should push below 14.96 again in wave ‘5’ to complete the larger wave ‘c’ and wave (ii).
The minimum target for wave ‘c’ and wave (ii) has already been hit
by testing the lows of wave ‘a’ last week.
One final break of that level should do it for wave (ii).
Tomorrow;
Watch for wave ‘5’ of ‘c’ to turn lower again and complete by midweek along with GOLD.
The target lies at 14.50 for wave (ii).
[/vc_column_text][/vc_column][/vc_row]
[/_s2If]
[_s2If current_user_can(access_s2member_ccap_sp500)]
[vc_row][vc_column][vc_separator border_width=”5″][/vc_column][/vc_row][vc_row][vc_column][vc_column_text]
S&P 500.
[/vc_column_text][/vc_column][/vc_row][vc_row][vc_column][vc_separator border_width=”5″][/vc_column][/vc_row][vc_row][vc_column width=”2/3″][vc_custom_heading text=”1 hr” use_theme_fonts=”yes”][vc_column_text][/vc_column_text][/vc_column][vc_column width=”1/3″][vc_custom_heading text=”4 Hours” use_theme_fonts=”yes”][vc_column_text]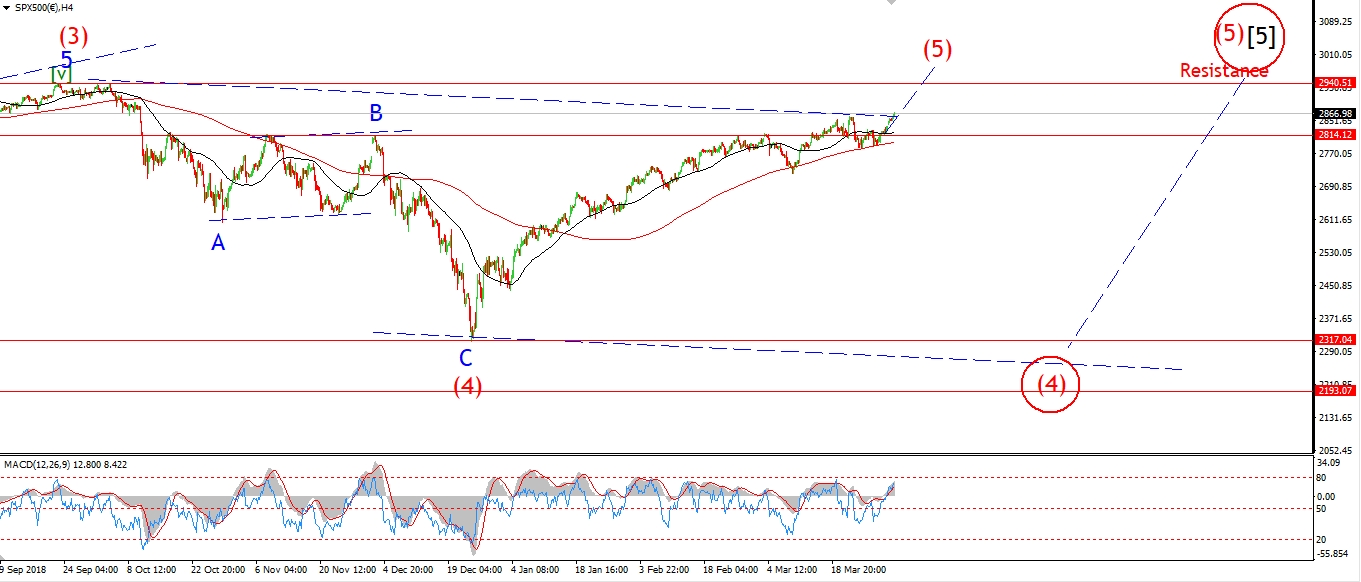 [/vc_column_text][vc_custom_heading text=”Daily” use_theme_fonts=”yes”][vc_column_text][/vc_column_text][/vc_column][/vc_row]
[vc_row][vc_column][vc_column_text]
The S&P broke out of the previous pattern at todays highs.
This rules out the idea of a top in wave ‘B’ in place.
And as with the wave count in the DOW,
The wave ‘B’ top has been relegated to the alternate count.
I have switched to the idea that we will see a new all time high in wave (5) of [5] again over the coming few weeks.
This is best viewed on the 4hr chart.
If this is wave [iii] of ‘5’ now underway,
then we will likely see an acceleration above the previous highs at 2941 this week.
Wave [iii] itself will meet the upper trendline at 2995 or so.
this is also where wave [iii] reaches 162% of wave [i].
If we do hit 3000 in wave [iii],
Then I think wave [v] will not push much beyond that level.
As the major psychological work will be done with the break of 3000.
Tomorrow;
Wave (iii) of [iii] is now in force.
This wave should break back above 2900 again before correcting in wave (iv).
[/vc_column_text][/vc_column][/vc_row]
[/_s2If]
[vc_row][vc_column][vc_column_text]
[/vc_column_text][/vc_column][/vc_row]
[vc_row][vc_column][vc_separator border_width=”5″][/vc_column][/vc_row]