
[vc_row][vc_column][vc_separator border_width=”5″][/vc_column][/vc_row]
[vc_row][vc_column][vc_column_text]
Hi everyone.
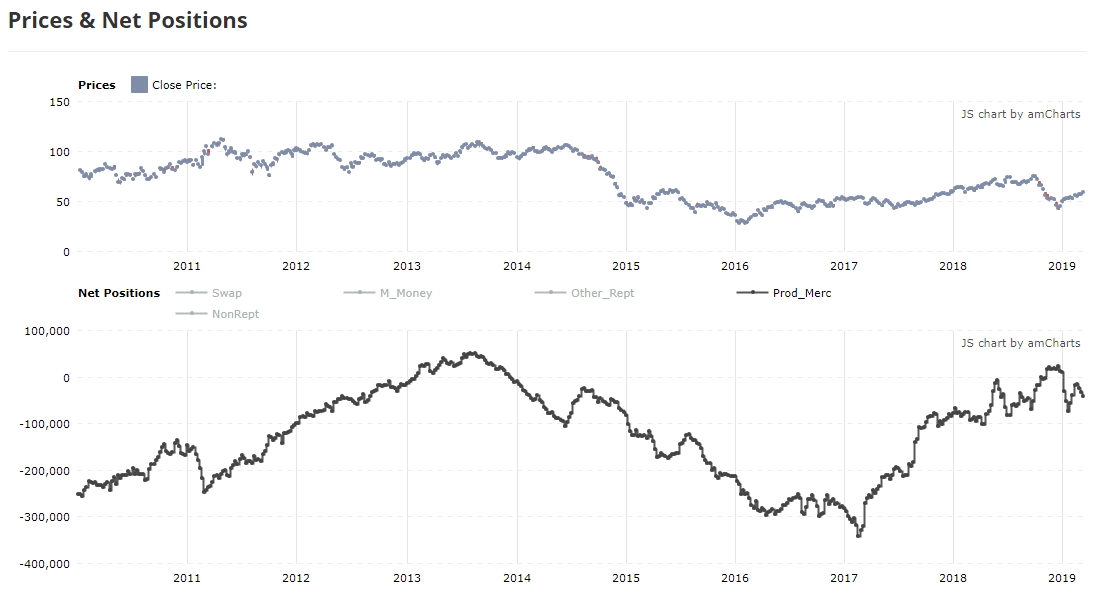
I want to start with a picture of the Crude oil market this evening.
After a big rally like we have just seen in wave (2),
you would expect that market participants would be bullish.
That is a normal contrarian stand point.
But the chart below shows the net futures position of crude oil producers.
Producers now hold their lowest hedging position since the 2013 price highs at $110 a barrel.
That previous peak in bullishness on the part of producers
was followed by a massive 70% crash in crude prices into the 2016 lows.
And here we are again,
Bullish at the high!
As per usual.
 [/vc_column_text][/vc_column][/vc_row]
[_s2If current_user_can(access_s2member_ccap_eurusd)]
[vc_row][vc_column][vc_separator border_width=”5″][/vc_column][/vc_row]
[vc_row][vc_column][vc_column_text]
EURUSD
[/vc_column_text][/vc_column][/vc_row]
[vc_row][vc_column][vc_separator border_width=”5″][/vc_column][/vc_row][vc_row][vc_column width=”2/3″][vc_custom_heading text=”1 hr” use_theme_fonts=”yes”][vc_column_text]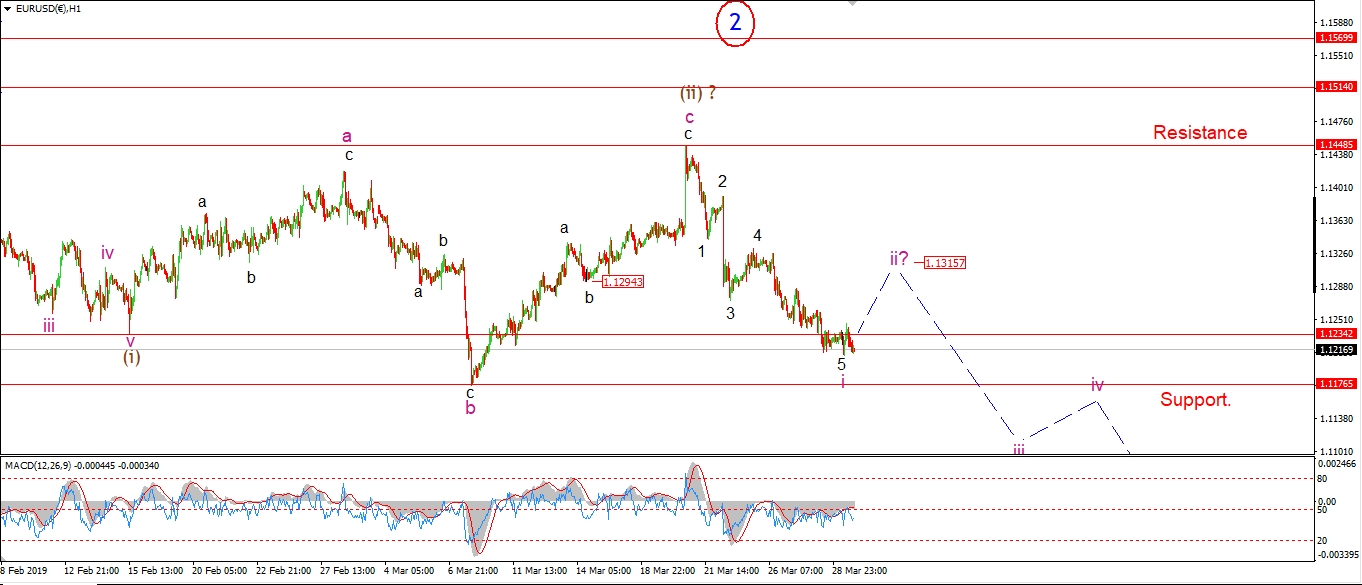 [/vc_column_text][/vc_column][vc_column width=”1/3″][vc_custom_heading text=”4 Hours” use_theme_fonts=”yes”][vc_column_text]
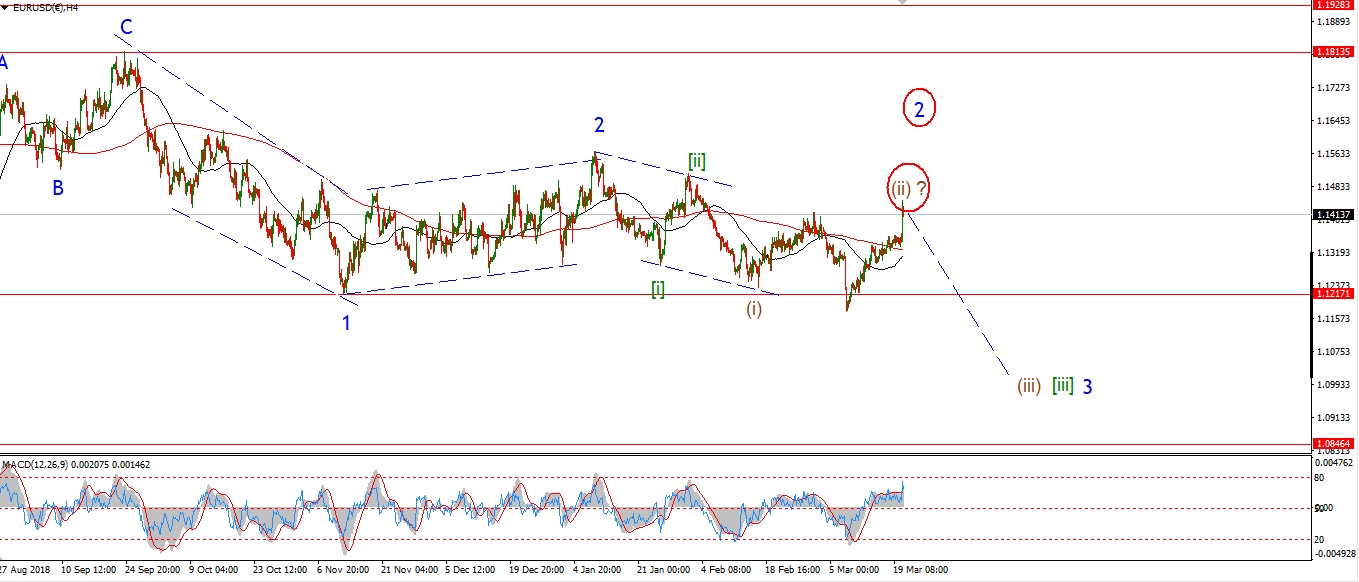 [/vc_column_text][vc_custom_heading text=”Daily” use_theme_fonts=”yes”][vc_column_text]
 [/vc_column_text][/vc_column][/vc_row]
[vc_row][vc_column][vc_column_text]
Still no upturn in wave ‘ii’ to speak of yet.
The market is dead flat today which may be the bottom of wave ‘i’.
Wave ‘ii’ is still expected to hit the high of the previous wave ‘4’ at about 1.1330 early next week.
After which we can expect another turn lower into wave ‘iii’ of (iii).
Monday;
Watch for wave ‘ii’ to begin in trace out three waves higher.
Price must not break resistance at 1.1448.
[/vc_column_text][/vc_column][/vc_row]
[/_s2If]
[_s2If current_user_can(access_s2member_ccap_gbpusd)]
[vc_row][vc_column][vc_separator border_width=”5″][/vc_column][/vc_row][vc_row][vc_column][vc_column_text]
GBPUSD
[/vc_column_text][/vc_column][/vc_row][vc_row][vc_column][vc_separator border_width=”5″][/vc_column][/vc_row][vc_row][vc_column width=”2/3″][vc_custom_heading text=”1 hr” use_theme_fonts=”yes”][vc_column_text]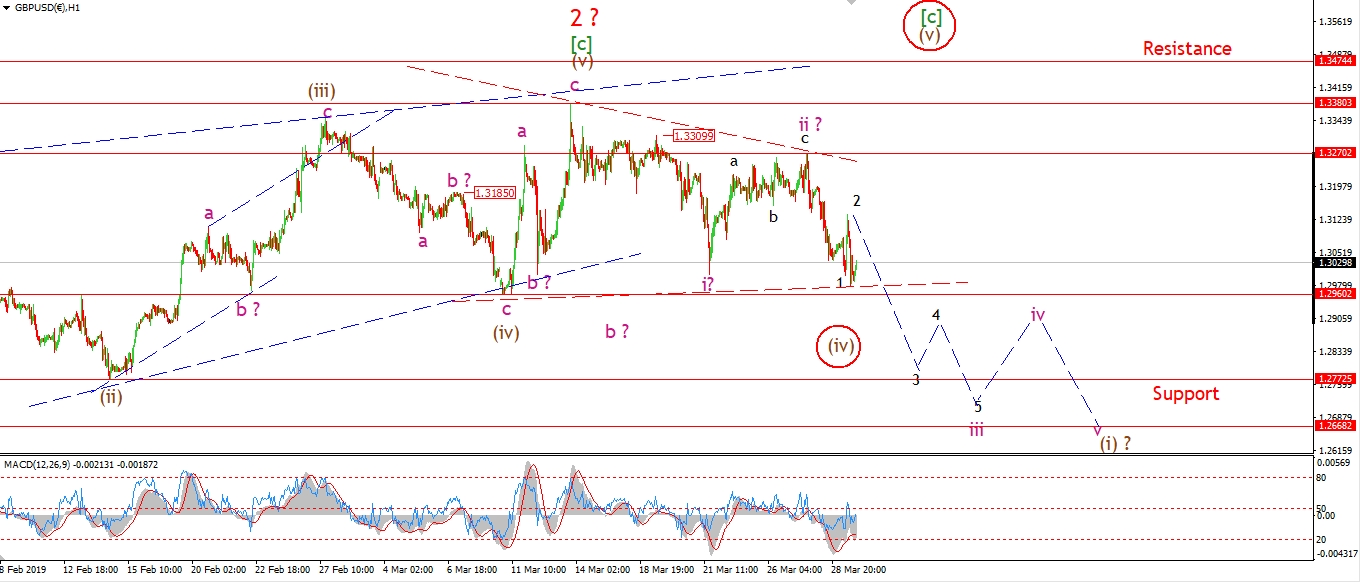 [/vc_column_text][/vc_column][vc_column width=”1/3″][vc_custom_heading text=”4 Hours” use_theme_fonts=”yes”][vc_column_text]
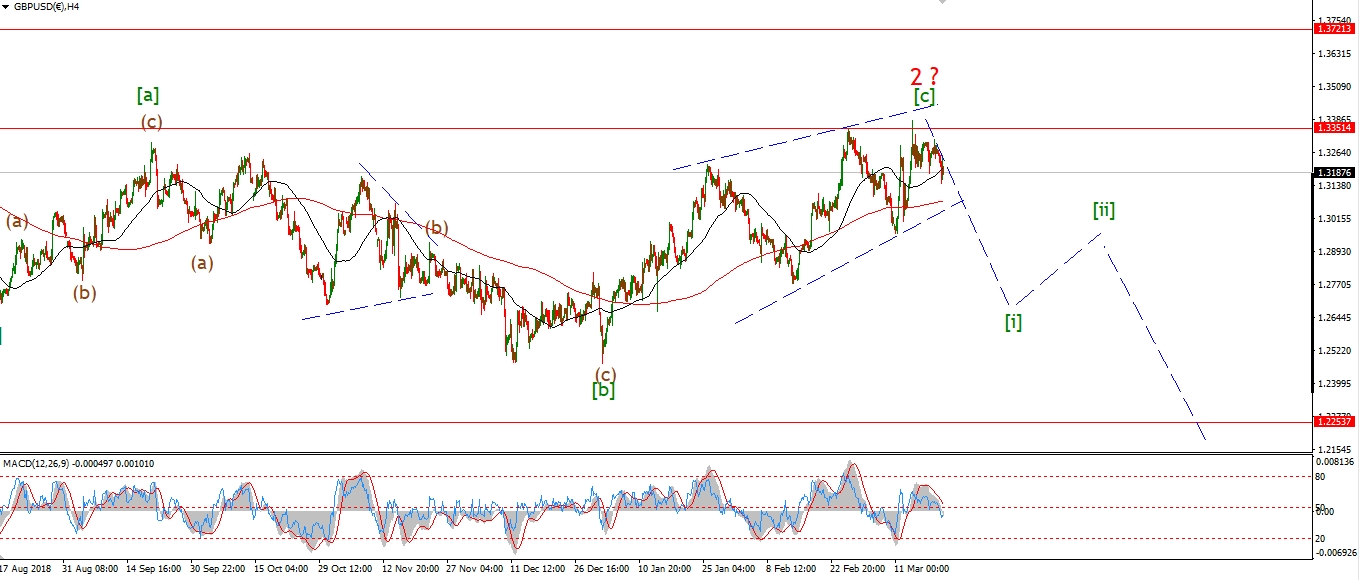 [/vc_column_text][vc_custom_heading text=”Daily” use_theme_fonts=”yes”][vc_column_text]
 [/vc_column_text][/vc_column][/vc_row]
[vc_row][vc_column][vc_column_text]
Cable broke below the interim low at wave ‘i’ today in a sharp move.
This action has reduced the probability of a triangle wave (iv) as per the alternate count.
This alternate will be ruled out entirely with a break of 1.2960.
The short term chart shows todays drop as waves ‘1’ and ‘2’ of ‘iii’ down.
The sharp move lower this afternoon is likely the beginning of wave ‘3’ of ‘iii’.
Monday;
Watch for wave ‘iii’ to break 1.2960 and rule out the alternate count.
[/vc_column_text][/vc_column][/vc_row]
[/_s2If]
[_s2If current_user_can(access_s2member_ccap_usdjpy)]
[vc_row][vc_column][vc_separator border_width=”5″][/vc_column][/vc_row][vc_row][vc_column][vc_column_text]
USDJPY
[/vc_column_text][/vc_column][/vc_row][vc_row][vc_column][vc_separator border_width=”5″][/vc_column][/vc_row][vc_row][vc_column width=”2/3″][vc_custom_heading text=”1 hr” use_theme_fonts=”yes”][vc_column_text]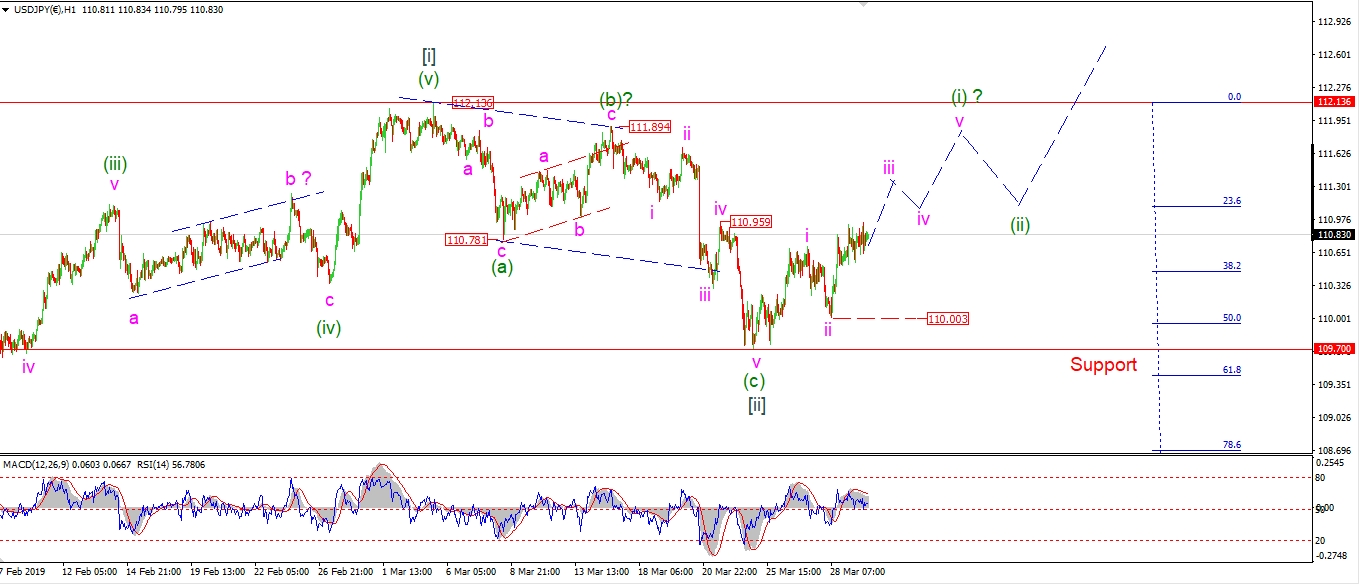 [/vc_column_text][/vc_column][vc_column width=”1/3″][vc_custom_heading text=”4 Hours” use_theme_fonts=”yes”][vc_column_text]
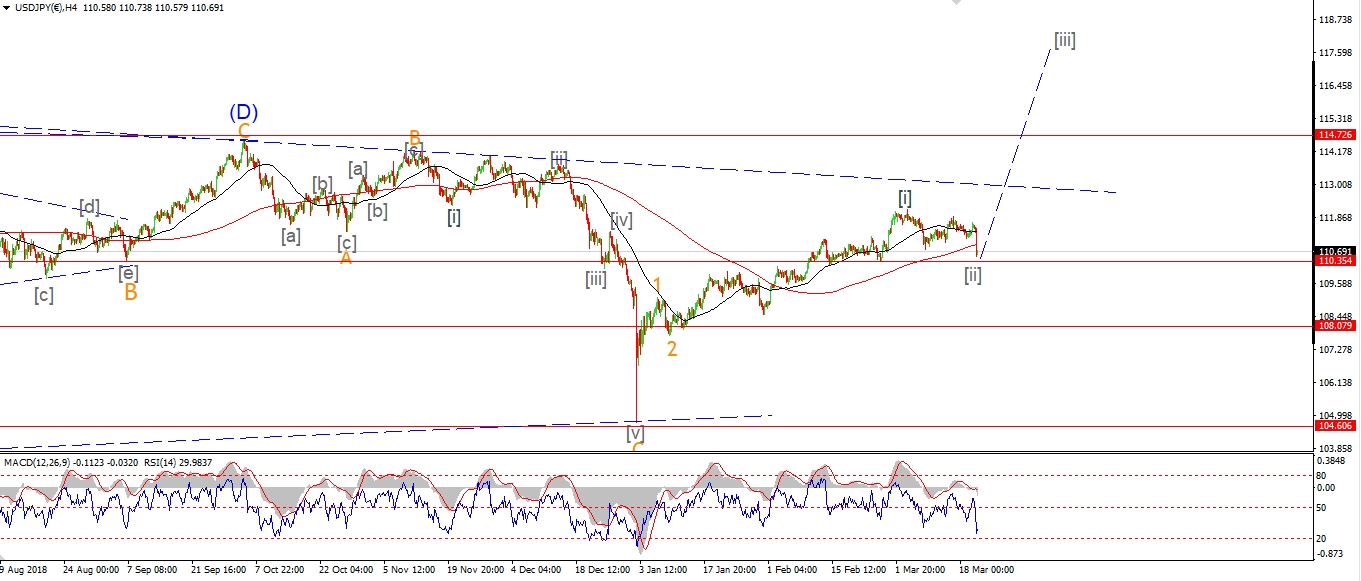 [/vc_column_text][vc_custom_heading text=”Daily” use_theme_fonts=”yes”][vc_column_text]
 [/vc_column_text][/vc_column][/vc_row]
[vc_row][vc_column][vc_column_text]
USDJPY has stalled within wave ‘iii’ up.
This can be interpreted as a second wave correction within wave ‘iii’.
If so,
then wave ‘iii’ will extend even higher than shown in the short term chart before completing.
Possibly hitting the 112.00 area in wave ‘iii’.
How ever wave ‘iii’ plays out,
the recent low at 110.003 must hold.
Monday;
Watch for wave ‘iii’ to continue higher early next week
with any corrections being temporary and minor within that wave.
We may even see a bullish impulse wave complete by the end of next week to lead us into wave [iii] up.
[/vc_column_text][/vc_column][/vc_row]
[/_s2If]
[_s2If current_user_can(access_s2member_ccap_dow_jones)]
[vc_row][vc_column][vc_separator border_width=”5″][/vc_column][/vc_row][vc_row][vc_column][vc_column_text]
DOW JONES INDUSTRIALS
[/vc_column_text][/vc_column][/vc_row][vc_row][vc_column][vc_separator border_width=”5″][/vc_column][/vc_row][vc_row][vc_column width=”2/3″][vc_custom_heading text=”1 hr” use_theme_fonts=”yes”][vc_column_text]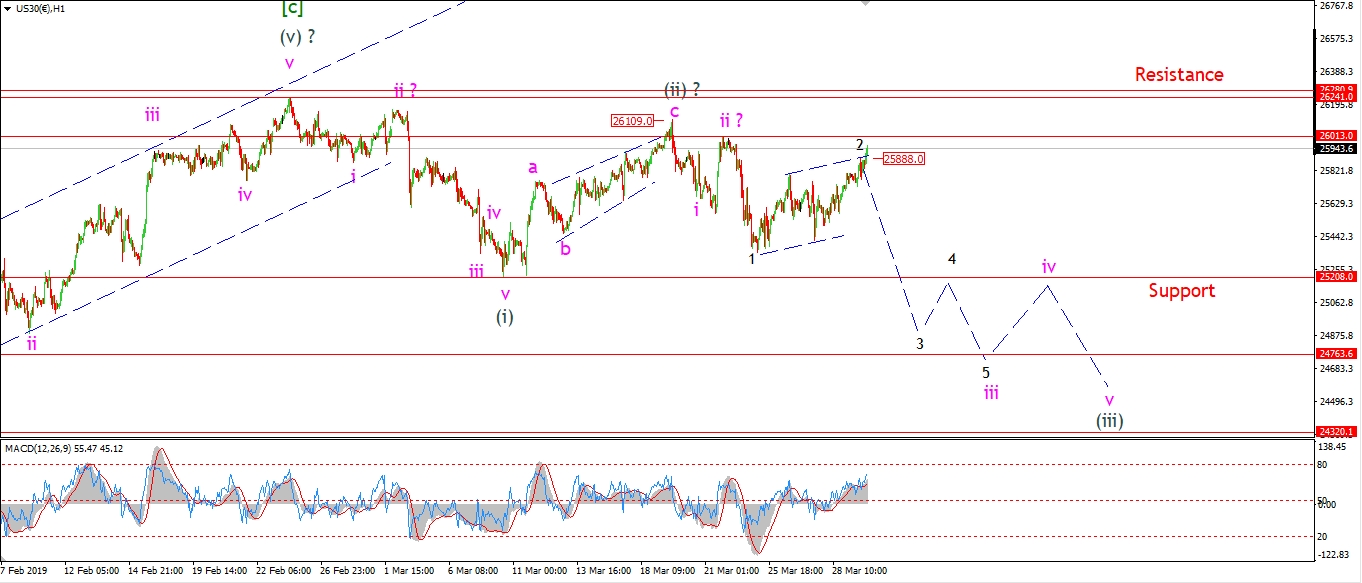 [/vc_column_text][/vc_column][vc_column width=”1/3″][vc_custom_heading text=”4 Hours” use_theme_fonts=”yes”][vc_column_text]
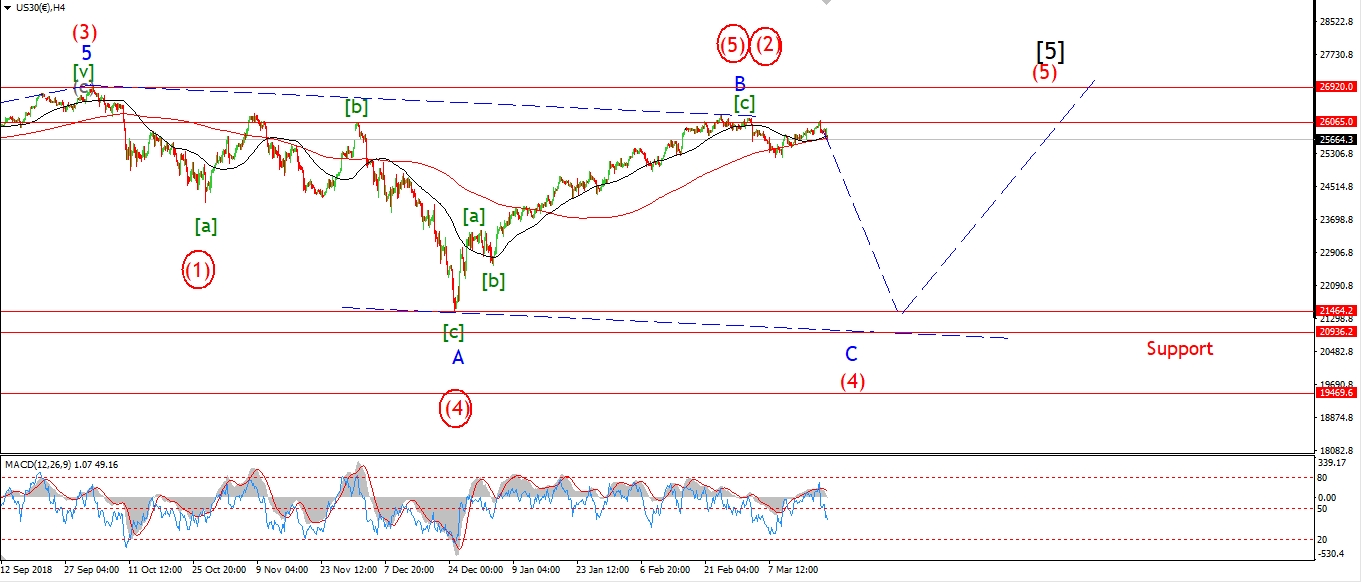 [/vc_column_text][vc_custom_heading text=”Daily” use_theme_fonts=”yes”][vc_column_text]
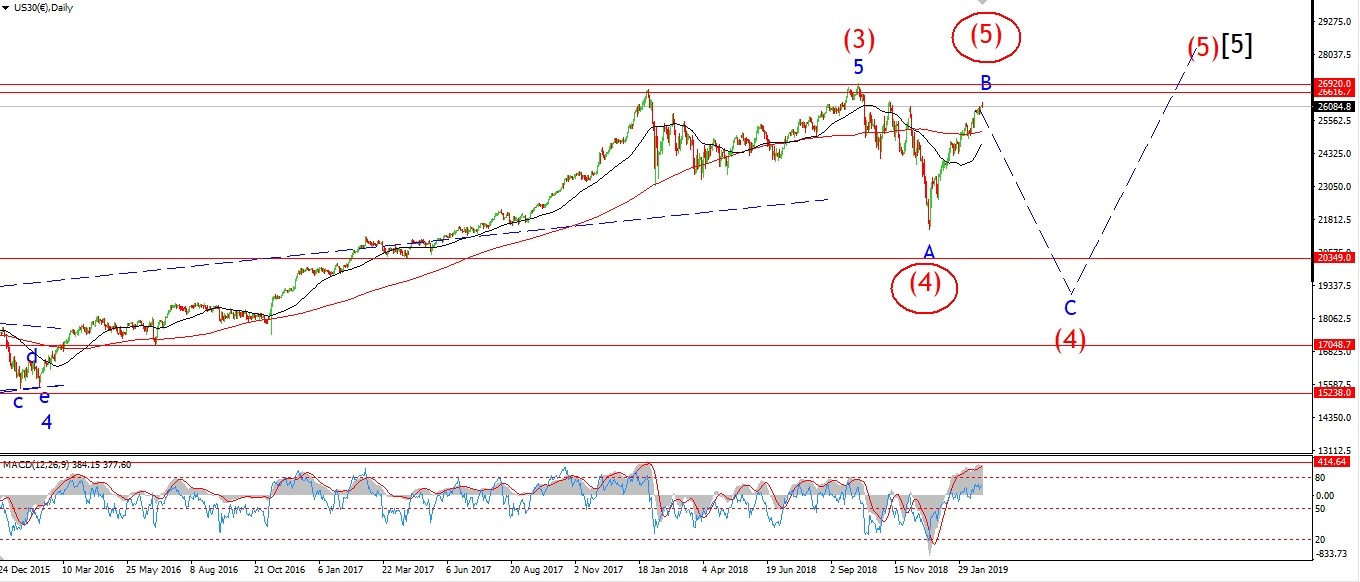 [/vc_column_text][/vc_column][/vc_row]
[vc_row][vc_column][vc_column_text]
The price rise today has now filled the trend channel in three waves to the upside.
This is labelled wave ‘2’ up as a complex flat correction.
And it should be followed by wave ‘3’ down to break support at 25208.
So far the market has not broken down as the bearish pattern suggests it should.
That does not mean it wont though,
so it is still worth erring on the side of caution.
I spoke about the alternate idea in the video this evening.
That involves a triangle wave [iv] to be followed by a new high.
If 25208 breaks next week,
that action will rule out a triangle as a possible alternate.
Monday;
Watch for the resistance at 26013 to hold and a sharp reversal in wave ‘iii’ down to break 25208.
[/vc_column_text][/vc_column][/vc_row]
[/_s2If]
[_s2If current_user_can(access_s2member_ccap_gold)]
[vc_row][vc_column][vc_separator border_width=”5″][/vc_column][/vc_row][vc_row][vc_column][vc_column_text]
GOLD
[/vc_column_text][/vc_column][/vc_row][vc_row][vc_column][vc_separator border_width=”5″][/vc_column][/vc_row][vc_row][vc_column width=”2/3″][vc_custom_heading text=”1 hr” use_theme_fonts=”yes”][vc_column_text]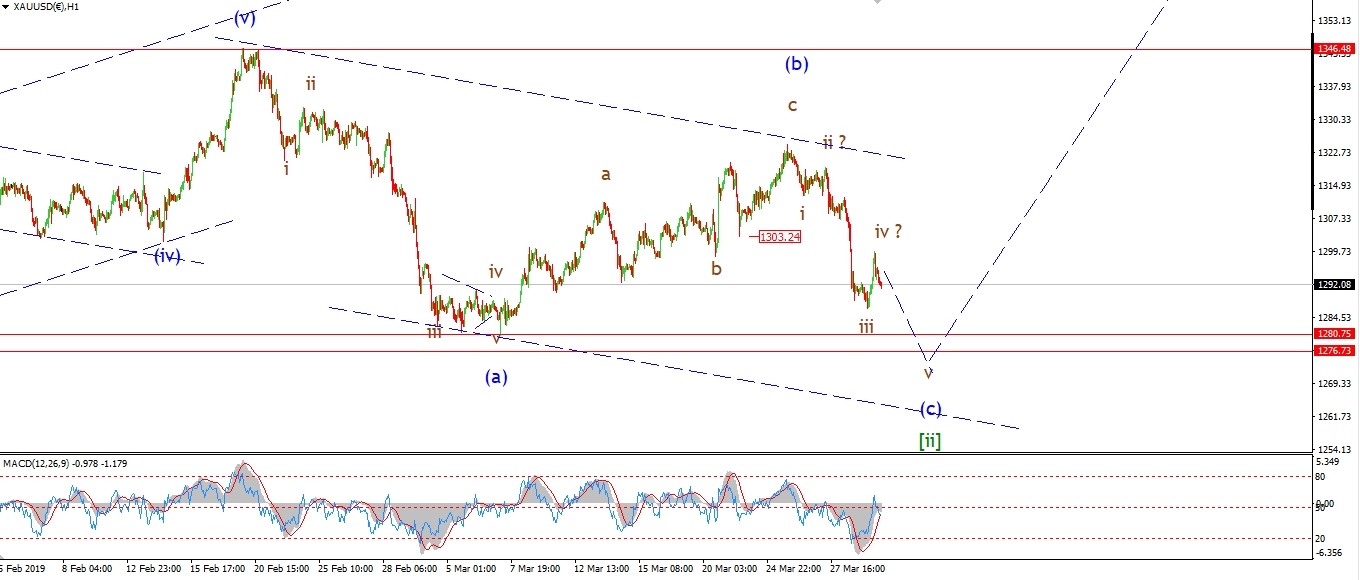 [/vc_column_text][/vc_column][vc_column width=”1/3″][vc_custom_heading text=”4 Hours” use_theme_fonts=”yes”][vc_column_text]
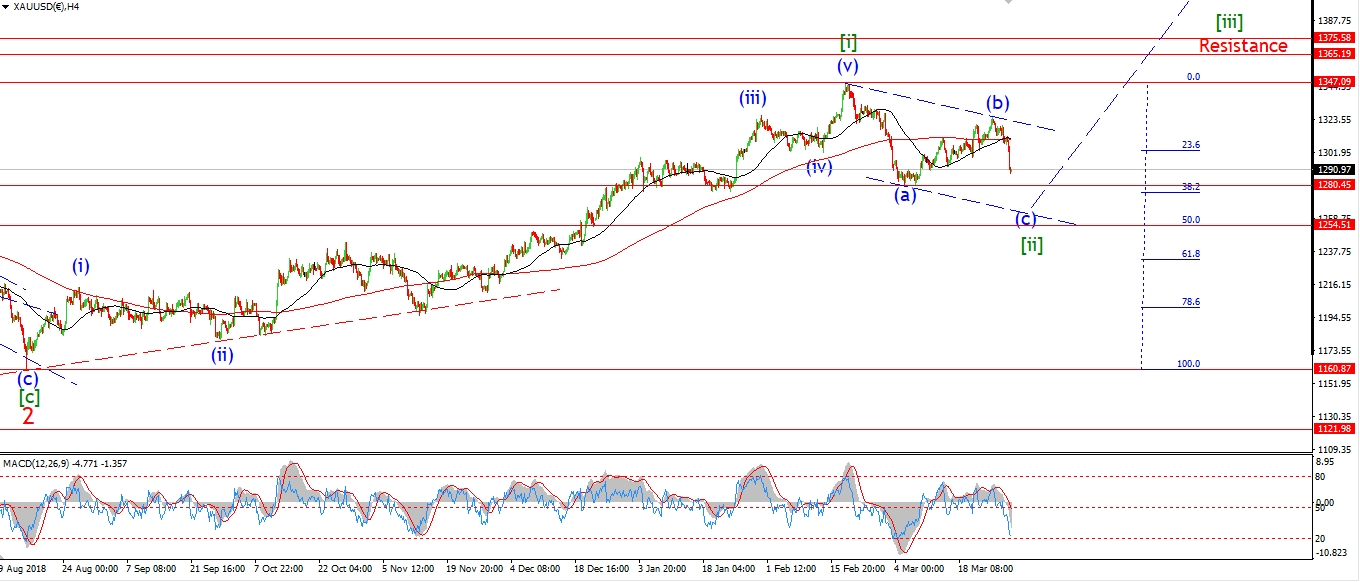 [/vc_column_text][vc_custom_heading text=”Daily” use_theme_fonts=”yes”][vc_column_text]
 [/vc_column_text][/vc_column][/vc_row]
[vc_row][vc_column][vc_column_text]
GOLD has so far played ball within the new wave count.
Wave ‘iii’ down has traced out a clear five wave internal pattern.
Wave ‘iv’ is now underway off that early morning low in wave ‘iii’.
It may even be complete at the session high,
we will on Monday how that goes.
This evening the price has turned lower again into a possible wave ‘v’ of (c).
Monday;
Watch for a break of the previous wave (a) low at 1280 to complete wave (c) and wave [ii].
Next week should bring the initial move higher into wave [iii].
And a bullish opportunity should present itself later next week,
with the formation of a bullish higher low off the wave [ii] low.
[/vc_column_text][/vc_column][/vc_row]
[/_s2If]
[_s2If current_user_can(access_s2member_ccap_crude)]
[vc_row][vc_column][vc_separator border_width=”5″][/vc_column][/vc_row][vc_row][vc_column][vc_column_text]
U.S CRUDE OIL
[/vc_column_text][/vc_column][/vc_row][vc_row][vc_column][vc_separator border_width=”5″][/vc_column][/vc_row][vc_row][vc_column width=”2/3″][vc_custom_heading text=”1 hr” use_theme_fonts=”yes”][vc_column_text]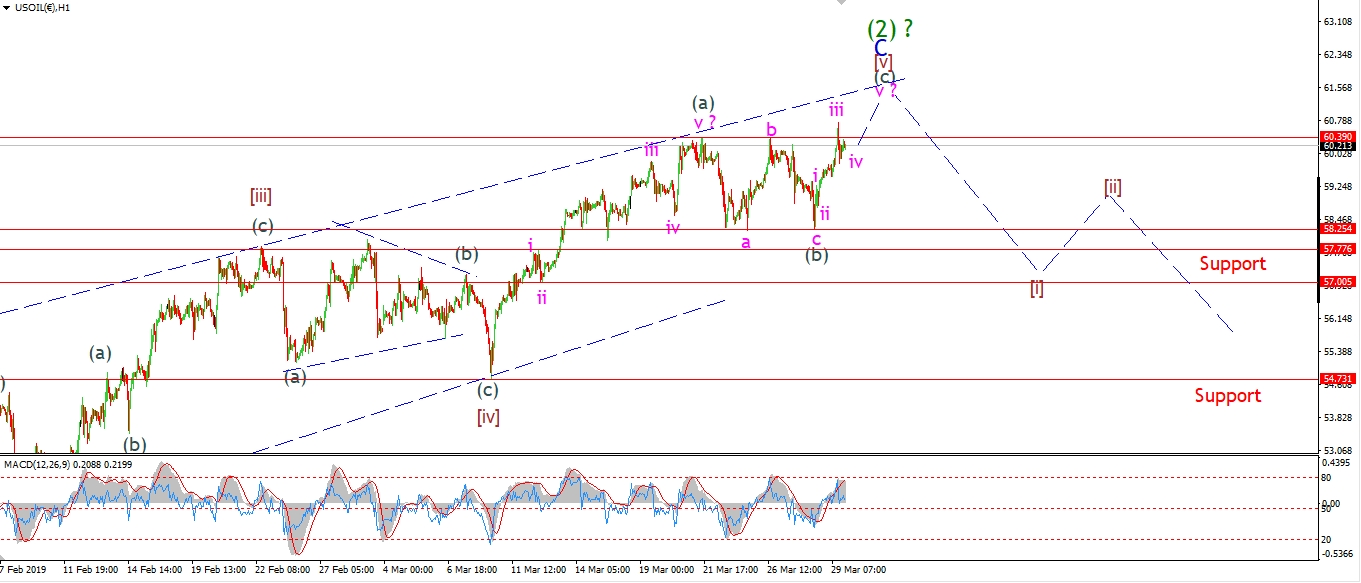 [/vc_column_text][/vc_column][vc_column width=”1/3″][vc_custom_heading text=”4 Hours” use_theme_fonts=”yes”][vc_column_text]
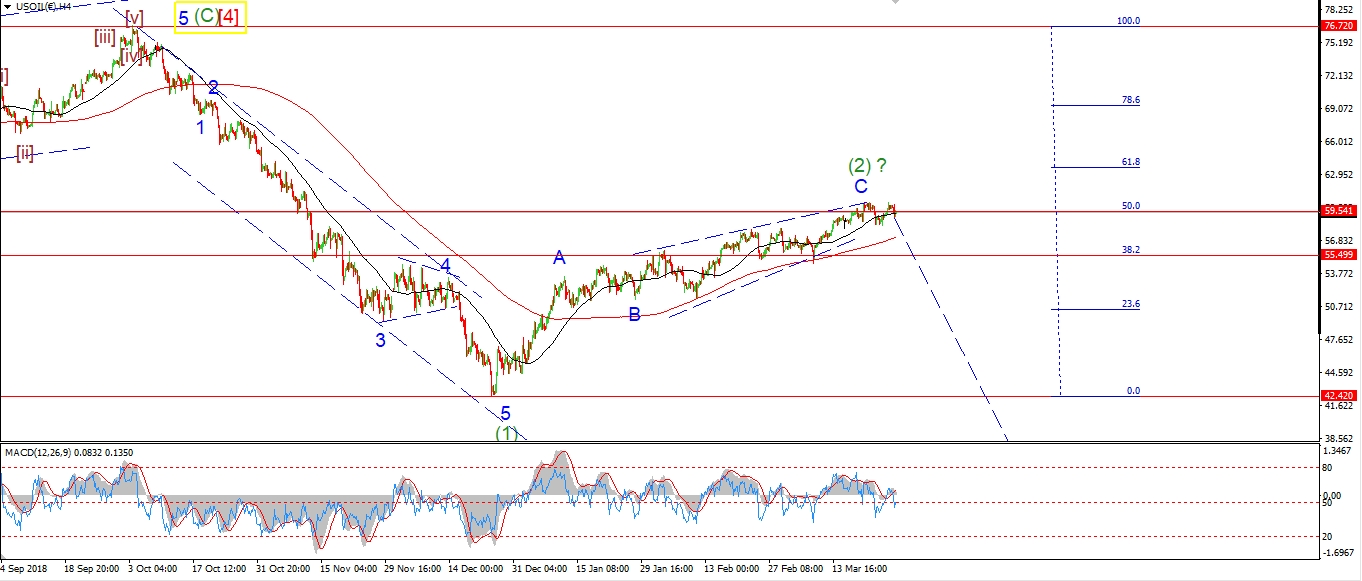 [/vc_column_text][vc_custom_heading text=”Daily” use_theme_fonts=”yes”][vc_column_text]
 [/vc_column_text][/vc_column][/vc_row]
[vc_row][vc_column][vc_column_text]
Todays rally has broke out of the double top formation at 60.39.
This action confirms the recent sideways move as a correction in wave (b) of [v].
Wave (c) is well underway,
and is likely to hit the upper trendline at 61.56 to complete.
That upper trendline marks out wave ‘C’ as an ending diagonal wave.
Which means we are at the end of this correction in wave (2).
We will see a turn lower in a big way once wave [v] of ‘C’ completes.
Monday;
The main aim is still to identify a top in wave ‘C’ to complete wave (2),
and then work on an impulse wave lower to begin wave (3) down.
Going on how bullish crude oil producers are at the minute,
I think this top in wave (2) will yield to an even bigger decline than we witnessed late last year.
[/vc_column_text][/vc_column][/vc_row]
[/_s2If]
[_s2If current_user_can(access_s2member_ccap_us10yr)]
[vc_row][vc_column][vc_separator border_width=”5″][/vc_column][/vc_row][vc_row][vc_column][vc_column_text]
US 10 yr Treasuries.
[/vc_column_text][/vc_column][/vc_row][vc_row][vc_column][vc_separator border_width=”5″][/vc_column][/vc_row][vc_row][vc_column width=”2/3″][vc_custom_heading text=”1 hr” use_theme_fonts=”yes”][vc_column_text]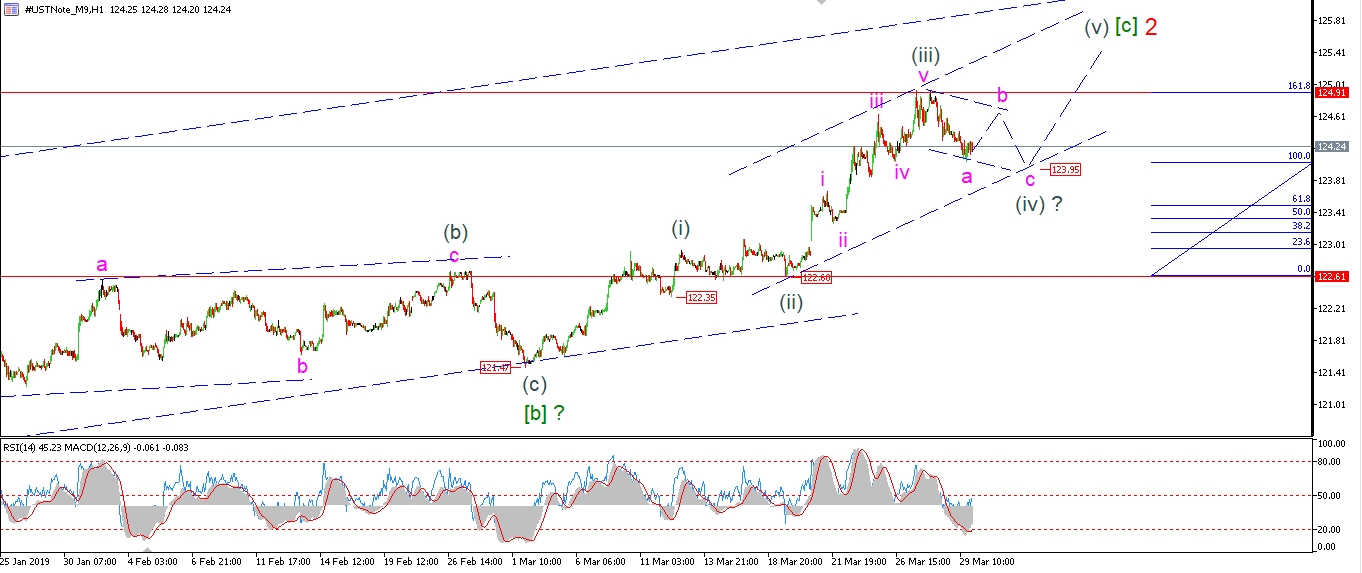 [/vc_column_text][/vc_column][vc_column width=”1/3″][vc_custom_heading text=”4 Hours” use_theme_fonts=”yes”][vc_column_text]
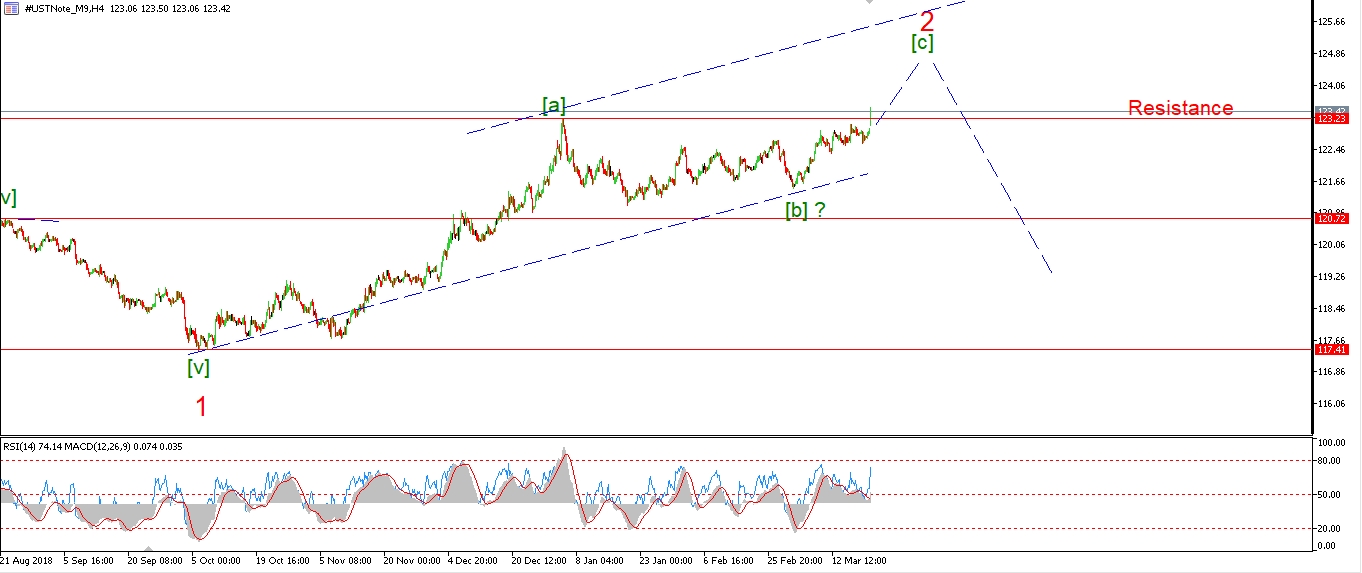 [/vc_column_text][vc_custom_heading text=”Daily” use_theme_fonts=”yes”][vc_column_text]
 [/vc_column_text][/vc_column][/vc_row]
[vc_row][vc_column][vc_column_text]
The market dropped today in wave ‘a’ of (iv).
Wave ‘b’ should return higher on Monday all going to plan,
then wave ‘c’ down to complete wave (iv).
The correction in wave (iv) should complete at about 123.80 or there about.
And we should be done with it altogether by the end of next week.
Wave (v) should then push higher for one last hurrah to complete wave [c] and ‘2’.
Monday;
Watch for wave ‘b’ and ‘c’ to trace out next week to complete wave (iv).
[/vc_column_text][/vc_column][/vc_row]
[/_s2If]
[_s2If current_user_can(access_s2member_ccap_silver)]
[vc_row][vc_column][vc_separator border_width=”5″][/vc_column][/vc_row][vc_row][vc_column][vc_column_text]
SILVER
[/vc_column_text][/vc_column][/vc_row][vc_row][vc_column][vc_separator border_width=”5″][/vc_column][/vc_row][vc_row][vc_column width=”2/3″][vc_custom_heading text=”1 hr” use_theme_fonts=”yes”][vc_column_text] [/vc_column_text][/vc_column][vc_column width=”1/3″][vc_custom_heading text=”4 Hours” use_theme_fonts=”yes”][vc_column_text]
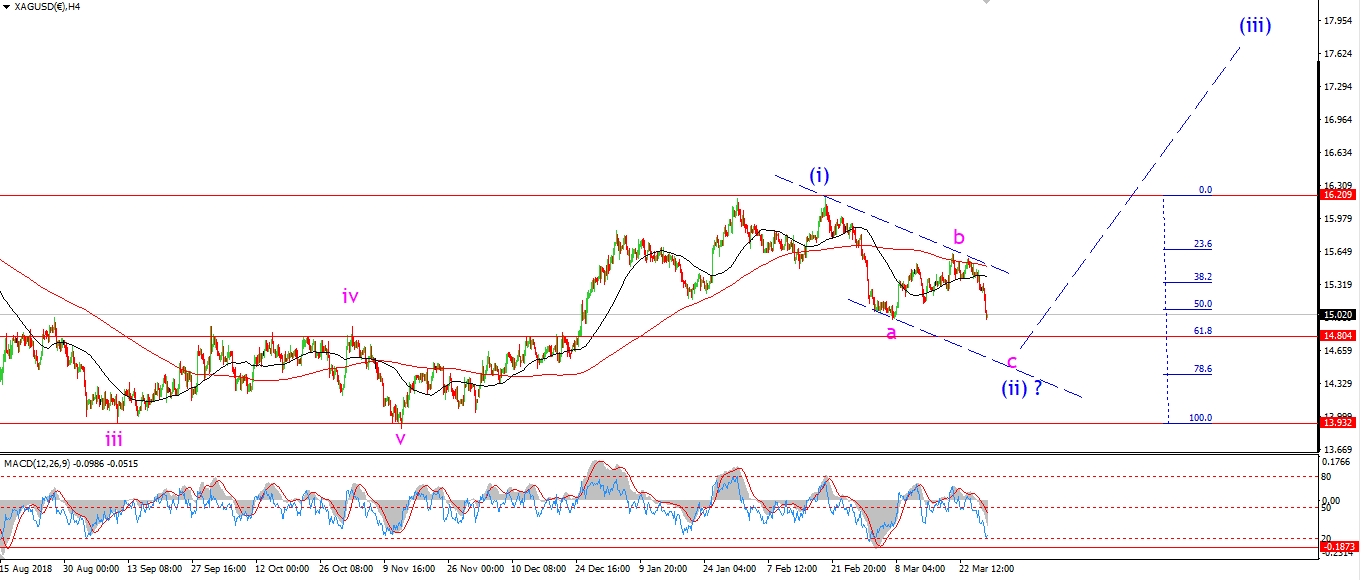 [/vc_column_text][vc_custom_heading text=”Daily” use_theme_fonts=”yes”][vc_column_text]
 [/vc_column_text][/vc_column][/vc_row]
[vc_row][vc_column][vc_column_text]
Silver did not quite break the support level at 14.96 today.
Although it was enough to rule out the previous wave count altogether.
Price has pushed higher again today.
This is viewed as wave ‘4’ of ‘c’,
wave ‘5’ should break support again at a minimum
to complete wave ‘c’ and wave (ii).
Once this happens,
we will have a large impulse pattern higher complete off the November lows as seen on the 4hr chart.
And then I think we will be set for a large rally in wave (iii) up.
Monday;
That rally might even begin next week depending on how quick the price completes wave ‘c’.
Watch for a significant low to be reached at about 14.75 in wave (ii) next week.
[/vc_column_text][/vc_column][/vc_row]
[/_s2If]
[_s2If current_user_can(access_s2member_ccap_sp500)]
[vc_row][vc_column][vc_separator border_width=”5″][/vc_column][/vc_row][vc_row][vc_column][vc_column_text]
S&P 500.
[/vc_column_text][/vc_column][/vc_row][vc_row][vc_column][vc_separator border_width=”5″][/vc_column][/vc_row][vc_row][vc_column width=”2/3″][vc_custom_heading text=”1 hr” use_theme_fonts=”yes”][vc_column_text]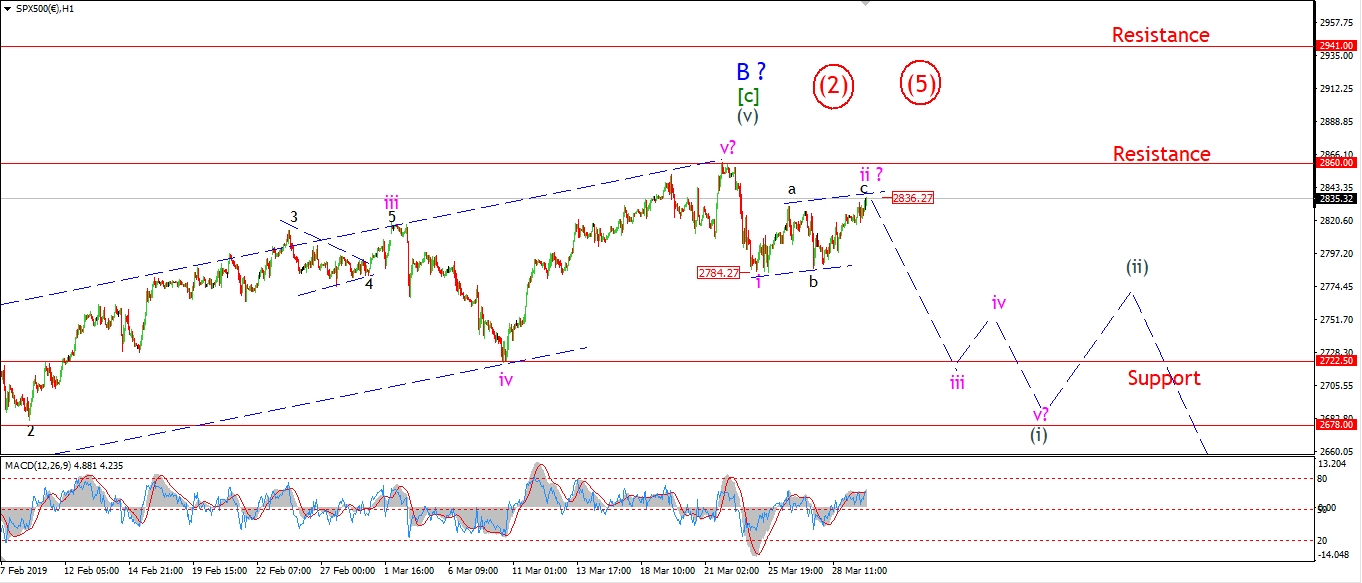 [/vc_column_text][/vc_column][vc_column width=”1/3″][vc_custom_heading text=”4 Hours” use_theme_fonts=”yes”][vc_column_text]
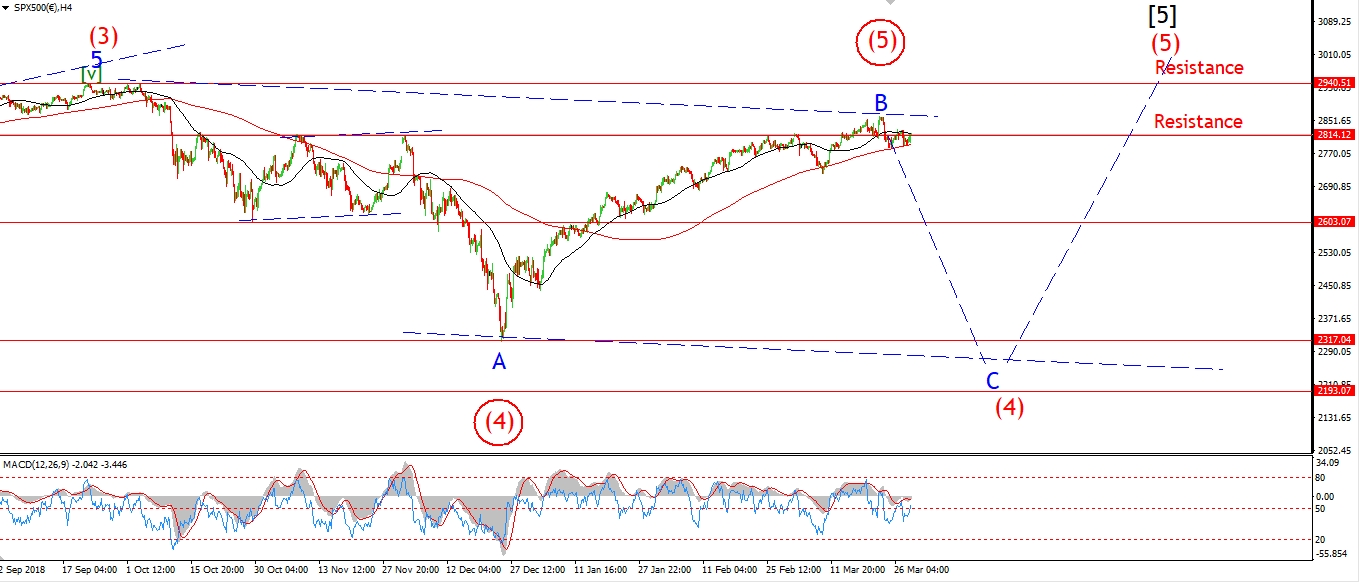 [/vc_column_text][vc_custom_heading text=”Daily” use_theme_fonts=”yes”][vc_column_text]
 [/vc_column_text][/vc_column][/vc_row]
[vc_row][vc_column][vc_column_text]
The S&P has also filled the trend channel in wave ‘ii’ at todays highs.
There is a clear three wave structure evident,
so this is a corrective form,
and should be followed by a decline in five waves in wave ‘iii’.
The price is running closer to invalidation at this evenings highs.
So Mondays trade must be a solid down day
to push lower and clear of danger at 2860.
Monday;
I am still waiting patiently for a five wave decline to trace out off the high.
A decline next week to break 2784 should be wave ‘iii’ down.
And wave ‘iii’ should break the previous wave ‘iv’ at 2722.
[/vc_column_text][/vc_column][/vc_row]
[/_s2If]
[vc_row][vc_column][vc_column_text]
Have a great weekend all.
God bless,
see you Monday.
[/vc_column_text][/vc_column][/vc_row]
[vc_row][vc_column][vc_separator border_width=”5″][/vc_column][/vc_row]