
[vc_row][vc_column][vc_separator border_width=”5″][/vc_column][/vc_row]
[vc_row][vc_column][vc_column_text]
Hello everyone.
[/vc_column_text][/vc_column][/vc_row]
[_s2If current_user_can(access_s2member_ccap_eurusd)]
[vc_row][vc_column][vc_separator border_width=”5″][/vc_column][/vc_row]
[vc_row][vc_column][vc_column_text]
EURUSD
[/vc_column_text][/vc_column][/vc_row]
[vc_row][vc_column][vc_separator border_width=”5″][/vc_column][/vc_row][vc_row][vc_column width=”2/3″][vc_custom_heading text=”1 hr” use_theme_fonts=”yes”][vc_column_text]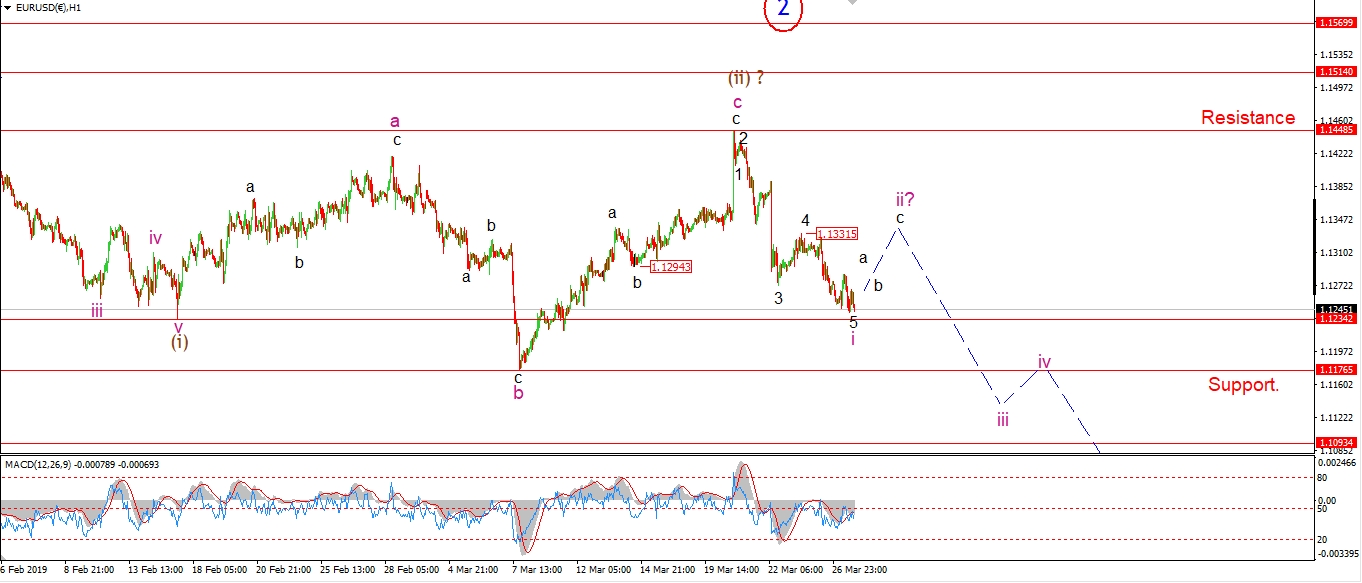 [/vc_column_text][/vc_column][vc_column width=”1/3″][vc_custom_heading text=”4 Hours” use_theme_fonts=”yes”][vc_column_text]
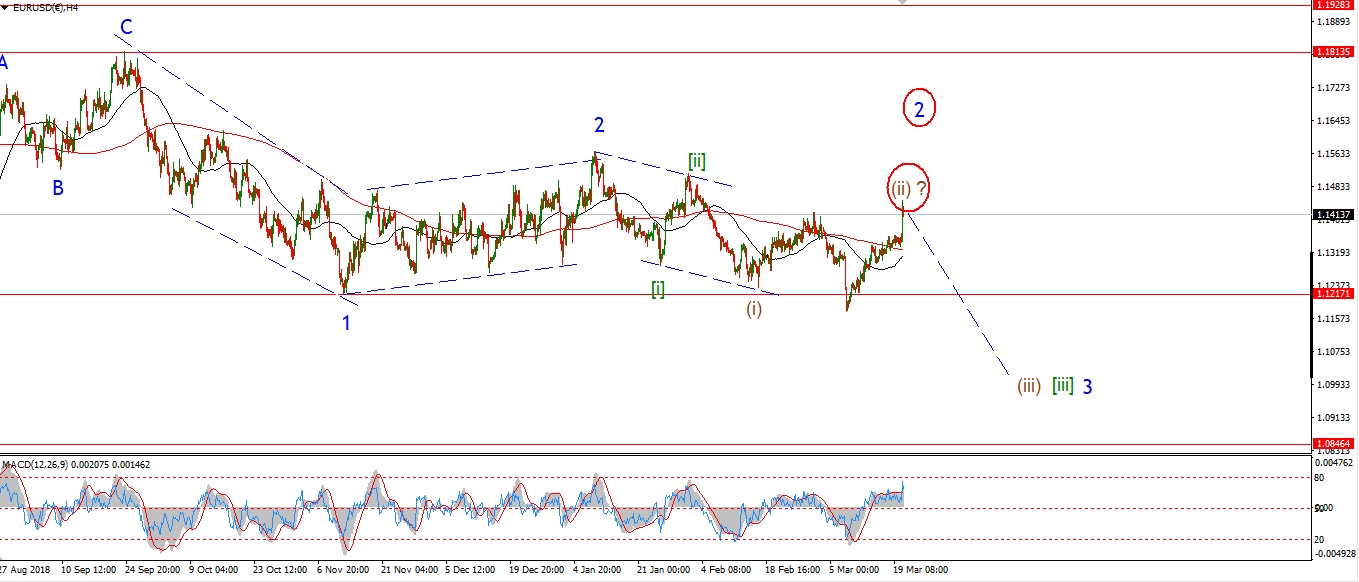 [/vc_column_text][vc_custom_heading text=”Daily” use_theme_fonts=”yes”][vc_column_text]
 [/vc_column_text][/vc_column][/vc_row]
[vc_row][vc_column][vc_column_text]
The decline off the 1.1331 high again traced out a five wave form,
so todays low now takes the wave ‘i’ label,
with wave ‘ii’ left to complete a three wave corrective rally and a full impulse wave lower off the wave (ii) high.
The previous fourth wave at 1.1330 is the target for wave ‘ii’.
Once that completes,
we can then look lower into wave ‘iii’ down.
Tomorrow;
Watch for a retracement in a possible wave ‘ii’ to about 1.1330.
Wave ‘iii’ down should return lower again.
[/vc_column_text][/vc_column][/vc_row]
[/_s2If]
[_s2If current_user_can(access_s2member_ccap_gbpusd)]
[vc_row][vc_column][vc_separator border_width=”5″][/vc_column][/vc_row][vc_row][vc_column][vc_column_text]
GBPUSD
[/vc_column_text][/vc_column][/vc_row][vc_row][vc_column][vc_separator border_width=”5″][/vc_column][/vc_row][vc_row][vc_column width=”2/3″][vc_custom_heading text=”1 hr” use_theme_fonts=”yes”][vc_column_text]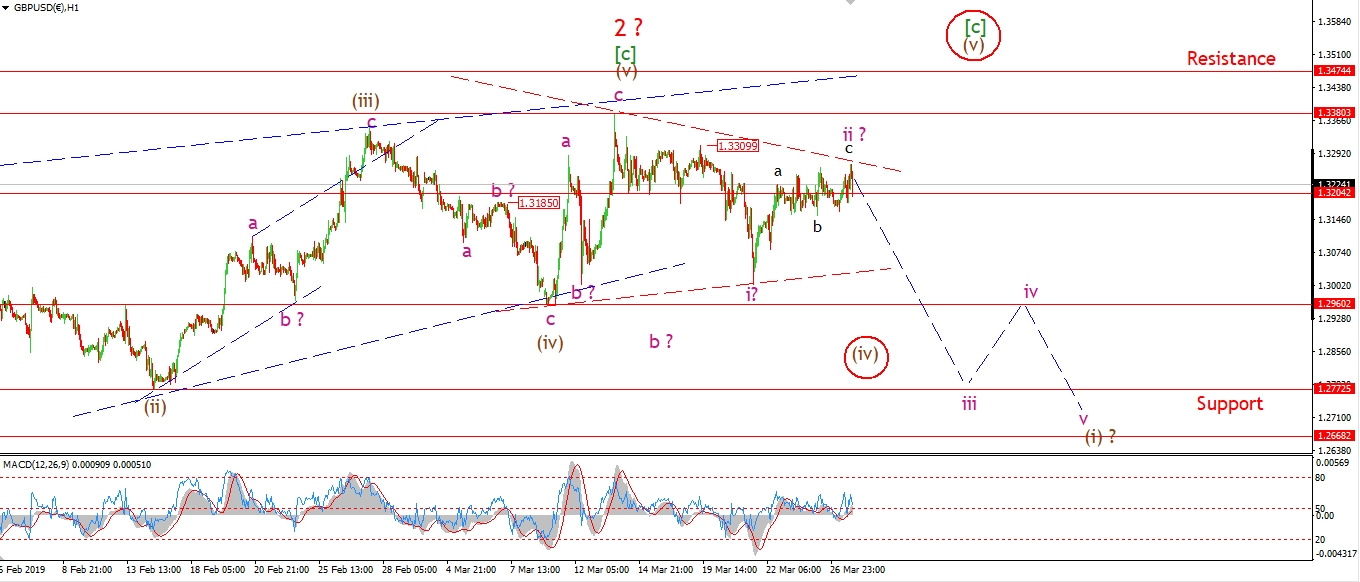 [/vc_column_text][/vc_column][vc_column width=”1/3″][vc_custom_heading text=”4 Hours” use_theme_fonts=”yes”][vc_column_text]
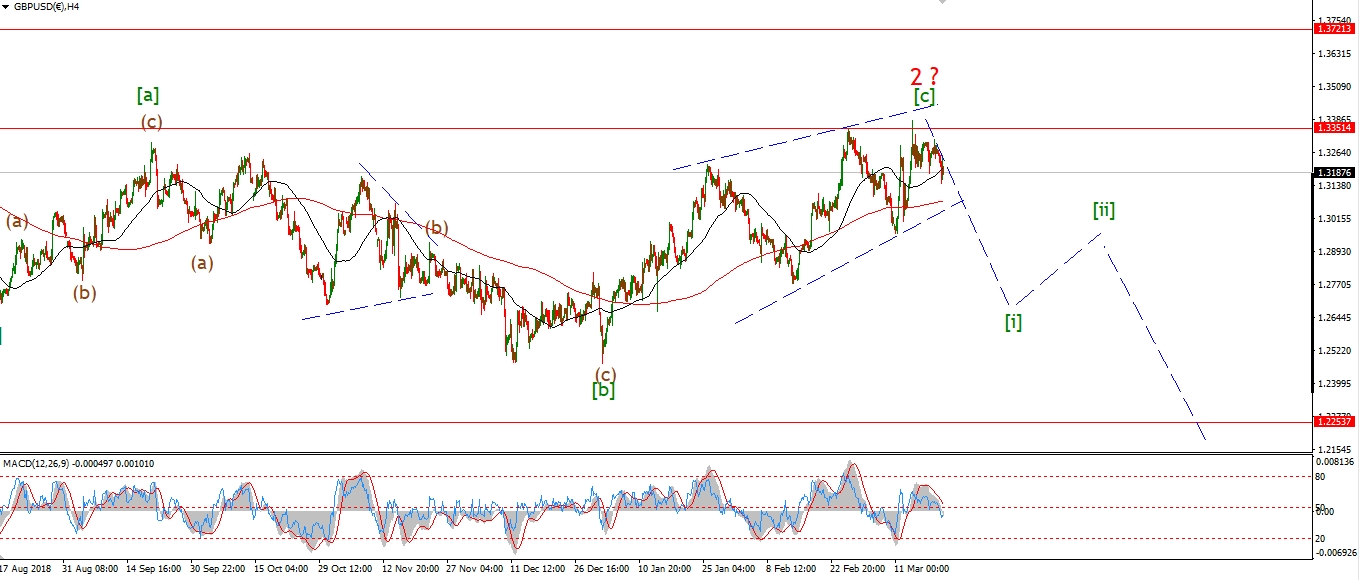 [/vc_column_text][vc_custom_heading text=”Daily” use_theme_fonts=”yes”][vc_column_text]
 [/vc_column_text][/vc_column][/vc_row]
[vc_row][vc_column][vc_column_text]
The action in cable is a long way from ideal at the moment.
But so far we have not seen anything to trigger the alternate count either.
So for the moment,
I will work with the idea that wave (i) down is developing.
The action will clear up soon enough to point us in the right direction in the short term.
Tomorrow;
Todays rise is again in three waves.
This may be enough to complete a double combination wave ‘ii’.
watch for a return lower in wave ‘iii’ which will be confirmed with a break of 1.2960.
[/vc_column_text][/vc_column][/vc_row]
[/_s2If]
[_s2If current_user_can(access_s2member_ccap_usdjpy)]
[vc_row][vc_column][vc_separator border_width=”5″][/vc_column][/vc_row][vc_row][vc_column][vc_column_text]
USDJPY
[/vc_column_text][/vc_column][/vc_row][vc_row][vc_column][vc_separator border_width=”5″][/vc_column][/vc_row][vc_row][vc_column width=”2/3″][vc_custom_heading text=”1 hr” use_theme_fonts=”yes”][vc_column_text]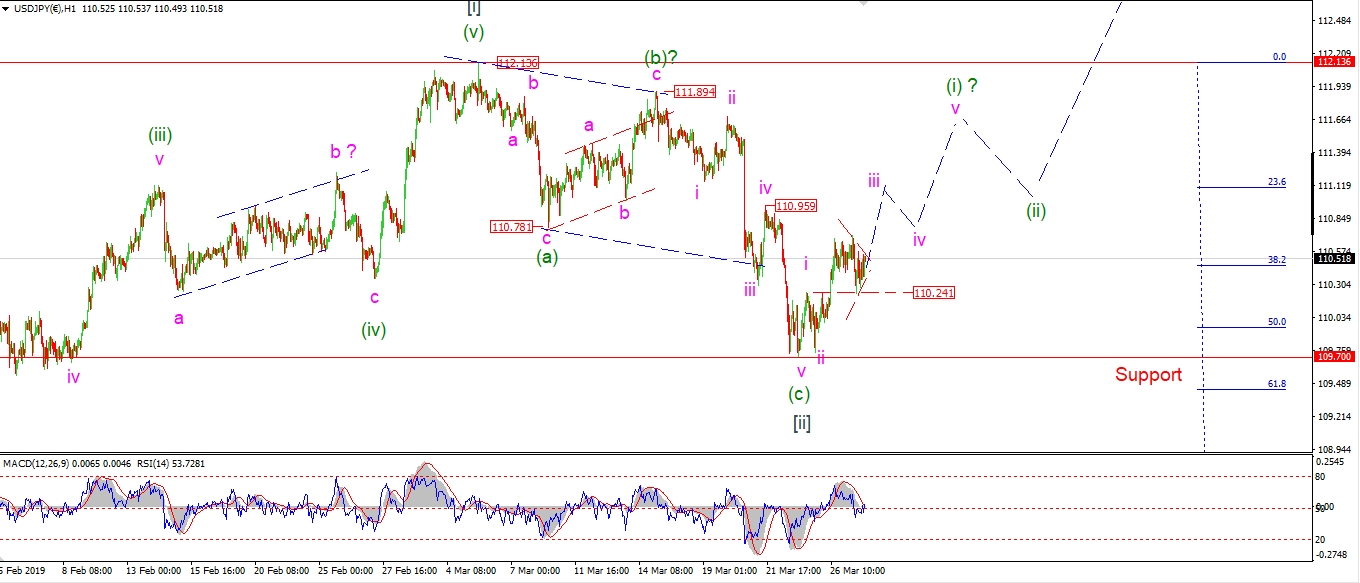 [/vc_column_text][/vc_column][vc_column width=”1/3″][vc_custom_heading text=”4 Hours” use_theme_fonts=”yes”][vc_column_text]
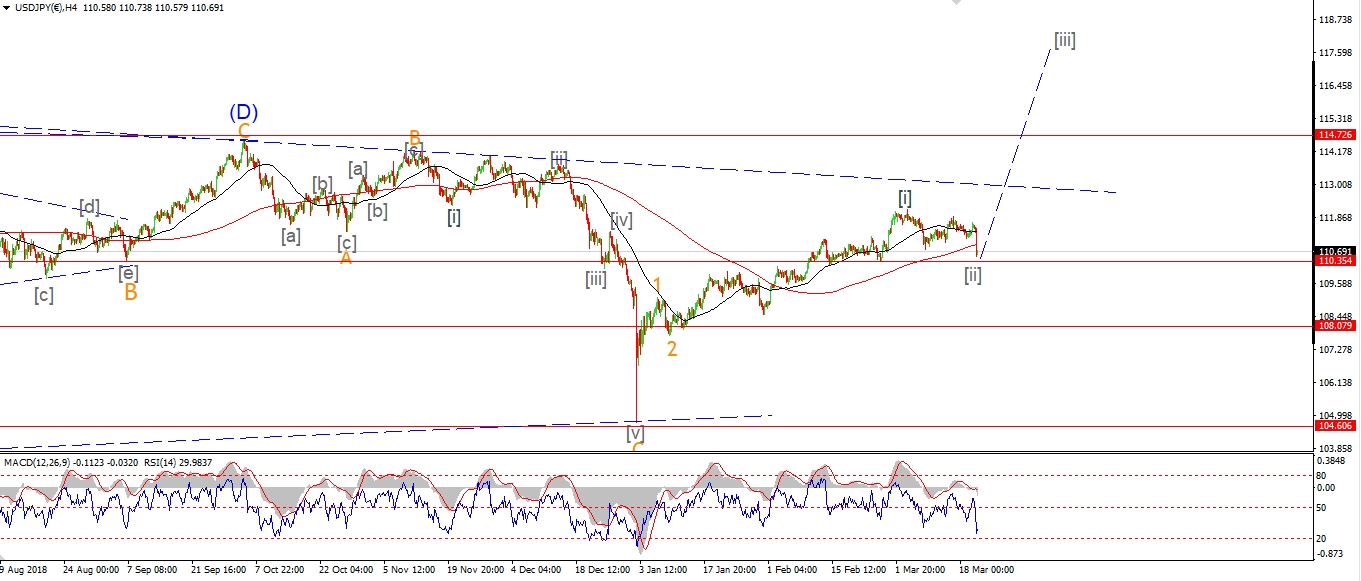 [/vc_column_text][vc_custom_heading text=”Daily” use_theme_fonts=”yes”][vc_column_text]
 [/vc_column_text][/vc_column][/vc_row]
[vc_row][vc_column][vc_column_text]
USDJPY was dead in the water today.
The price has contracted to almost a standstill right now.
This can be viewed as a contracting triangle,
either as a fourth wave within wave ‘iii’ pink.
or,
wave ‘iv’ pink at one higher degree.
I have noted the wave ‘i’ high at 110.24,
This level should hold as the five wave structure higher in wave (i) builds over the coning days.
Tomorrow;
Watch for 110.24 to hold,
Wave ‘iii’ must continue higher and above 111.00 to complete.
[/vc_column_text][/vc_column][/vc_row]
[/_s2If]
[_s2If current_user_can(access_s2member_ccap_dow_jones)]
[vc_row][vc_column][vc_separator border_width=”5″][/vc_column][/vc_row][vc_row][vc_column][vc_column_text]
DOW JONES INDUSTRIALS
[/vc_column_text][/vc_column][/vc_row][vc_row][vc_column][vc_separator border_width=”5″][/vc_column][/vc_row][vc_row][vc_column width=”2/3″][vc_custom_heading text=”1 hr” use_theme_fonts=”yes”][vc_column_text]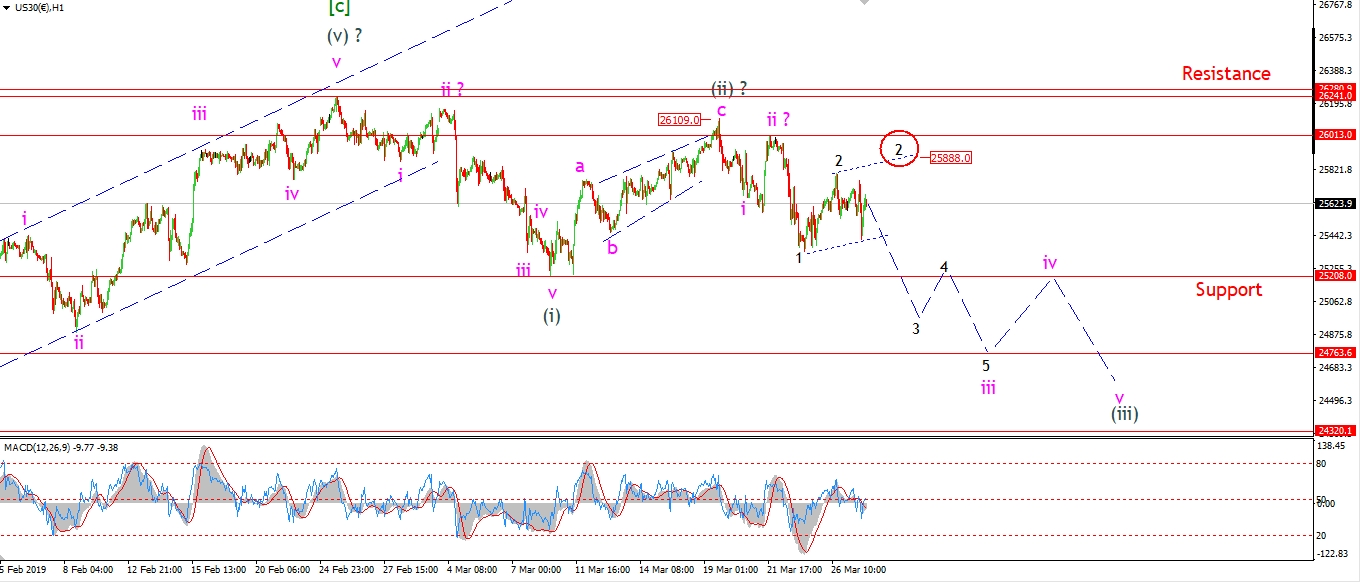 [/vc_column_text][/vc_column][vc_column width=”1/3″][vc_custom_heading text=”4 Hours” use_theme_fonts=”yes”][vc_column_text]
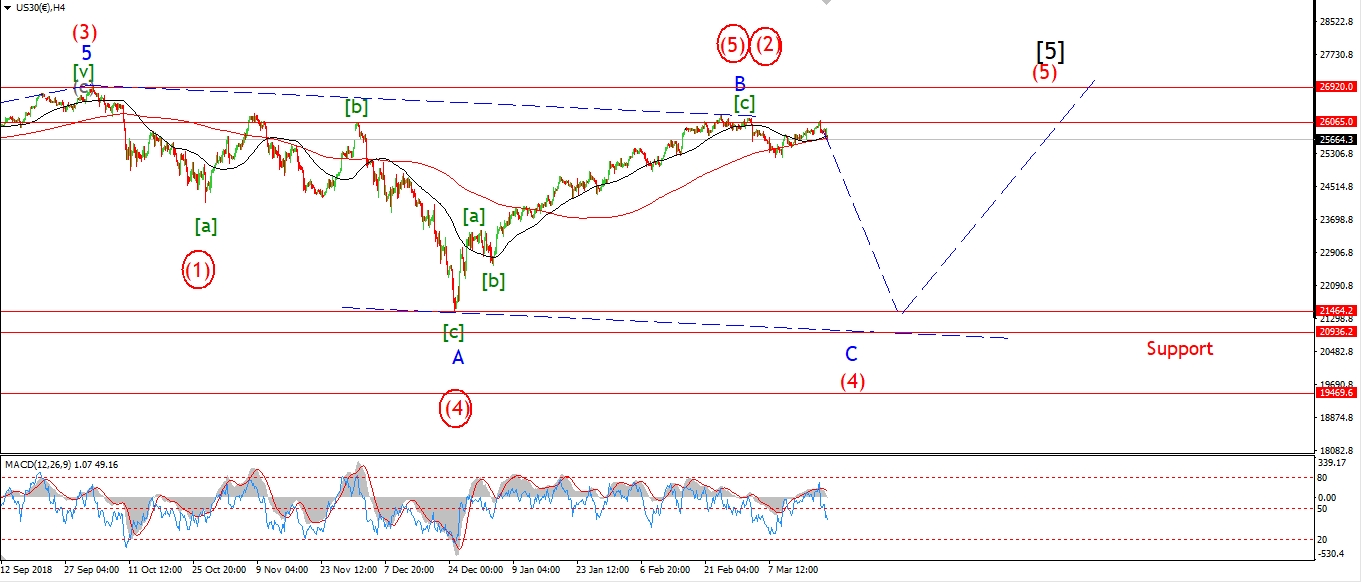 [/vc_column_text][vc_custom_heading text=”Daily” use_theme_fonts=”yes”][vc_column_text]
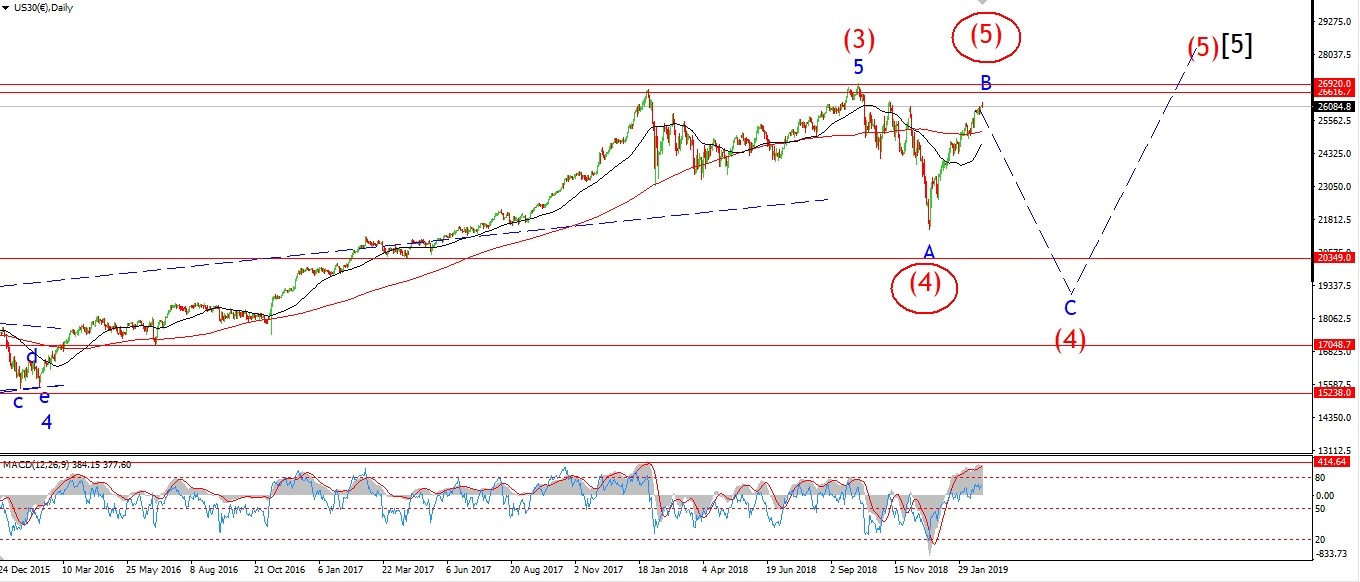 [/vc_column_text][/vc_column][/vc_row]
[vc_row][vc_column][vc_column_text]
The DOW has spent the day overlapping itself,
without anything in the way of progress to speak of.
The price is lower off the high labelled wave ‘2’ of ‘iii’.
But wave ‘iii’ can only be confirmed with a break of 25208 at this point.
So for now,
we are in limbo as the larger wave pattern tries to assert itself.
I have shown another possibility for wave ‘2’ as an alternate count.
If we see a push back to 25880 and then a drop in wave ‘iii’.
That will confirm wave ‘2’ as a larger flat correction.
Tomorrow;
26109 must continue to hold.
watch for wave ‘iii’ to take hold of the price and drop back below 25208.
[/vc_column_text][/vc_column][/vc_row]
[/_s2If]
[_s2If current_user_can(access_s2member_ccap_gold)]
[vc_row][vc_column][vc_separator border_width=”5″][/vc_column][/vc_row][vc_row][vc_column][vc_column_text]
GOLD
[/vc_column_text][/vc_column][/vc_row][vc_row][vc_column][vc_separator border_width=”5″][/vc_column][/vc_row][vc_row][vc_column width=”2/3″][vc_custom_heading text=”1 hr” use_theme_fonts=”yes”][vc_column_text]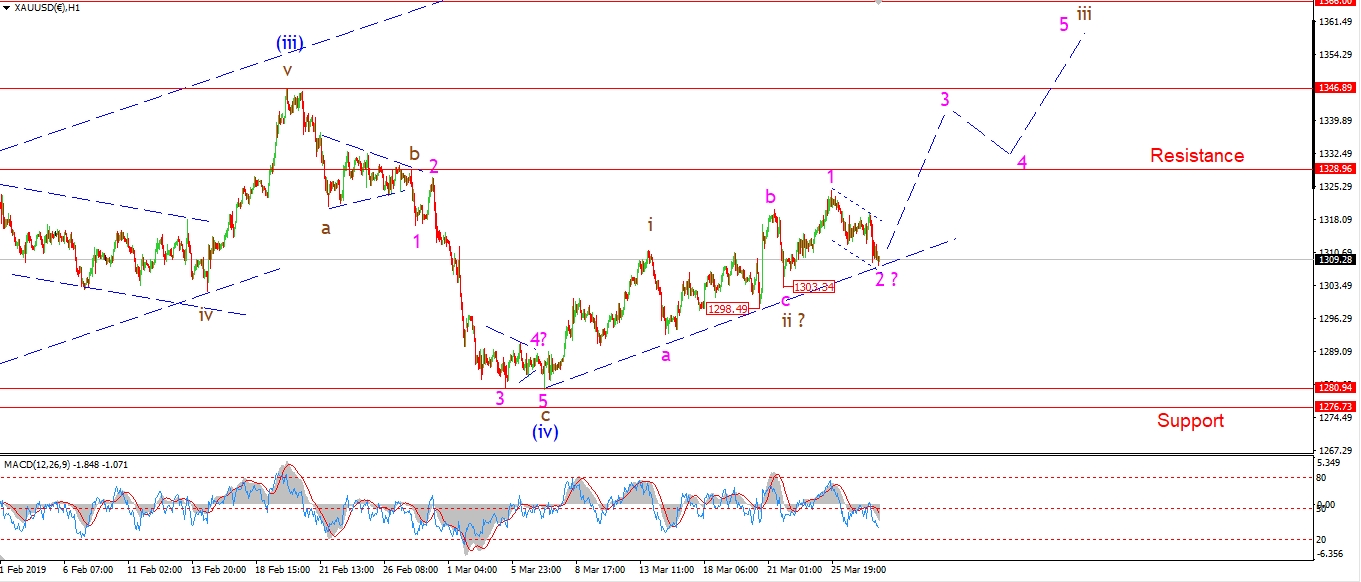 [/vc_column_text][/vc_column][vc_column width=”1/3″][vc_custom_heading text=”4 Hours” use_theme_fonts=”yes”][vc_column_text]
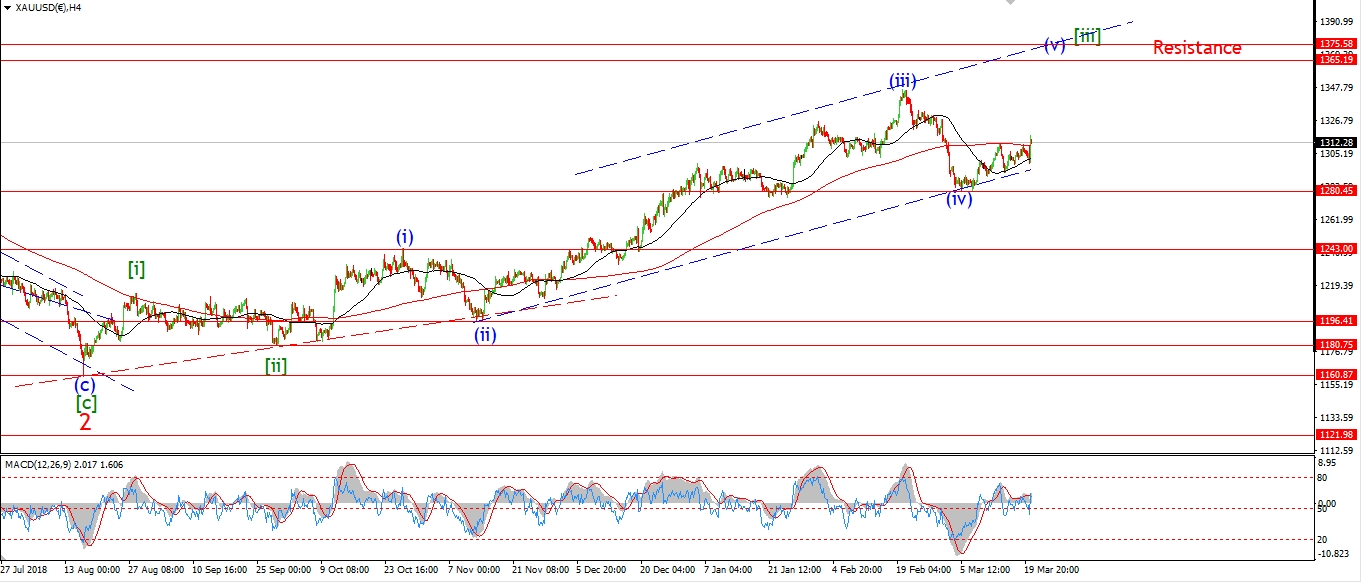 [/vc_column_text][vc_custom_heading text=”Daily” use_theme_fonts=”yes”][vc_column_text]
 [/vc_column_text][/vc_column][/vc_row]
[vc_row][vc_column][vc_column_text]
GOLD has again fallen in three waves back to meet the rising trendline.
I have labelled this decline as wave ‘2’ of ‘iii’ to the upside.
The price must not drop below 1303 for this view to remain valid.
The price is holding this evening at 1309.
So we are close,
but I think that level should hold.
Tomorrow;
Watch 1303.
This level is key for this particular short term count.
If it breaks, I will have to rethink the larger wave pattern in wave (iv).
On the flip-side.
If we see another run above 1330,
That should be enough to kick off wave ‘iii’ up correctly.
[/vc_column_text][/vc_column][/vc_row]
[/_s2If]
[_s2If current_user_can(access_s2member_ccap_crude)]
[vc_row][vc_column][vc_separator border_width=”5″][/vc_column][/vc_row][vc_row][vc_column][vc_column_text]
U.S CRUDE OIL
[/vc_column_text][/vc_column][/vc_row][vc_row][vc_column][vc_separator border_width=”5″][/vc_column][/vc_row][vc_row][vc_column width=”2/3″][vc_custom_heading text=”1 hr” use_theme_fonts=”yes”][vc_column_text]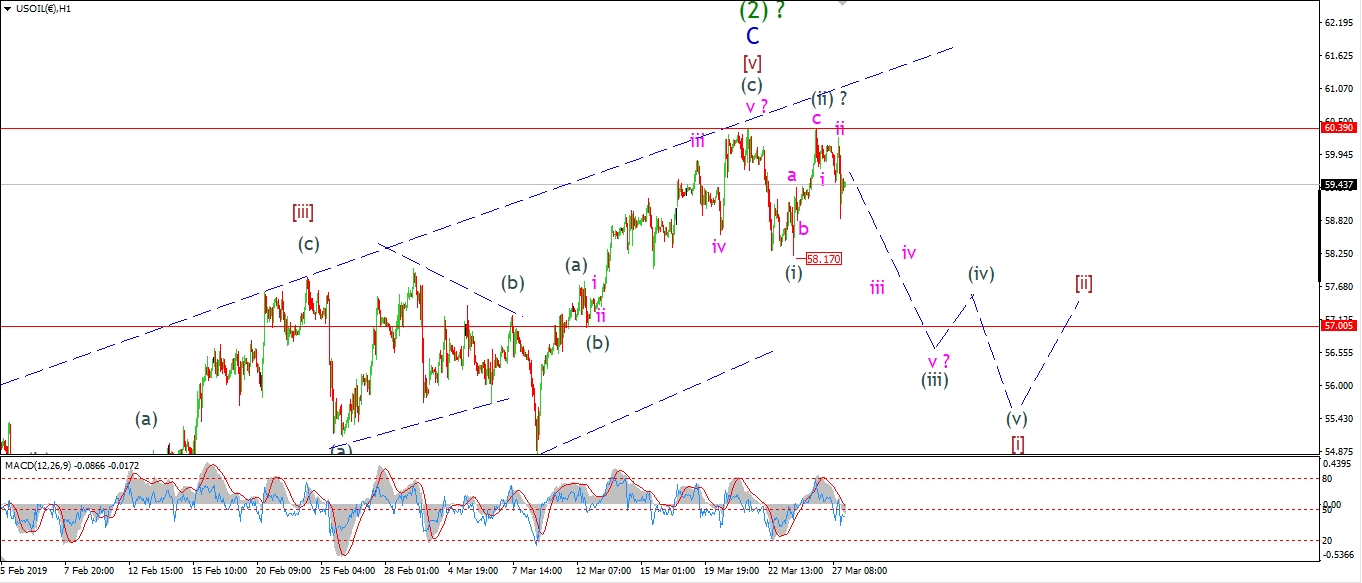 [/vc_column_text][/vc_column][vc_column width=”1/3″][vc_custom_heading text=”4 Hours” use_theme_fonts=”yes”][vc_column_text]
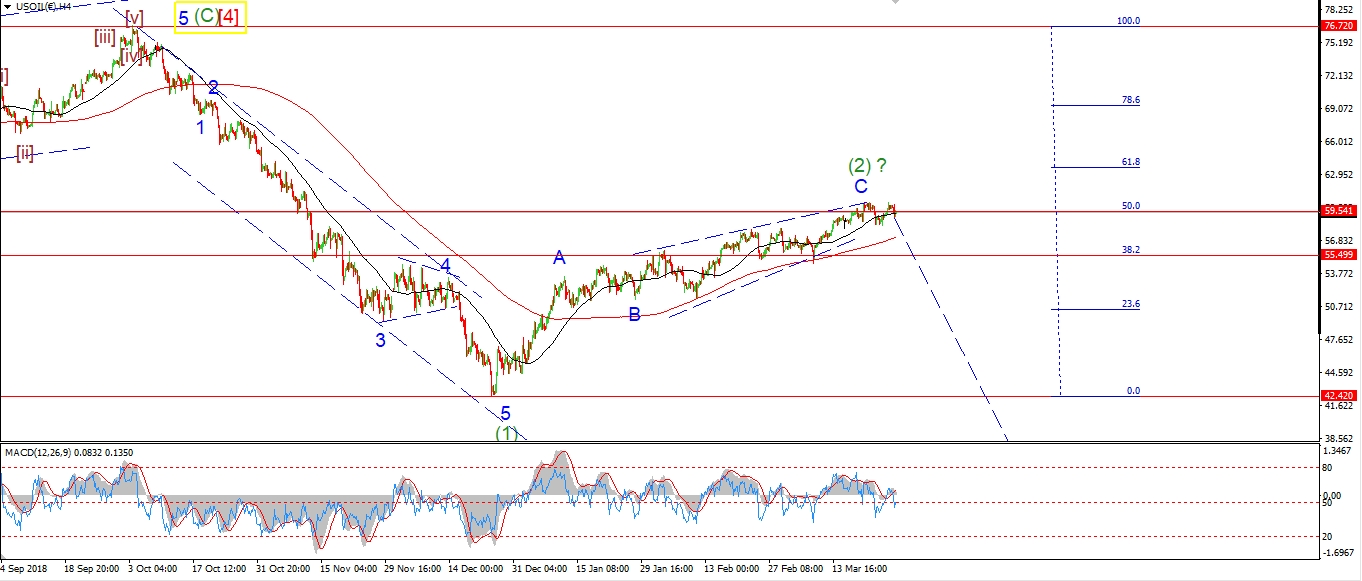 [/vc_column_text][vc_custom_heading text=”Daily” use_theme_fonts=”yes”][vc_column_text]
 [/vc_column_text][/vc_column][/vc_row]
[vc_row][vc_column][vc_column_text]
Crude fell away from that double top today.
which will save the bearish short term count for now.
The drop off wave (ii) is viewed as a start to wave (iii) down.
But we will have to see a more substantial decline tomorrow
back below the $58 handle at least.
This will confirm wave ‘iii’ of (iii) down
and turn the price action in favor of the bearish interpretation.
As is evident in the stock market,
Momentum on the 4hr chart is showing a large bearish divergence off the highs.
This market will roll over into wave (3) before long.
And when it does,
The gains over the last three months will be wiped out in very short order.
Tomorrow;
In the short term I am still on the hunt for five waves down.
The market has stagnated for the last week in a possible wave (i) and (ii).
Watch for wave (iii) down to carry lower again tomorrow.
60.39 must hold.
[/vc_column_text][/vc_column][/vc_row]
[/_s2If]
[_s2If current_user_can(access_s2member_ccap_us10yr)]
[vc_row][vc_column][vc_separator border_width=”5″][/vc_column][/vc_row][vc_row][vc_column][vc_column_text]
US 10 yr Treasuries.
[/vc_column_text][/vc_column][/vc_row][vc_row][vc_column][vc_separator border_width=”5″][/vc_column][/vc_row][vc_row][vc_column width=”2/3″][vc_custom_heading text=”1 hr” use_theme_fonts=”yes”][vc_column_text]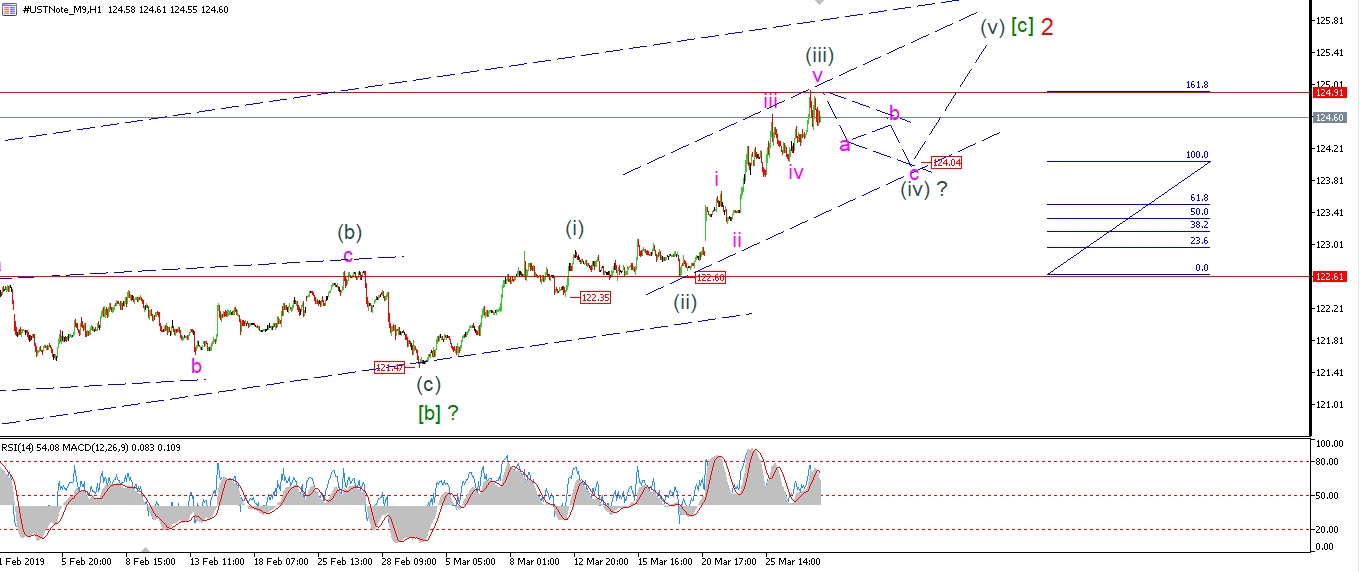 [/vc_column_text][/vc_column][vc_column width=”1/3″][vc_custom_heading text=”4 Hours” use_theme_fonts=”yes”][vc_column_text]
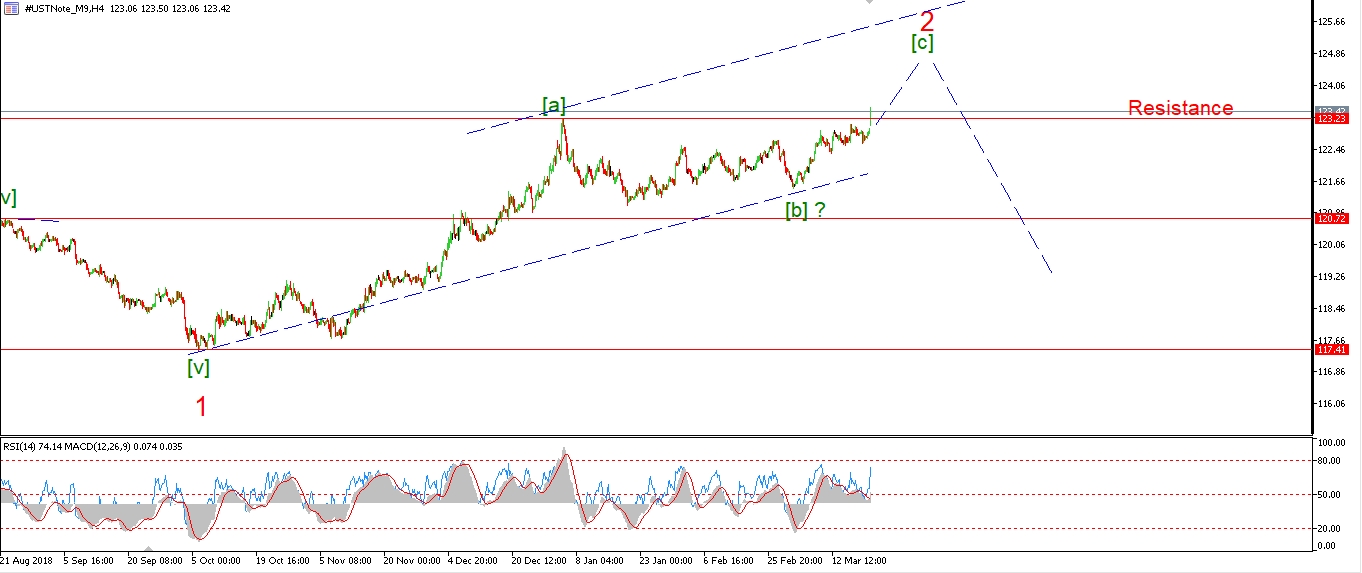 [/vc_column_text][vc_custom_heading text=”Daily” use_theme_fonts=”yes”][vc_column_text]
 [/vc_column_text][/vc_column][/vc_row]
[vc_row][vc_column][vc_column_text]
Price rebounded again today and hit the Fibonacci extension of wave (i) at the high.
I have relabeled this high as wave (iii).
as the Fibonacci relationship suggests as much.
Wave (iv) is now expected to decline in three waves off nearby highs,
and should fall back to about 124.00 again.
One final leg up in wave (v) will complete wave [c] and wave ‘2’,
before the next leg down begins in wave ‘3’ down.
Tomorrow;
Watch for wave (iv) to begin with a drop off the high in three waves.
[/vc_column_text][/vc_column][/vc_row]
[/_s2If]
[_s2If current_user_can(access_s2member_ccap_silver)]
[vc_row][vc_column][vc_separator border_width=”5″][/vc_column][/vc_row][vc_row][vc_column][vc_column_text]
SILVER
[/vc_column_text][/vc_column][/vc_row][vc_row][vc_column][vc_separator border_width=”5″][/vc_column][/vc_row][vc_row][vc_column width=”2/3″][vc_custom_heading text=”1 hr” use_theme_fonts=”yes”][vc_column_text]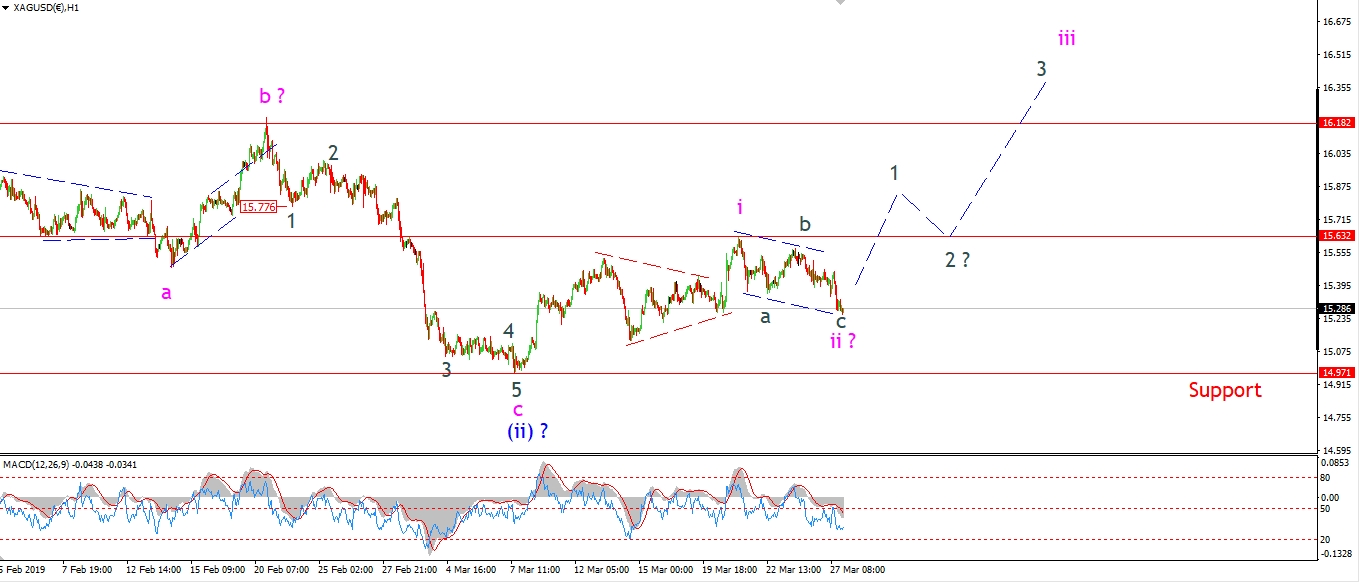 [/vc_column_text][/vc_column][vc_column width=”1/3″][vc_custom_heading text=”4 Hours” use_theme_fonts=”yes”][vc_column_text]
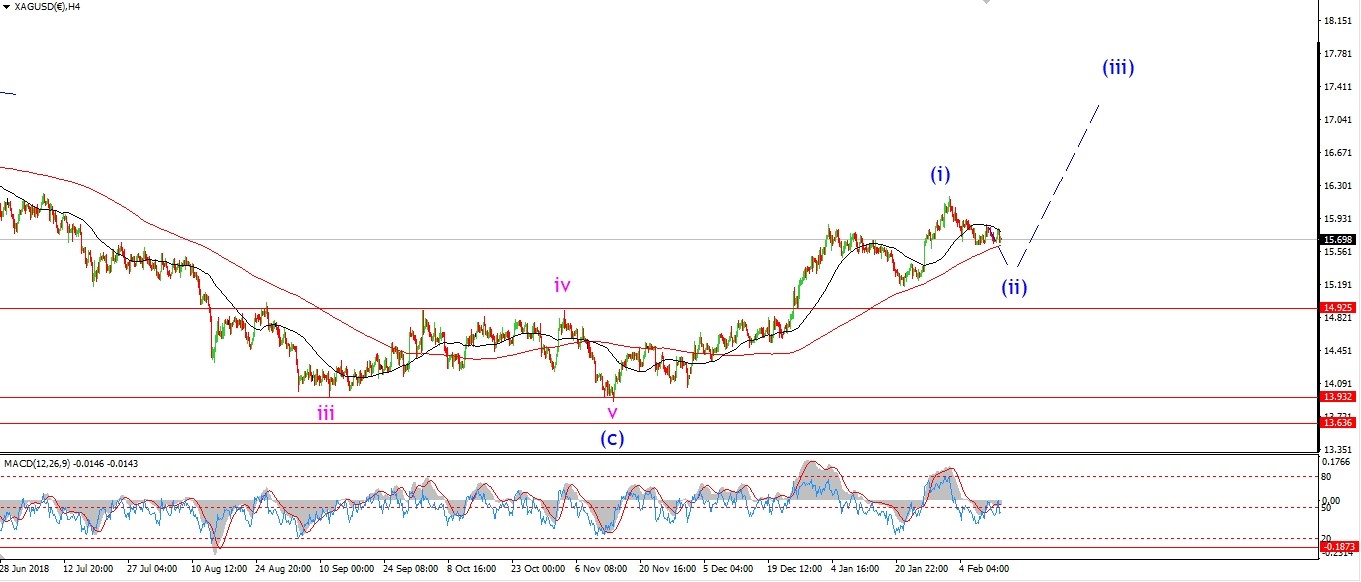 [/vc_column_text][vc_custom_heading text=”Daily” use_theme_fonts=”yes”][vc_column_text]
 [/vc_column_text][/vc_column][/vc_row]
[vc_row][vc_column][vc_column_text]
Silver has also traced out a three wave drop off the recent high at 15.63.
I have shown a different interpretation tonight,
where wave ‘ii’ is now completing at the lower trend channel line.
But it is now essential that wave ‘iii’ up begin tomorrow.
Tomorrow;
A break of 15.63 again will signal wave ‘iii’ up has begun.
The recent low at 14.97 must not break.
[/vc_column_text][/vc_column][/vc_row]
[/_s2If]
[_s2If current_user_can(access_s2member_ccap_sp500)]
[vc_row][vc_column][vc_separator border_width=”5″][/vc_column][/vc_row][vc_row][vc_column][vc_column_text]
S&P 500.
[/vc_column_text][/vc_column][/vc_row][vc_row][vc_column][vc_separator border_width=”5″][/vc_column][/vc_row][vc_row][vc_column width=”2/3″][vc_custom_heading text=”1 hr” use_theme_fonts=”yes”][vc_column_text]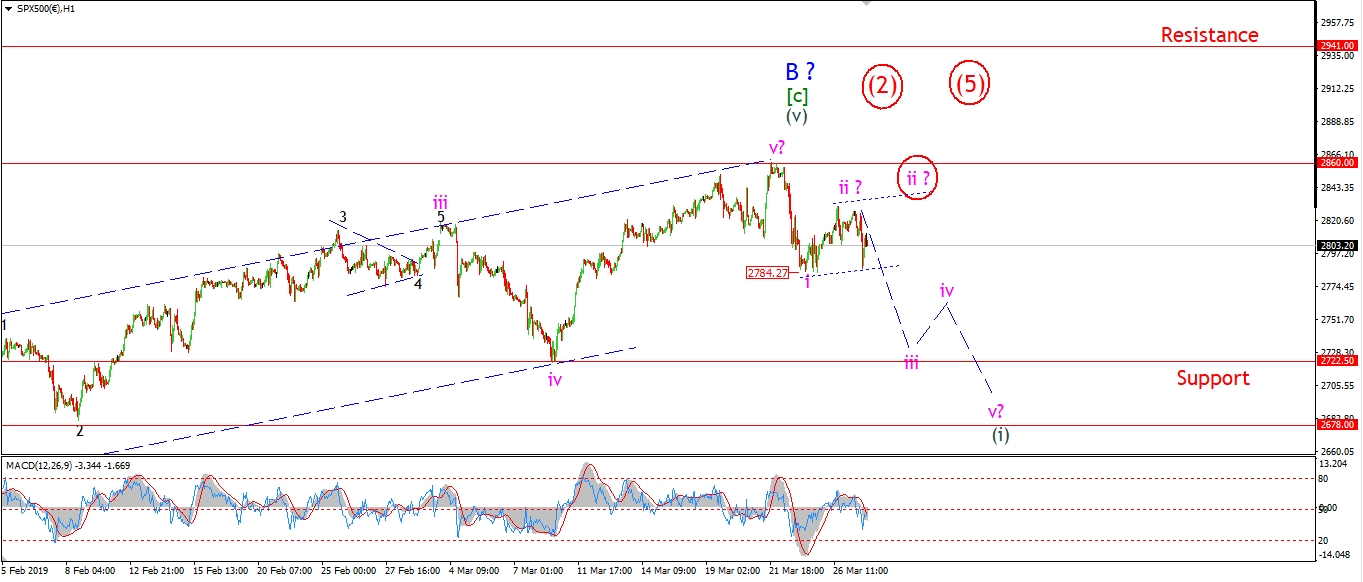 [/vc_column_text][/vc_column][vc_column width=”1/3″][vc_custom_heading text=”4 Hours” use_theme_fonts=”yes”][vc_column_text]
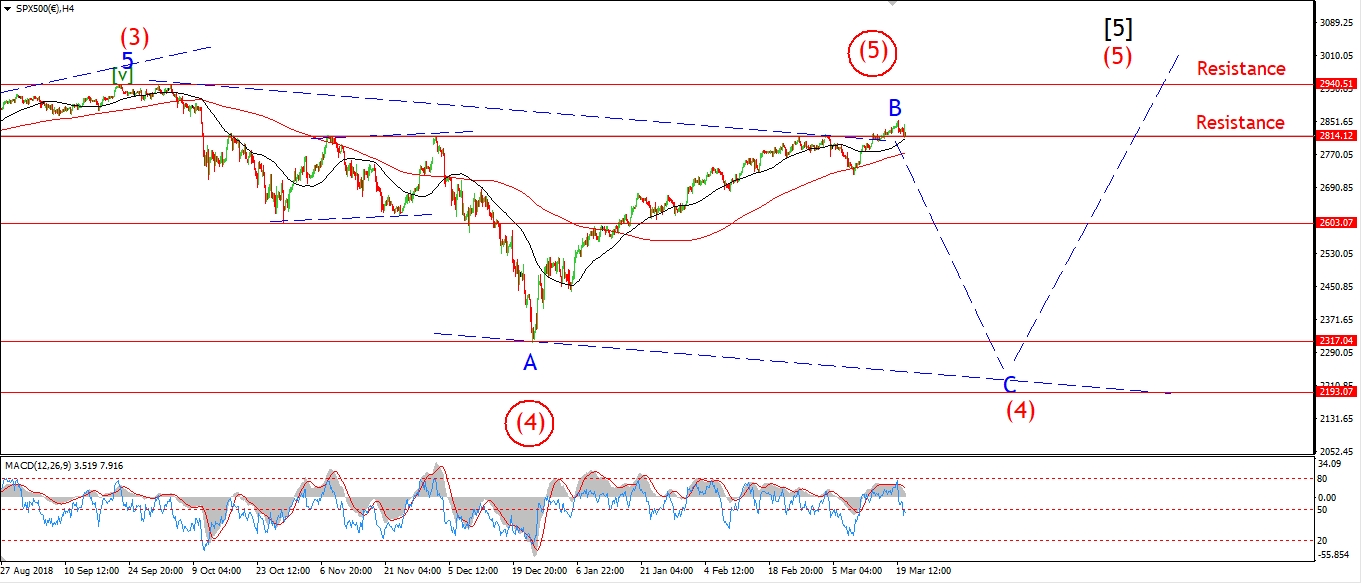 [/vc_column_text][vc_custom_heading text=”Daily” use_theme_fonts=”yes”][vc_column_text]
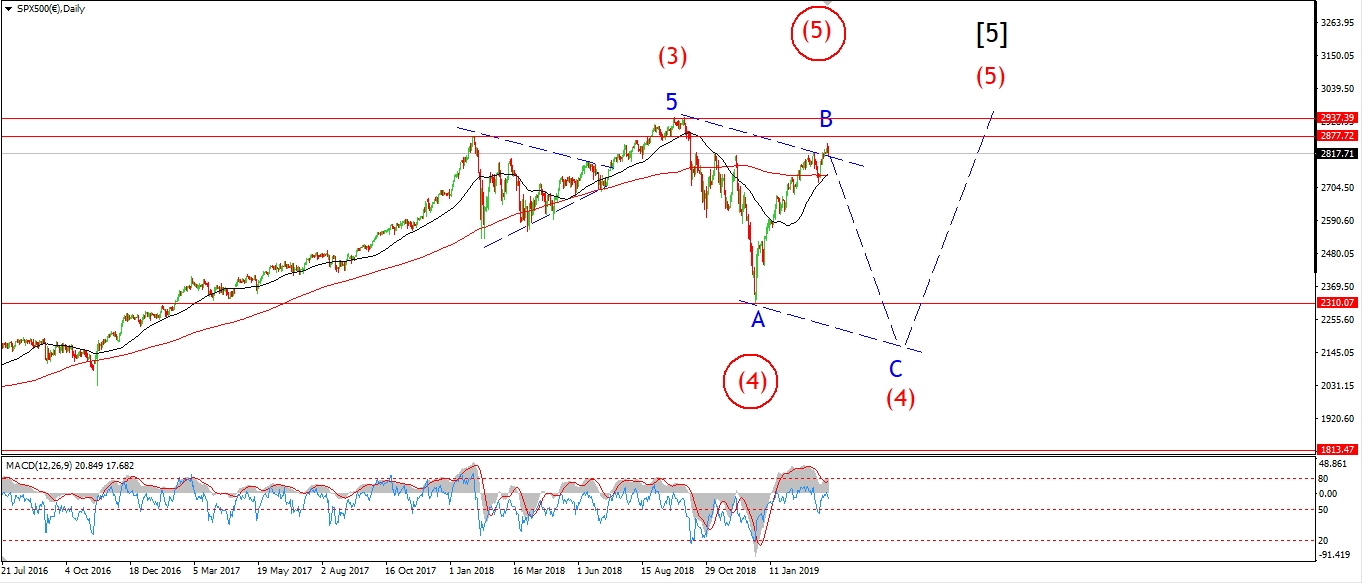 [/vc_column_text][/vc_column][/vc_row]
[vc_row][vc_column][vc_column_text]
The S&P is lower today but the decline so far is in three waves.
A further decline below 2784 tomorrow will confirm that wave ‘iii’ of (i) has begun.
If a larger wave ‘ii’ is developing,
then we will see a further lower high as shown circled in red.
Even this formation should fail though as wave ‘iii’ comes in.
Tomorrow;
2860 must continue to hold.
watch for a turn lower into wave ‘iii’ down which will be confirmed with a break of 2784.
[/vc_column_text][/vc_column][/vc_row]
[/_s2If]
[vc_row][vc_column][vc_column_text]
[/vc_column_text][/vc_column][/vc_row]
[vc_row][vc_column][vc_separator border_width=”5″][/vc_column][/vc_row]