
[vc_row][vc_column][vc_separator border_width=”5″][/vc_column][/vc_row]
[vc_row][vc_column][vc_column_text]
Good evening to one and all.
I finally got around to posting the video to the members area this afternoon.
The weekend video is now only visible to members as I mentioned on Friday.
I may do more member only videos from now on as opportunities arise,
or if a major shift takes place in a market structure.
A video might be the best way to explain big changes to a wave count I imagine.
I hope you are all happy with the new arrangement.
Ok,
down to business.
[/vc_column_text][/vc_column][/vc_row]
[_s2If current_user_can(access_s2member_ccap_eurusd)]
[vc_row][vc_column][vc_separator border_width=”5″][/vc_column][/vc_row]
[vc_row][vc_column][vc_column_text]
EURUSD
[/vc_column_text][/vc_column][/vc_row]
[vc_row][vc_column][vc_separator border_width=”5″][/vc_column][/vc_row][vc_row][vc_column width=”2/3″][vc_custom_heading text=”1 hr” use_theme_fonts=”yes”][vc_column_text]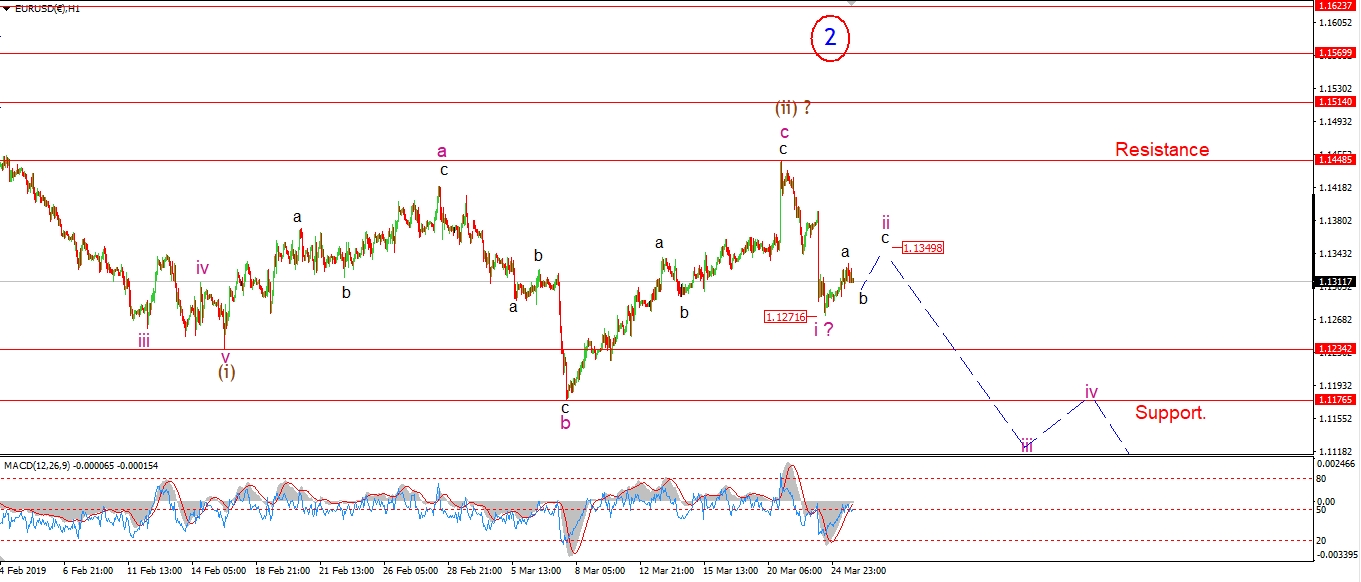 [/vc_column_text][/vc_column][vc_column width=”1/3″][vc_custom_heading text=”4 Hours” use_theme_fonts=”yes”][vc_column_text]
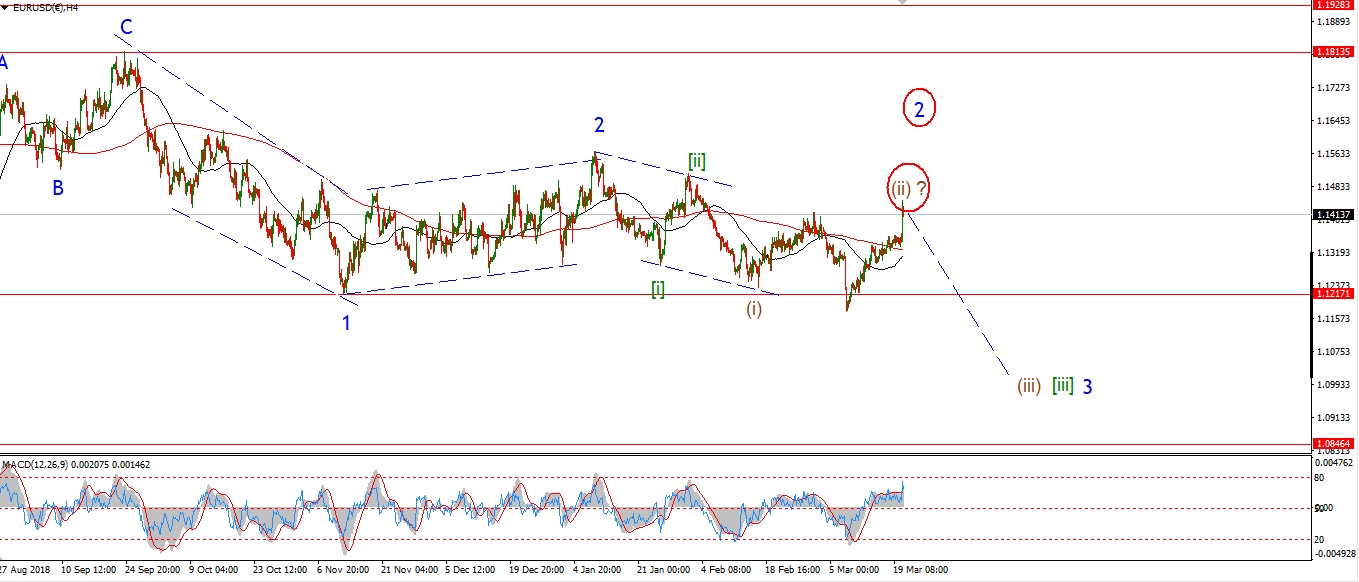 [/vc_column_text][vc_custom_heading text=”Daily” use_theme_fonts=”yes”][vc_column_text]
 [/vc_column_text][/vc_column][/vc_row]
[vc_row][vc_column][vc_column_text]
The action in EURUSD is corrective to the upside today.
It is hard to know if this is still a minor correction within wave ‘i’ down,
or the beginning of wave ‘ii’ already.
If the price corrects up to about 1.1350 that will favor the idea that wave ‘ii’ is now unfolding.
As for wave ‘iii’ of (iii) down,
That will be confirmed with a break of 1.1176.
But a break of 1.1234 will be a strong indication that wave ‘iii’ of (iii) has begun.
Tomorrow;
Watch for wave ‘ii’ to complete at about 1.1350 and then turn lower again into wave ‘iii’.
[/vc_column_text][/vc_column][/vc_row]
[/_s2If]
[_s2If current_user_can(access_s2member_ccap_gbpusd)]
[vc_row][vc_column][vc_separator border_width=”5″][/vc_column][/vc_row][vc_row][vc_column][vc_column_text]
GBPUSD
[/vc_column_text][/vc_column][/vc_row][vc_row][vc_column][vc_separator border_width=”5″][/vc_column][/vc_row][vc_row][vc_column width=”2/3″][vc_custom_heading text=”1 hr” use_theme_fonts=”yes”][vc_column_text]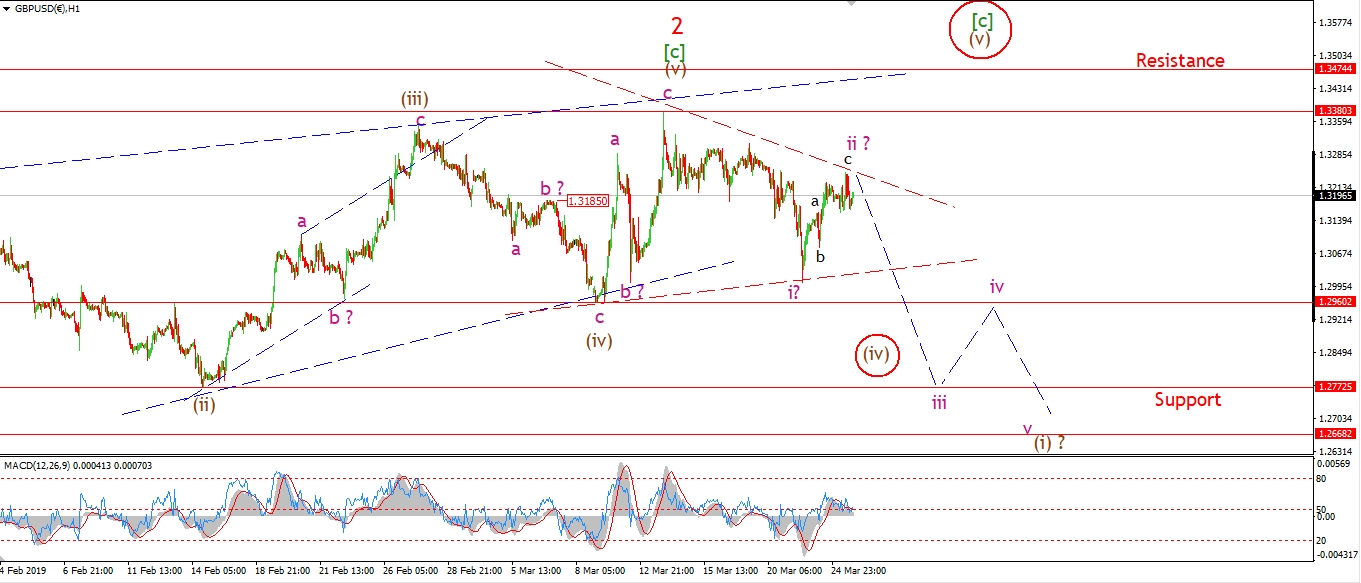 [/vc_column_text][/vc_column][vc_column width=”1/3″][vc_custom_heading text=”4 Hours” use_theme_fonts=”yes”][vc_column_text]
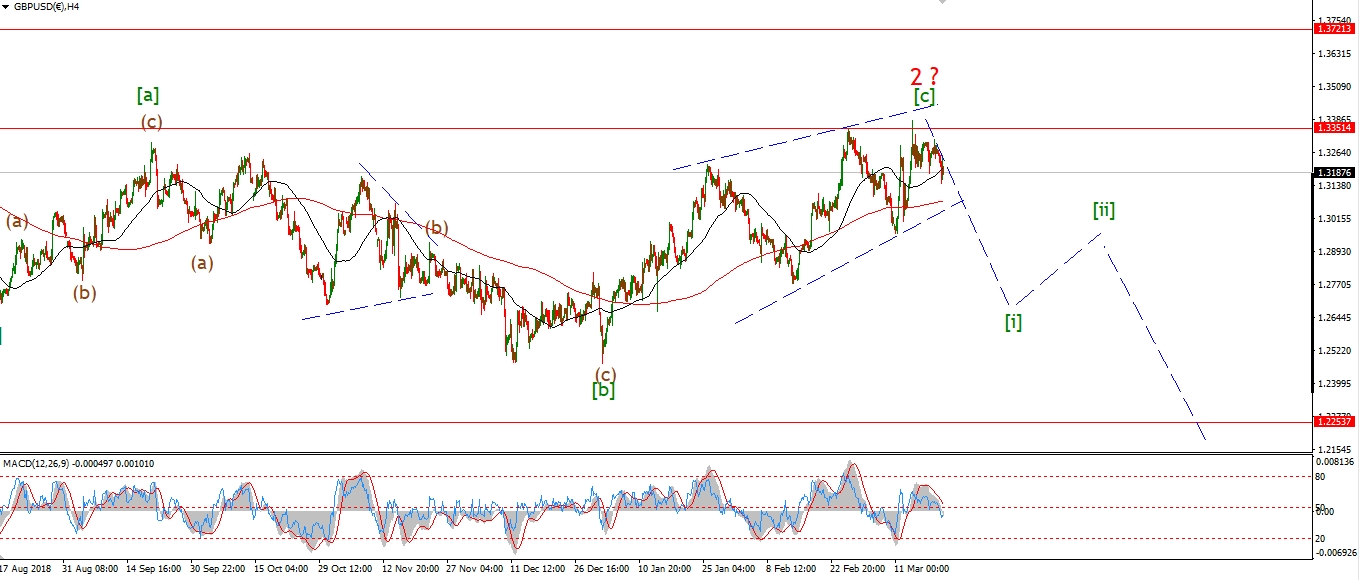 [/vc_column_text][vc_custom_heading text=”Daily” use_theme_fonts=”yes”][vc_column_text]
 [/vc_column_text][/vc_column][/vc_row]
[vc_row][vc_column][vc_column_text]
I went over the idea of an alternate contracting triangle wave (iv) in the video today.
That idea is shown as the alternate count this evening.
Todays action is still viewed as a possible three wave rally in a second wave.
The problem is the drop off the wave ‘2’ high is quite corrective looking so far.
If we see another impulsive drop tomorrow,
and a break of 1.2960,
that will favor the idea of a top in place for wave ‘2’ and wave ‘3’ down beginning.
For the moment I will be patient to see what develops.
Tomorrow;
Watch for a new impulsive drop in wave ‘iii’ down to begin off todays highs.
A break of 1.2960 will confirm wave ‘iii’.
While a break of the lower support level at 1.2772 should be enough to confirm the market has turned.
[/vc_column_text][/vc_column][/vc_row]
[/_s2If]
[_s2If current_user_can(access_s2member_ccap_usdjpy)]
[vc_row][vc_column][vc_separator border_width=”5″][/vc_column][/vc_row][vc_row][vc_column][vc_column_text]
USDJPY
[/vc_column_text][/vc_column][/vc_row][vc_row][vc_column][vc_separator border_width=”5″][/vc_column][/vc_row][vc_row][vc_column width=”2/3″][vc_custom_heading text=”1 hr” use_theme_fonts=”yes”][vc_column_text] [/vc_column_text][/vc_column][vc_column width=”1/3″][vc_custom_heading text=”4 Hours” use_theme_fonts=”yes”][vc_column_text]
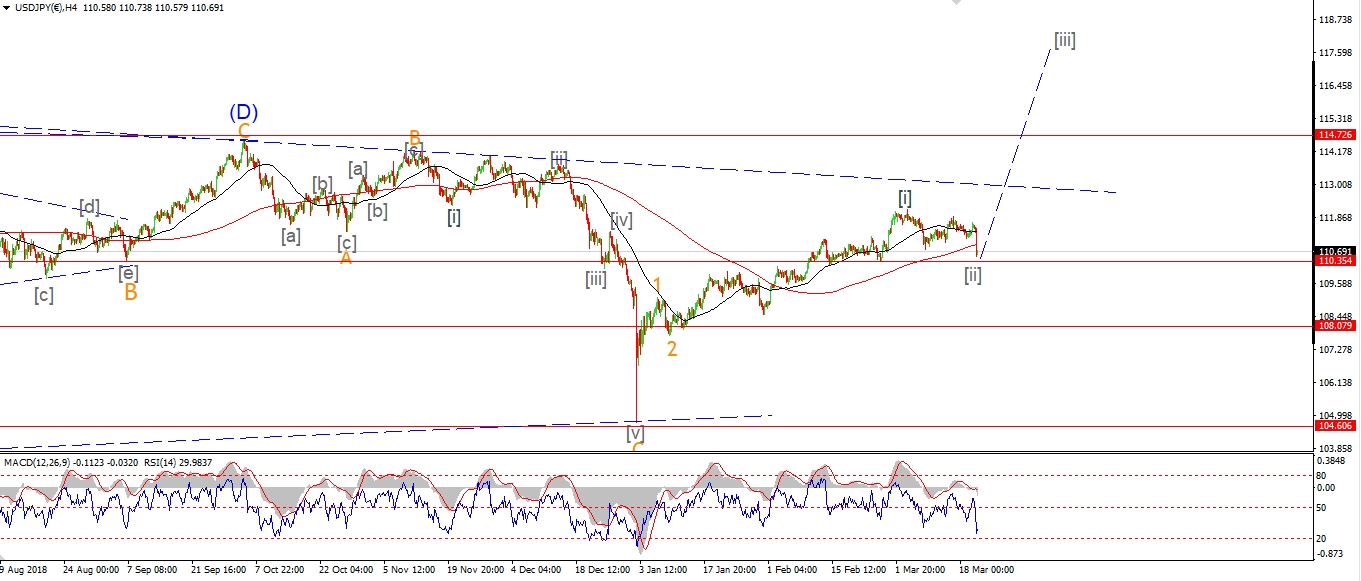 [/vc_column_text][vc_custom_heading text=”Daily” use_theme_fonts=”yes”][vc_column_text]
 [/vc_column_text][/vc_column][/vc_row]
[vc_row][vc_column][vc_column_text]
USDJPY is holding above the lows of the session today after a possible three wave decline.
IF this is wave ‘i and ‘ii’ complete,
then wave ‘iii’ up should begin and carry the price back above 111.00 again.
The expectation is for a rally in wave (i) of [iii] now,
and that wave [iii] should carry us mush higher over the coming weeks.
Tomorrow;
First we must establish that a bottom is in place for wave [ii] with a five wave rally higher.
Watch for the low at 109.70 to hold and wave ‘iii’ of (i) to continue higher.
A break above the wave ‘iv’ level at 110.95 will confirm the turn higher in wave (i) of [iii] has begun.
[/vc_column_text][/vc_column][/vc_row]
[/_s2If]
[_s2If current_user_can(access_s2member_ccap_dow_jones)]
[vc_row][vc_column][vc_separator border_width=”5″][/vc_column][/vc_row][vc_row][vc_column][vc_column_text]
DOW JONES INDUSTRIALS
[/vc_column_text][/vc_column][/vc_row][vc_row][vc_column][vc_separator border_width=”5″][/vc_column][/vc_row][vc_row][vc_column width=”2/3″][vc_custom_heading text=”1 hr” use_theme_fonts=”yes”][vc_column_text]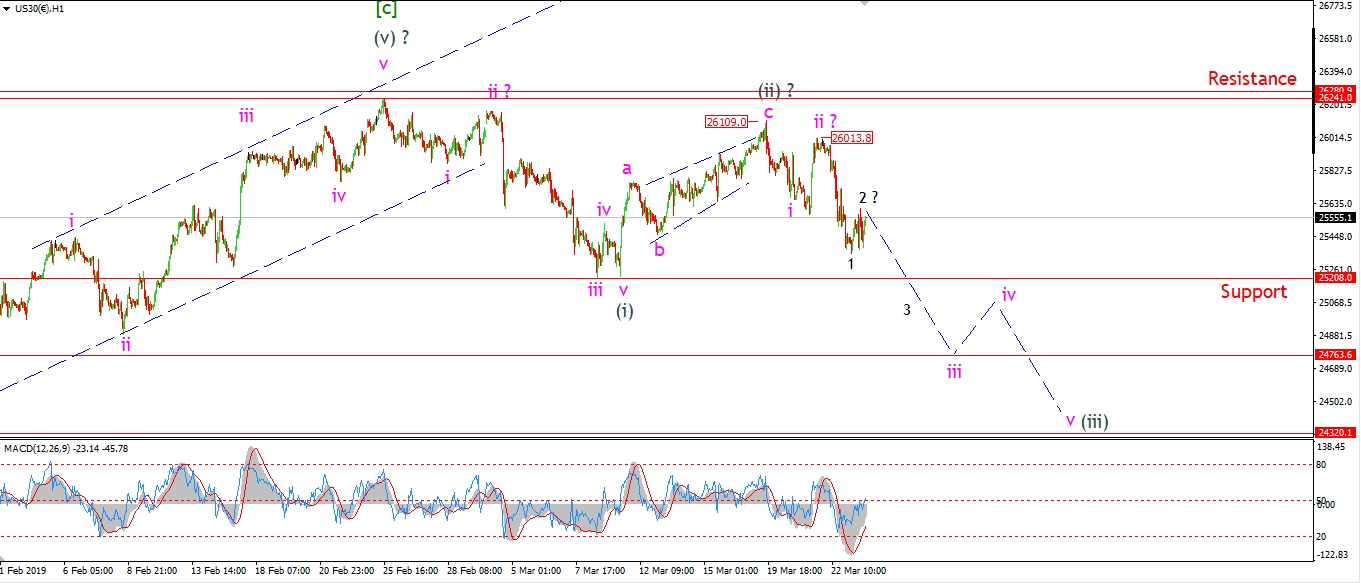 [/vc_column_text][/vc_column][vc_column width=”1/3″][vc_custom_heading text=”4 Hours” use_theme_fonts=”yes”][vc_column_text]
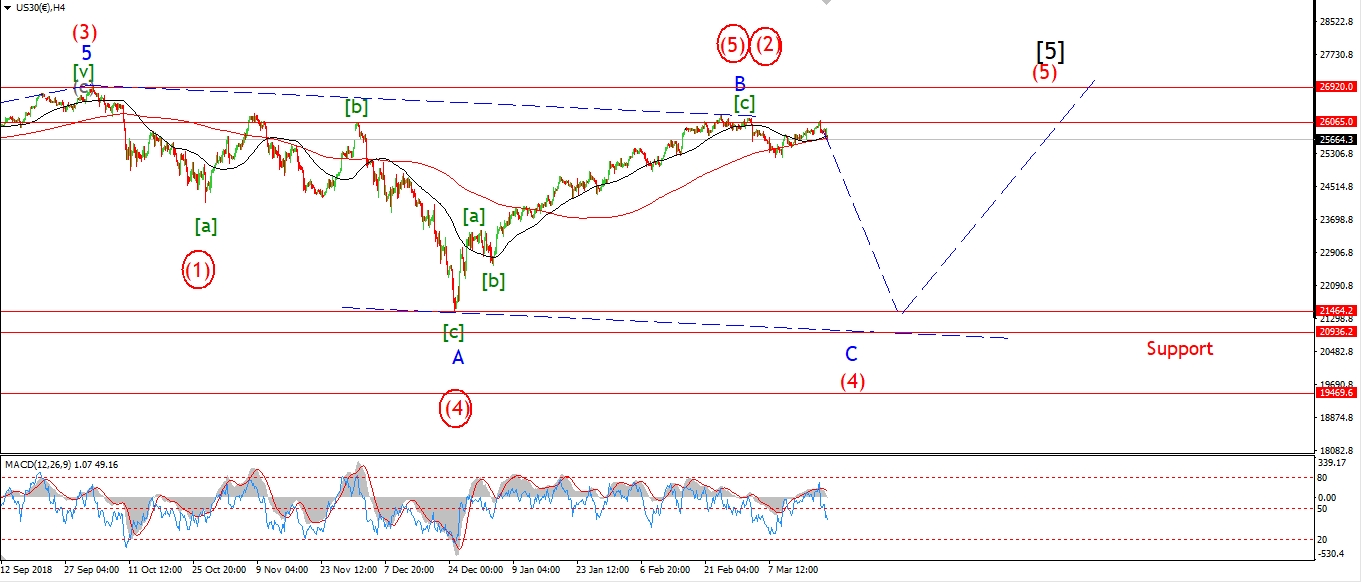 [/vc_column_text][vc_custom_heading text=”Daily” use_theme_fonts=”yes”][vc_column_text]
 [/vc_column_text][/vc_column][/vc_row]
[vc_row][vc_column][vc_column_text]
The Market is pretty flat today after Fridays impulsive decline.
This can be viewed as a wave ‘2’ correction higher within wave ‘iii’ down.
If this is the case,
then wave ‘2’ must complete soon with a further drop into wave ‘3’ of ‘iii’.
Wave ‘iii’ itself will break that wave (i) support at 25200
and continue lower for the rest of the week.
In terms of the momentum setup,
After a long bearish divergence since mid February, the breakdown is looking ominous again.
The 4hr chart shows a secondary break of the centreline by the RSI after the early march break.
And MACD has broken lower again also.
Both are bearish signals for the medium term.
Tomorrow;
Watch for wave ‘iii’ down to break 25208 and continue lower.
This week should bring us much closer to that illusive five waves down in wave (i).
[/vc_column_text][/vc_column][/vc_row]
[/_s2If]
[_s2If current_user_can(access_s2member_ccap_gold)]
[vc_row][vc_column][vc_separator border_width=”5″][/vc_column][/vc_row][vc_row][vc_column][vc_column_text]
GOLD
[/vc_column_text][/vc_column][/vc_row][vc_row][vc_column][vc_separator border_width=”5″][/vc_column][/vc_row][vc_row][vc_column width=”2/3″][vc_custom_heading text=”1 hr” use_theme_fonts=”yes”][vc_column_text]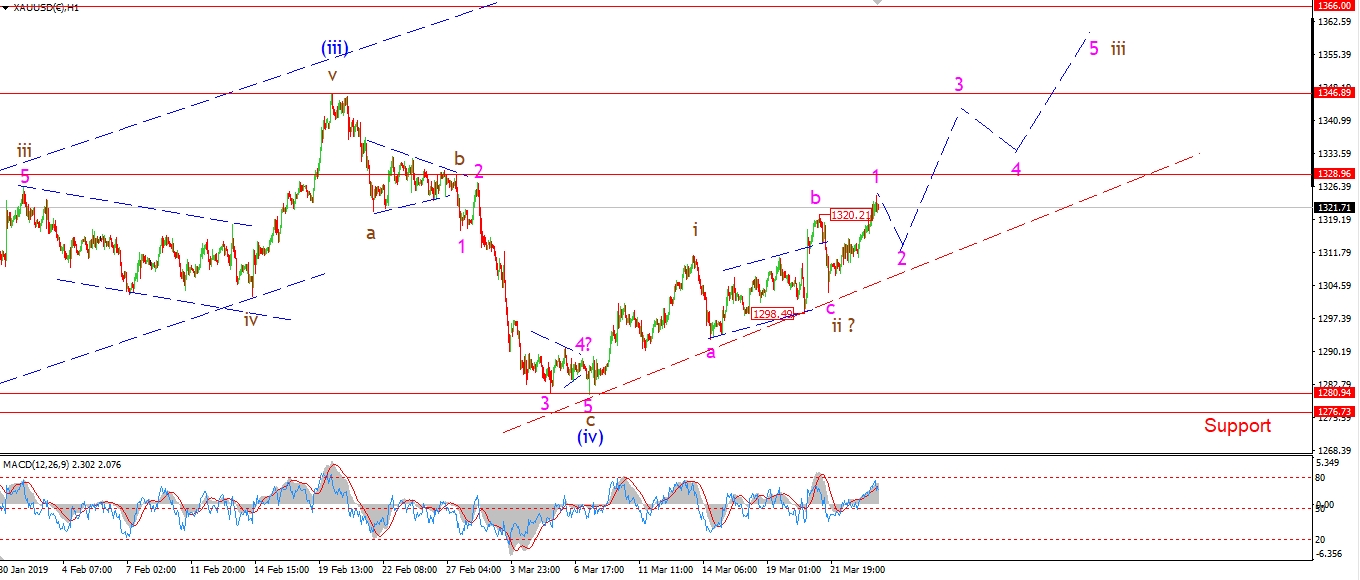 [/vc_column_text][/vc_column][vc_column width=”1/3″][vc_custom_heading text=”4 Hours” use_theme_fonts=”yes”][vc_column_text]
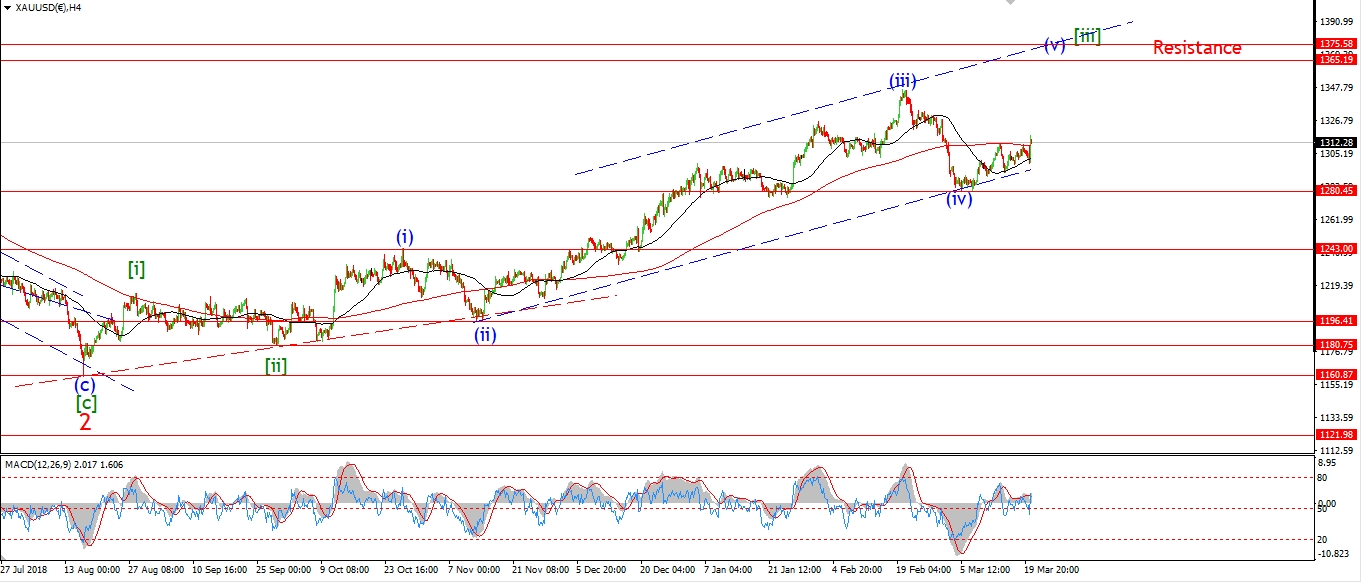 [/vc_column_text][vc_custom_heading text=”Daily” use_theme_fonts=”yes”][vc_column_text]
 [/vc_column_text][/vc_column][/vc_row]
[vc_row][vc_column][vc_column_text]
GOLD is pushing higher again creating a series of higher lows off wave (iv).
The internal structure is not perfect,
but nothing ever is!
I have shown a possible running flat wave ‘ii’,
which accounts for the rise in three waves last week.
Todays push higher again is viewed as wave ‘1’ of ‘iii’ of (v).
A break of 1330 again will signal that wave ‘iii’ is underway.
While a a push above 1346 will confirm the larger wave (v).
Tomorrow;
watch for a further higher low in wave ‘2’ and a break of 1328 again in wave ‘3’ of ‘iii’.
[/vc_column_text][/vc_column][/vc_row]
[/_s2If]
[_s2If current_user_can(access_s2member_ccap_crude)]
[vc_row][vc_column][vc_separator border_width=”5″][/vc_column][/vc_row][vc_row][vc_column][vc_column_text]
U.S CRUDE OIL
[/vc_column_text][/vc_column][/vc_row][vc_row][vc_column][vc_separator border_width=”5″][/vc_column][/vc_row][vc_row][vc_column width=”2/3″][vc_custom_heading text=”1 hr” use_theme_fonts=”yes”][vc_column_text]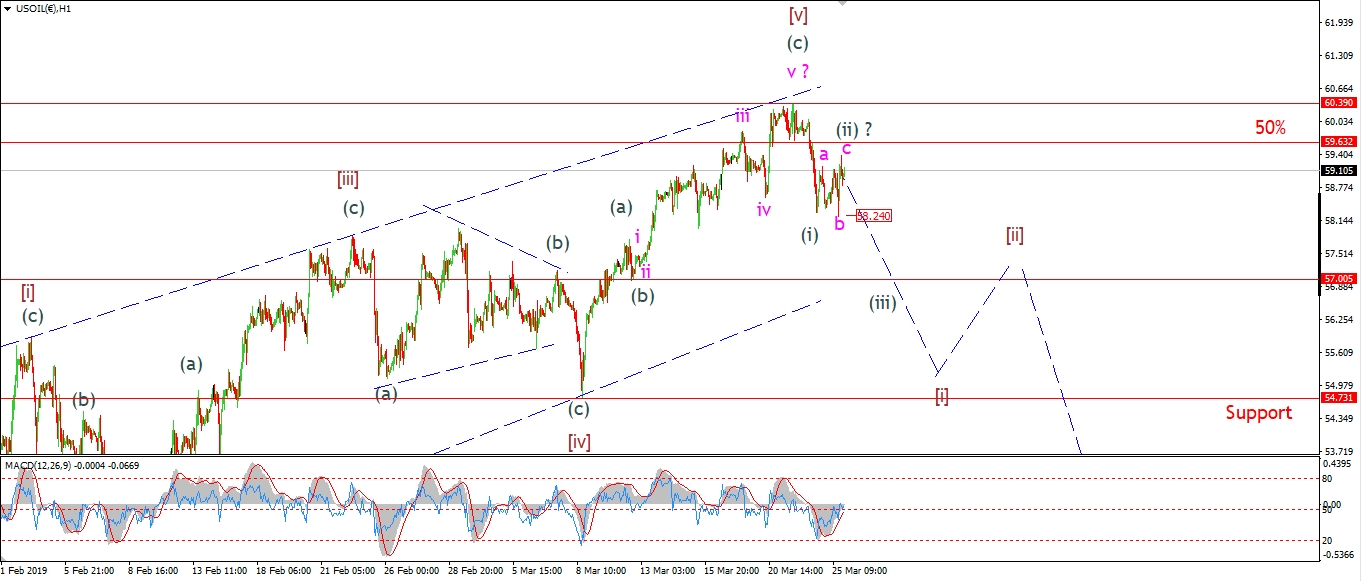 [/vc_column_text][/vc_column][vc_column width=”1/3″][vc_custom_heading text=”4 Hours” use_theme_fonts=”yes”][vc_column_text]
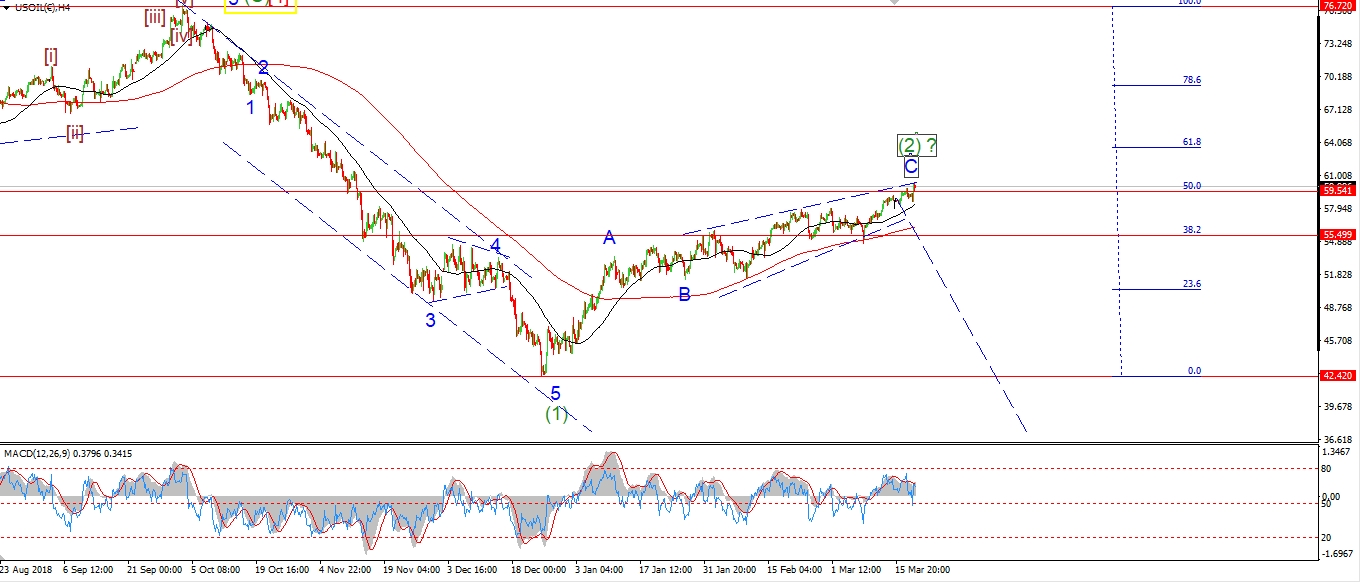 [/vc_column_text][vc_custom_heading text=”Daily” use_theme_fonts=”yes”][vc_column_text]
 [/vc_column_text][/vc_column][/vc_row]
[vc_row][vc_column][vc_column_text]
Crude had a late afternoon spike higher today.
I have labelled this a possible wave ‘c’ of (ii).
If this short term count is correct,
then this should be another down week again for crude,
as wave (iii) of [i] should carry us back towards the 55.00 handle again.
The recent high lies at 60.39,
this level is now key to building a five wave move lower to begin wave (3) down.
The idea from here is simple,
Waves [i] and [ii] should create a classic head and shoulders top around the wave (2) high.
Then we should be set for a large move lower in wave [iii] over the coming weeks.
Tomorrow;
watch for todays high to hold at wave (ii) grey.
A break of 58.00 again will confirm wave (iii) has begun.
[/vc_column_text][/vc_column][/vc_row]
[/_s2If]
[_s2If current_user_can(access_s2member_ccap_us10yr)]
[vc_row][vc_column][vc_separator border_width=”5″][/vc_column][/vc_row][vc_row][vc_column][vc_column_text]
US 10 yr Treasuries.
[/vc_column_text][/vc_column][/vc_row][vc_row][vc_column][vc_separator border_width=”5″][/vc_column][/vc_row][vc_row][vc_column width=”2/3″][vc_custom_heading text=”1 hr” use_theme_fonts=”yes”][vc_column_text]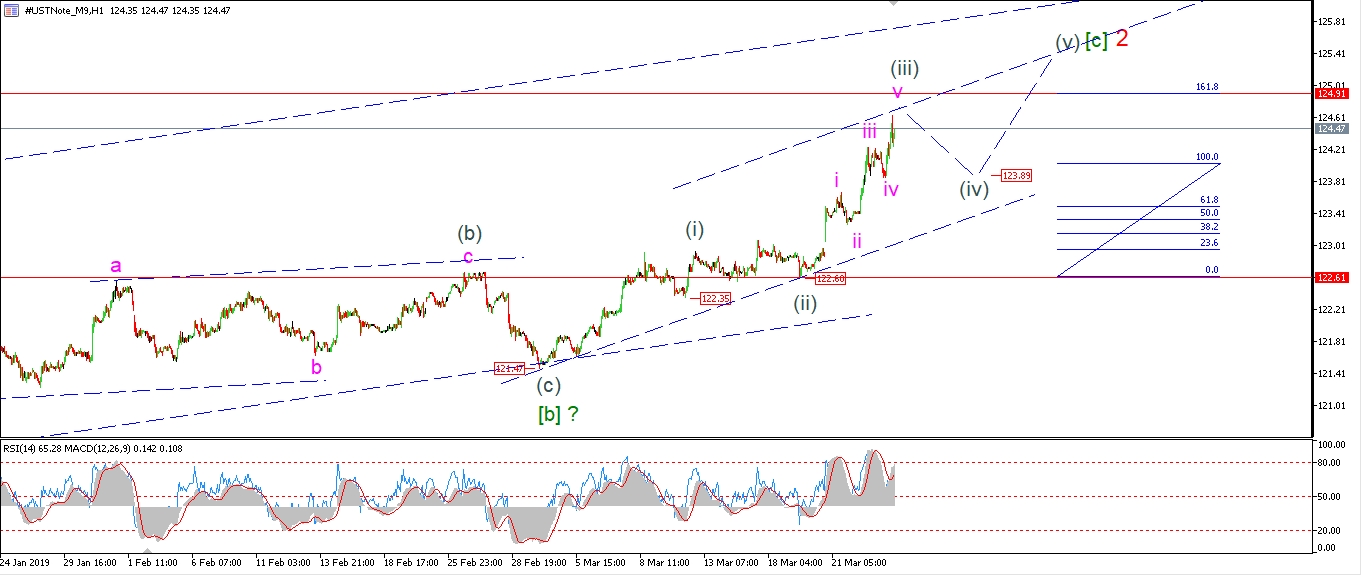 [/vc_column_text][/vc_column][vc_column width=”1/3″][vc_custom_heading text=”4 Hours” use_theme_fonts=”yes”][vc_column_text]
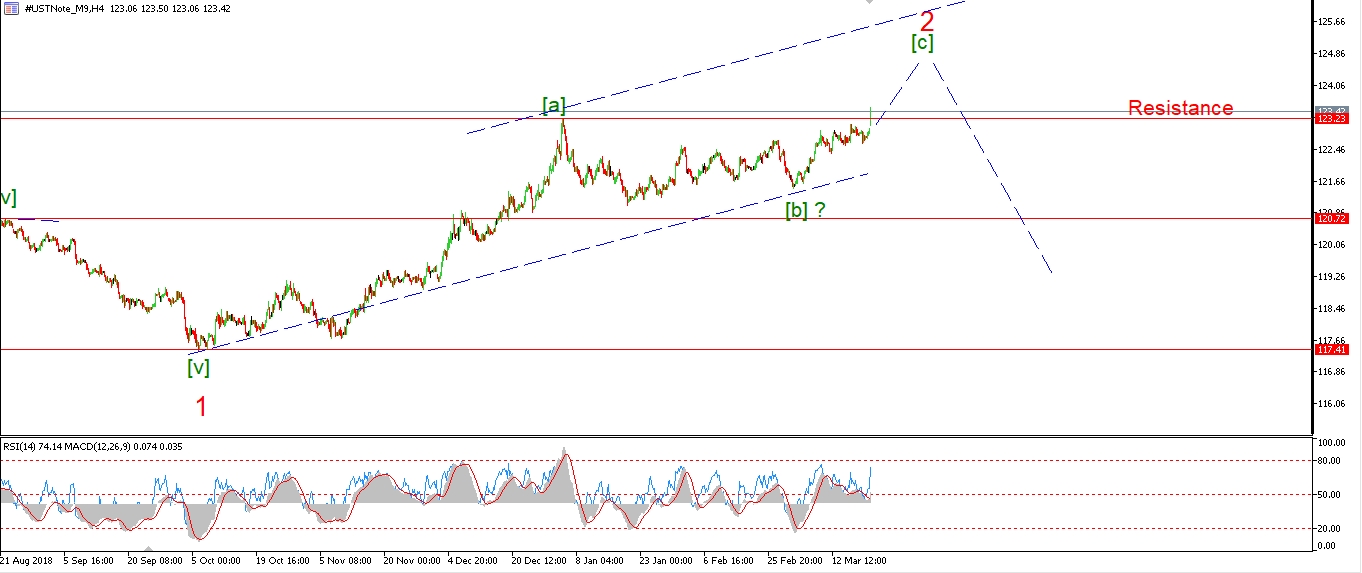 [/vc_column_text][vc_custom_heading text=”Daily” use_theme_fonts=”yes”][vc_column_text]
 [/vc_column_text][/vc_column][/vc_row]
[vc_row][vc_column][vc_column_text]
Todays rally has brought us close to completing wave (iii) of [c].
The price did not quite hit the 162% extension of wave (i).
But it is close enough to start looking for a top for wave (iii).
The drop off the high today may even be the beginning of wave (iv).
And that should take a few days to play out.
Wave (ii) grey took the best part of a week to complete,
so wave (iv) should do something similar.
Tomorrow;
Watch for wave (iv) to correct in at least three waves.
The previous fourth wave suggests a target at about 123.80 for wave (iv).
[/vc_column_text][/vc_column][/vc_row]
[/_s2If]
[_s2If current_user_can(access_s2member_ccap_silver)]
[vc_row][vc_column][vc_separator border_width=”5″][/vc_column][/vc_row][vc_row][vc_column][vc_column_text]
SILVER
[/vc_column_text][/vc_column][/vc_row][vc_row][vc_column][vc_separator border_width=”5″][/vc_column][/vc_row][vc_row][vc_column width=”2/3″][vc_custom_heading text=”1 hr” use_theme_fonts=”yes”][vc_column_text]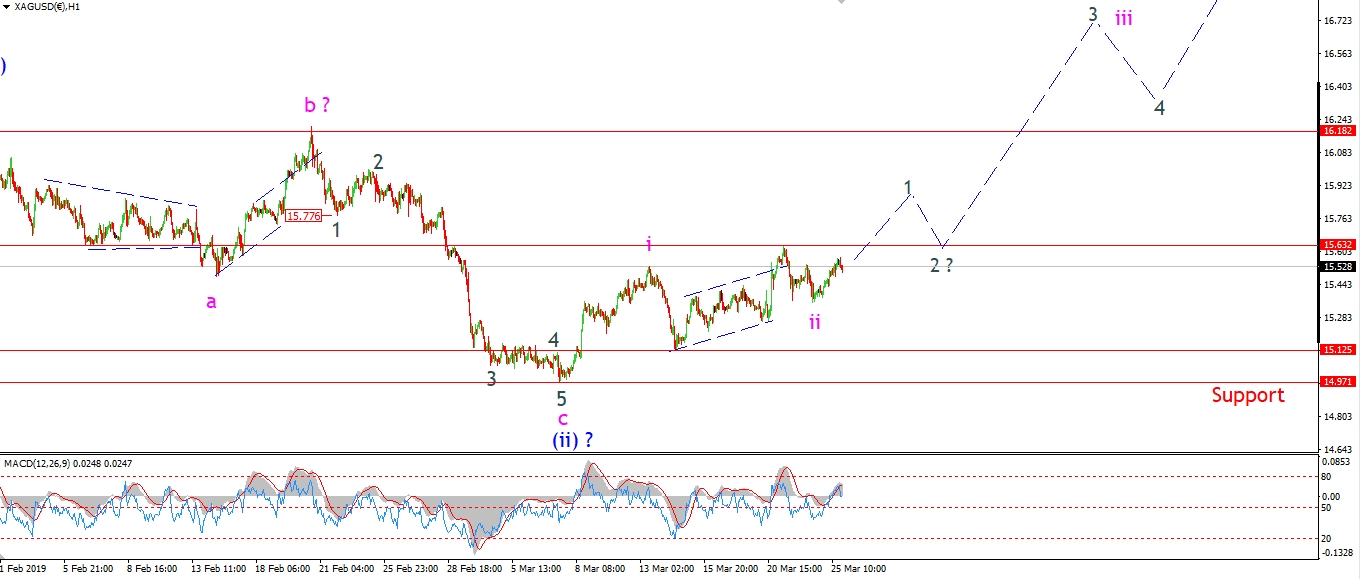 [/vc_column_text][/vc_column][vc_column width=”1/3″][vc_custom_heading text=”4 Hours” use_theme_fonts=”yes”][vc_column_text]
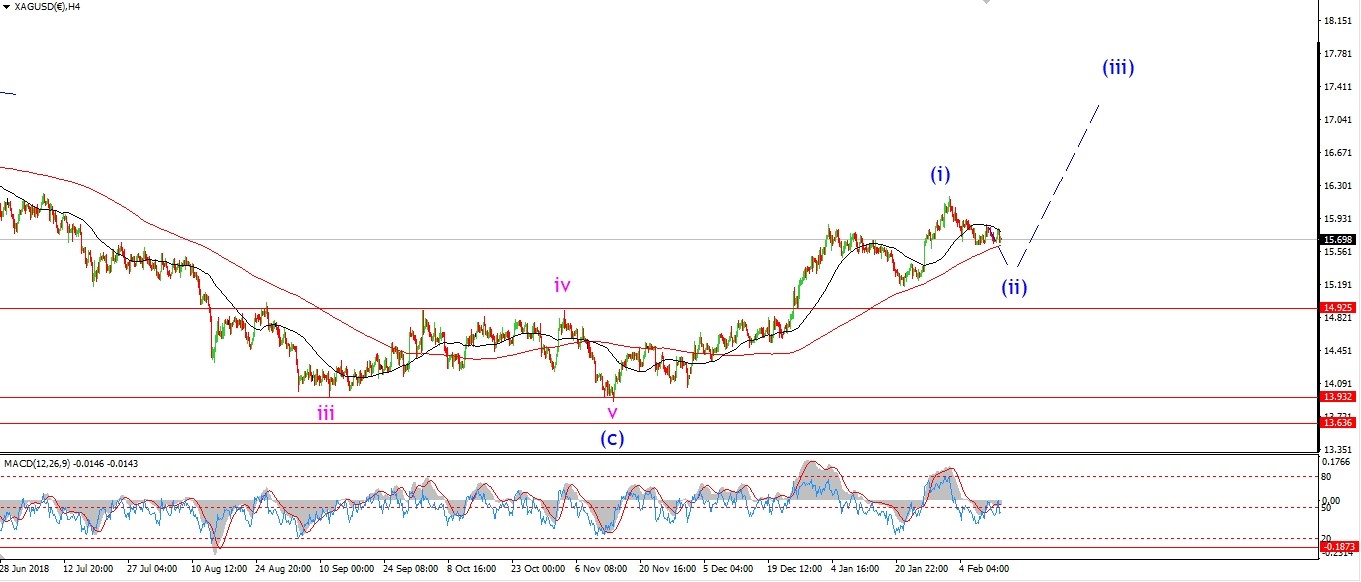 [/vc_column_text][vc_custom_heading text=”Daily” use_theme_fonts=”yes”][vc_column_text]
 [/vc_column_text][/vc_column][/vc_row]
[vc_row][vc_column][vc_column_text]
Silver is higher off Fridays lows which is a positive sign.
Although the pattern higher is not a clear as GOLD just yet.
Last weeks rise in three waves is a hard move to fit within a bullish pattern.
It is possible that wave ‘ii’ completed as a running flat as per the GOLD wave count.
But again
the decline off last weeks high was in three waves,
which is not ideal either.
For the moment I am willing to let the market figure itself out.
No doubt, the pattern will clear up over the coming days.
Tomorrow;
If the price continues to step its way higher and break 16.20 again
then we will be into bullish territory.
and that move will likely confirm wave ‘iii’ up.
Watch for a break of 15.63 again in wave ‘1’ of ‘iii’.
[/vc_column_text][/vc_column][/vc_row]
[/_s2If]
[_s2If current_user_can(access_s2member_ccap_sp500)]
[vc_row][vc_column][vc_separator border_width=”5″][/vc_column][/vc_row][vc_row][vc_column][vc_column_text]
S&P 500.
[/vc_column_text][/vc_column][/vc_row][vc_row][vc_column][vc_separator border_width=”5″][/vc_column][/vc_row][vc_row][vc_column width=”2/3″][vc_custom_heading text=”1 hr” use_theme_fonts=”yes”][vc_column_text]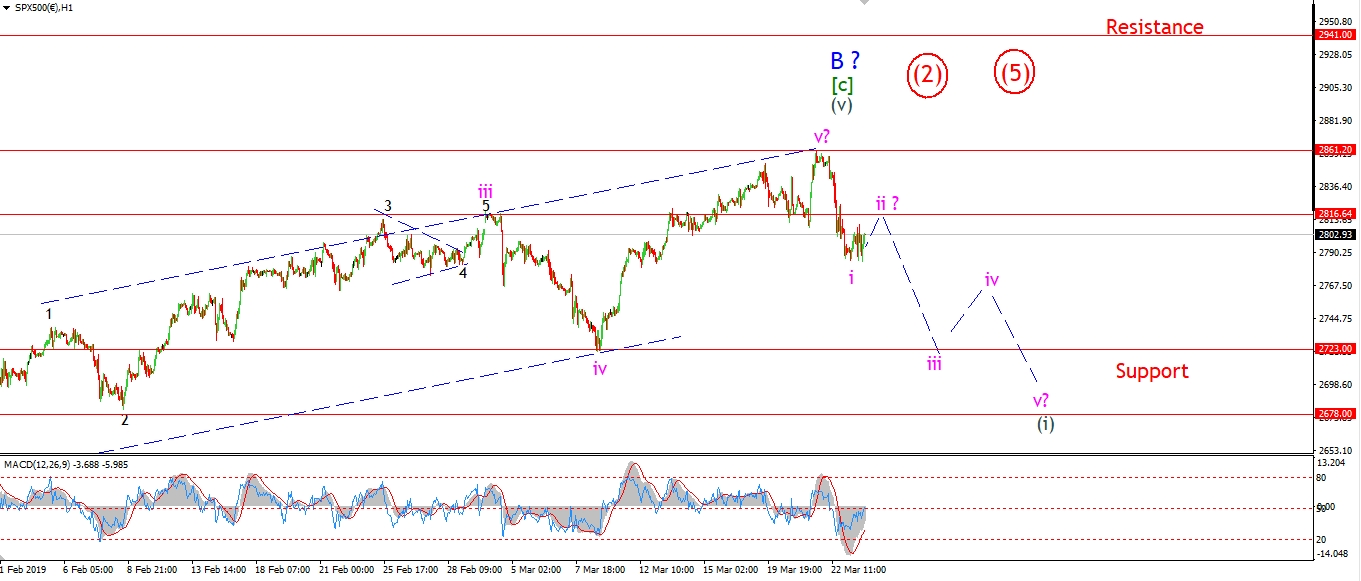 [/vc_column_text][/vc_column][vc_column width=”1/3″][vc_custom_heading text=”4 Hours” use_theme_fonts=”yes”][vc_column_text]
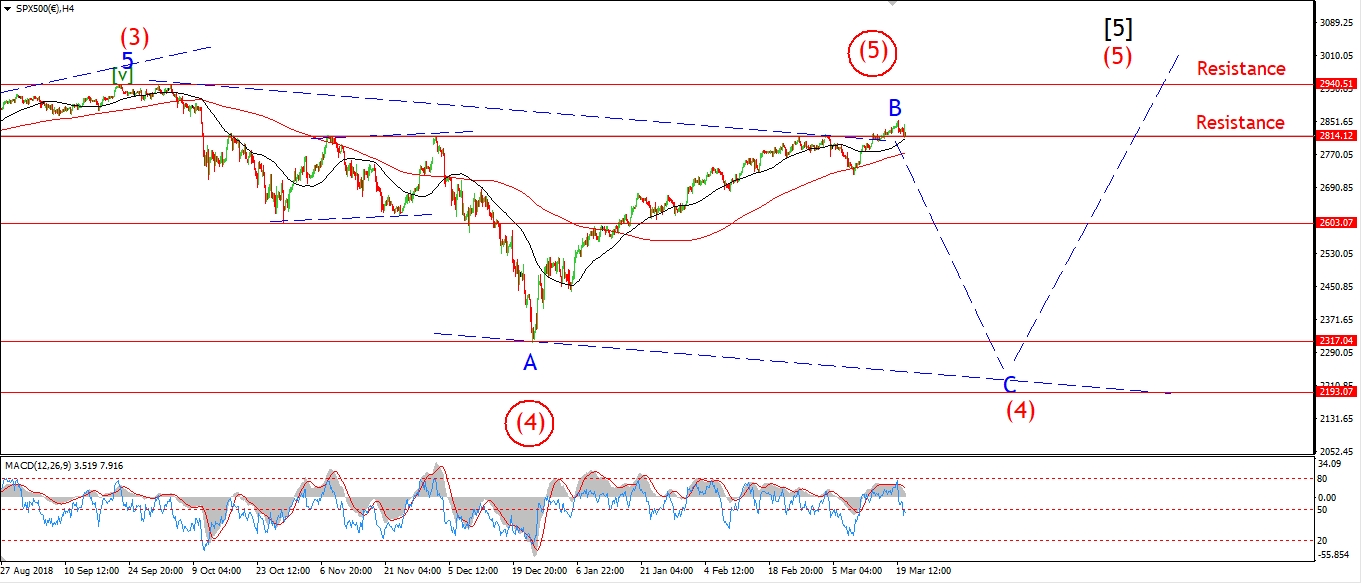 [/vc_column_text][vc_custom_heading text=”Daily” use_theme_fonts=”yes”][vc_column_text]
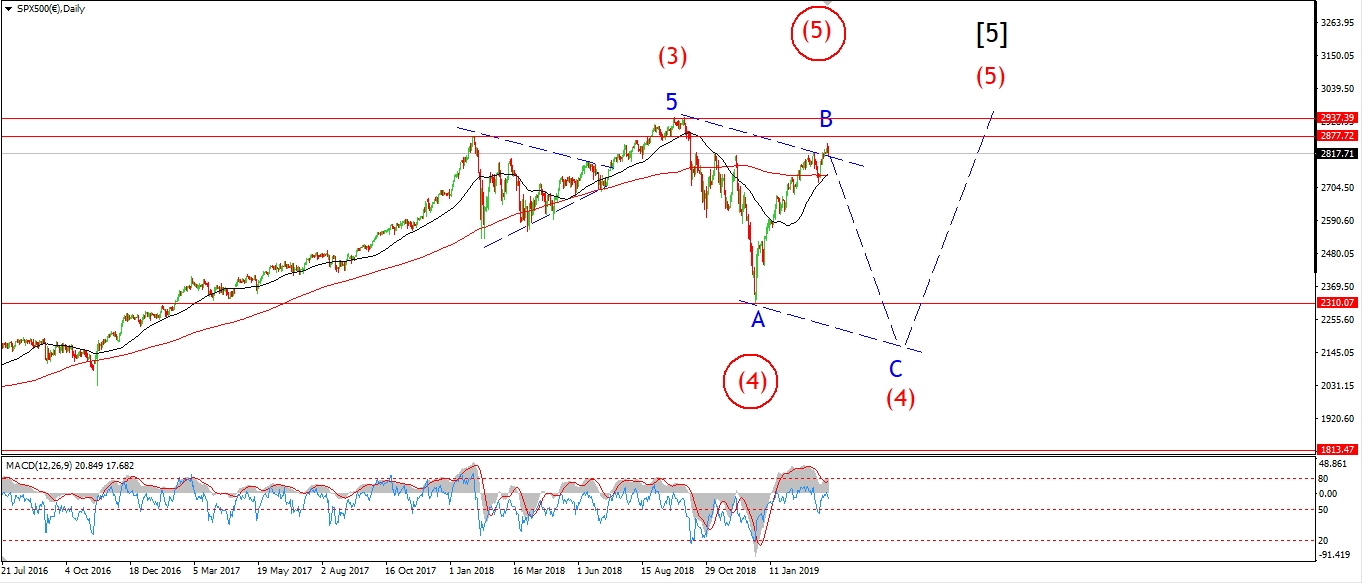 [/vc_column_text][/vc_column][/vc_row]
[vc_row][vc_column][vc_column_text]
The S&P is relatively flat today,
The market spent the day oscillating around the 2800 level in a possible wave ‘ii’ correction.
It is hard to say if wave ‘ii’ is yet complete.
Another push to 2815 again would complete a clearer three wave pattern in wave ‘ii’.
And then a drop into wave ‘iii’ of (i).
But it is not completely necessary either!
If we see another impulsive drop immediately tomorrow,
that will confirm wave ‘iii’ has begun.
Over the coming week,
If the market moves lower in five waves
and breaks the previous fourth wave low at 2723 again.
Then we would be in a strong position to call a top in place.
Tomorrow;
Watch for wave ‘ii’ to complete at about 2815 and then turn lower into wave ‘iii’.
[/vc_column_text][/vc_column][/vc_row]
[/_s2If]
[vc_row][vc_column][vc_column_text]
[/vc_column_text][/vc_column][/vc_row]
[vc_row][vc_column][vc_separator border_width=”5″][/vc_column][/vc_row]