
[vc_row][vc_column][vc_separator border_width=”5″][/vc_column][/vc_row]
[vc_row][vc_column][vc_column_text]
Hi there everyone,
I hope the weekend treated you well.
If you want to watch an epic display of FED speak – the art of talking without saying anything of any substance.
You should take a look at the recent 60 min’s interview with Jerome Powell.
Apparently the economy is doing well,
there are no internal risks building in the U.S economy or banking system,
And the outlook is for more of the same in the future.
He displayed an air of confidence and poise that only an epic top in financial assets can bring!
I do believe this interview will be played back to him over and over again when the downturn inevitably comes.
Lets get into it.
[/vc_column_text][/vc_column][/vc_row]
[_s2If current_user_can(access_s2member_ccap_eurusd)]
[vc_row][vc_column][vc_separator border_width=”5″][/vc_column][/vc_row]
[vc_row][vc_column][vc_column_text]
EURUSD
[/vc_column_text][/vc_column][/vc_row]
[vc_row][vc_column][vc_separator border_width=”5″][/vc_column][/vc_row][vc_row][vc_column width=”2/3″][vc_custom_heading text=”1 hr” use_theme_fonts=”yes”][vc_column_text]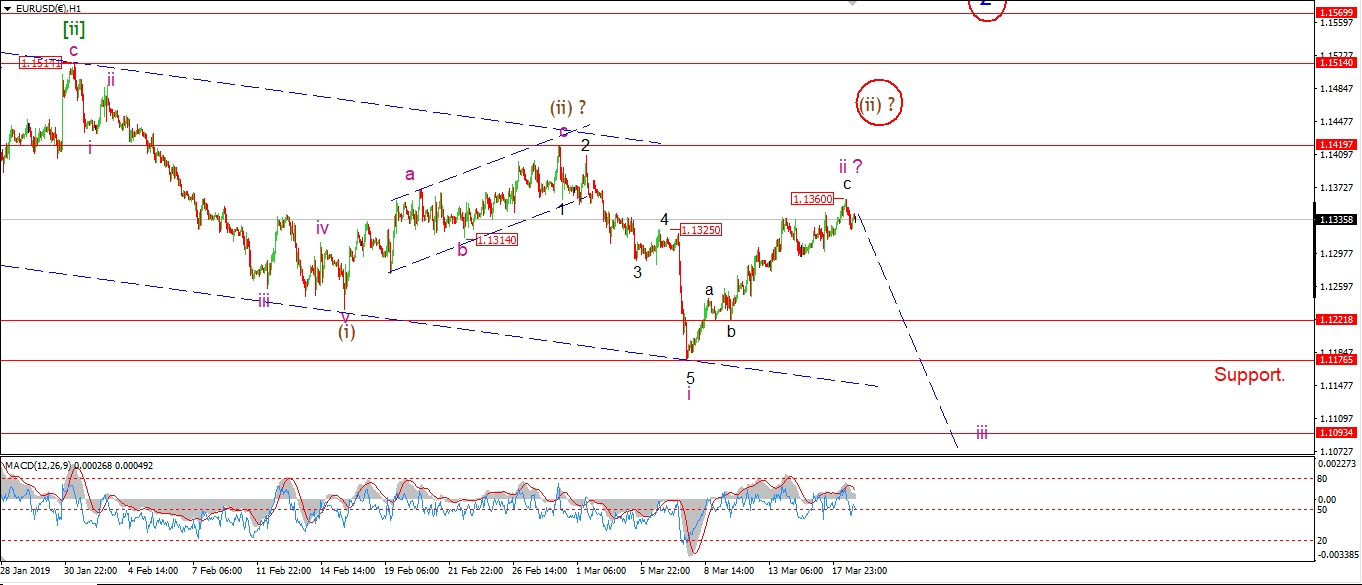 [/vc_column_text][/vc_column][vc_column width=”1/3″][vc_custom_heading text=”4 Hours” use_theme_fonts=”yes”][vc_column_text]
 [/vc_column_text][vc_custom_heading text=”Daily” use_theme_fonts=”yes”][vc_column_text]
 [/vc_column_text][/vc_column][/vc_row]
[vc_row][vc_column][vc_column_text]
Although the price has remained above 1.1300 for the last few trading days,
The action is still very corrective looking so far.
This still points to a corrective lower high in wave ‘ii’ of ‘iii’.
If the price drops tomorrow and break the wave ‘b’ low at 1.1221,
That will signal wave ‘iii’ has begun.
The alternate count showing an extended wave (ii) correction,
will be triggered if price breaks 1.1419.
We are at a significant turning point in EURUSD,
and I favor the downside in the longer term as wave ‘3’ blue takes hold.
The market is grinding through the final moves in a second wave before taking the turn.
Tomorrow;
Watch for wave ‘iii’ down to be confirmed this week.
A break of 1.1221 will do just that.
[/vc_column_text][/vc_column][/vc_row]
[/_s2If]
[_s2If current_user_can(access_s2member_ccap_gbpusd)]
[vc_row][vc_column][vc_separator border_width=”5″][/vc_column][/vc_row][vc_row][vc_column][vc_column_text]
GBPUSD
[/vc_column_text][/vc_column][/vc_row][vc_row][vc_column][vc_separator border_width=”5″][/vc_column][/vc_row][vc_row][vc_column width=”2/3″][vc_custom_heading text=”1 hr” use_theme_fonts=”yes”][vc_column_text]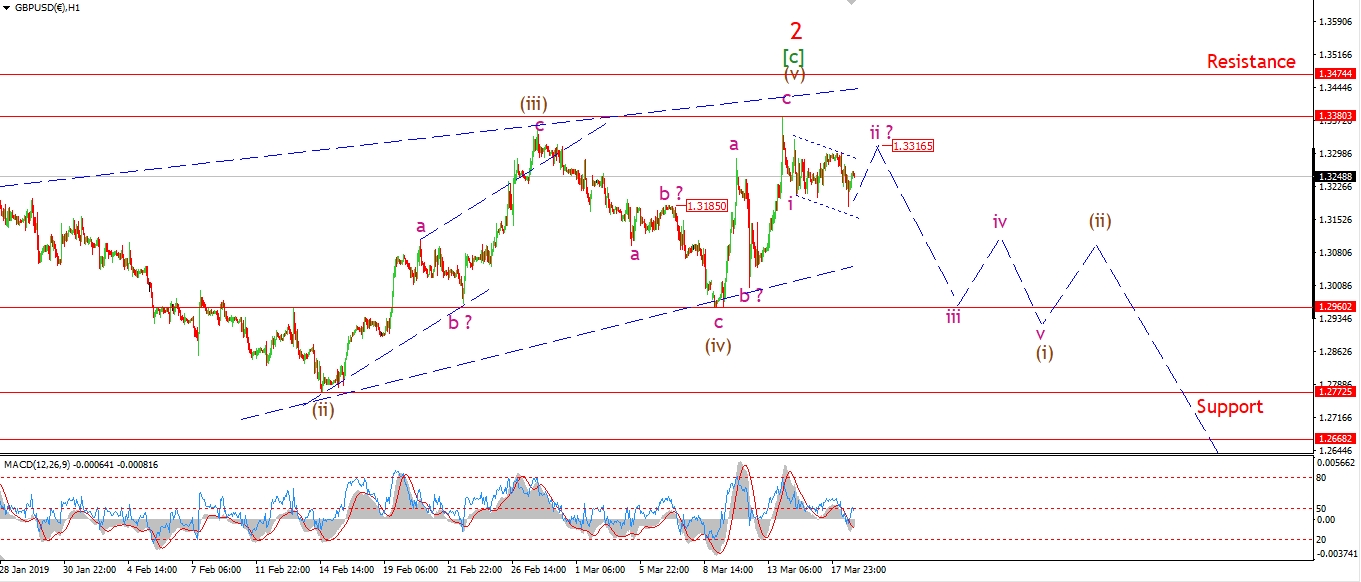 [/vc_column_text][/vc_column][vc_column width=”1/3″][vc_custom_heading text=”4 Hours” use_theme_fonts=”yes”][vc_column_text]
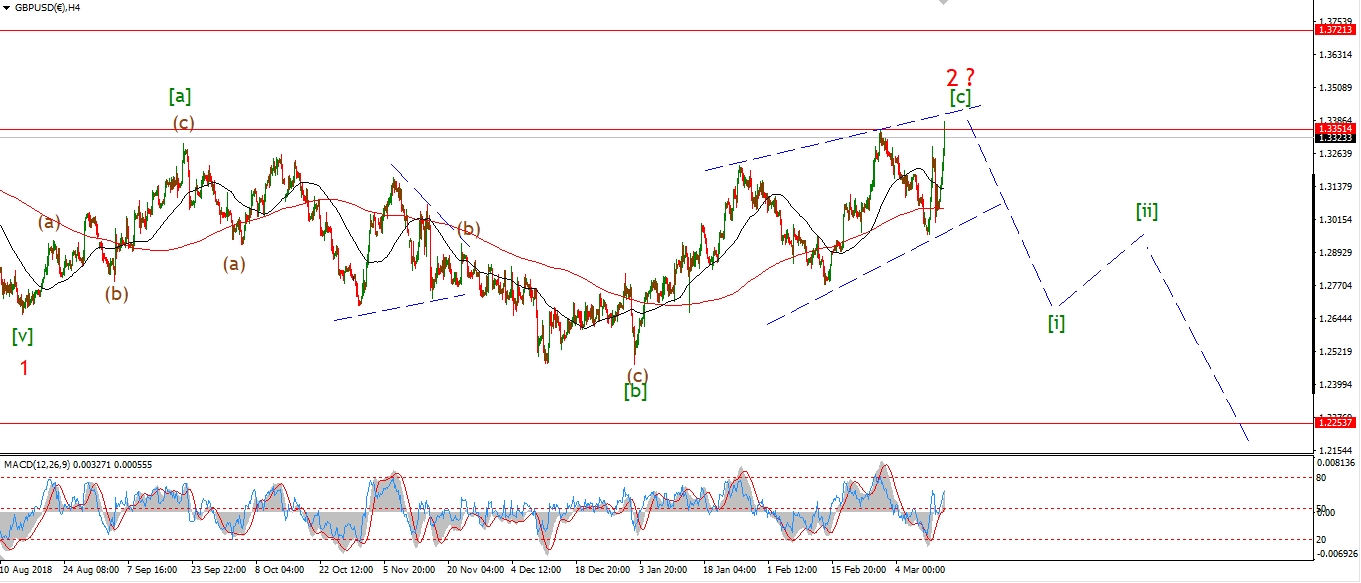 [/vc_column_text][vc_custom_heading text=”Daily” use_theme_fonts=”yes”][vc_column_text]
 [/vc_column_text][/vc_column][/vc_row]
[vc_row][vc_column][vc_column_text]
Cable has dropped today but the decline seems part of a three wave structure within wave ‘ii’.
This suggest wave ‘ii’ will once again test the highs at 1.3320
to complete wave ‘ii’ as an expanded flat,
and then turn lower into wave ‘iii’ of (i).
This weeks action should be dominated by wave (i) down,
And once an impulse wave completes in waves (i) and (ii),
wave (iii) will be set to carry prices back towards the 1.2500 handle again.
Tomorrow;
watch for wave ‘ii’ tom complete below 1.3380 and wave ‘iii’ down to begin.
[/vc_column_text][/vc_column][/vc_row]
[/_s2If]
[_s2If current_user_can(access_s2member_ccap_usdjpy)]
[vc_row][vc_column][vc_separator border_width=”5″][/vc_column][/vc_row][vc_row][vc_column][vc_column_text]
USDJPY
[/vc_column_text][/vc_column][/vc_row][vc_row][vc_column][vc_separator border_width=”5″][/vc_column][/vc_row][vc_row][vc_column width=”2/3″][vc_custom_heading text=”1 hr” use_theme_fonts=”yes”][vc_column_text]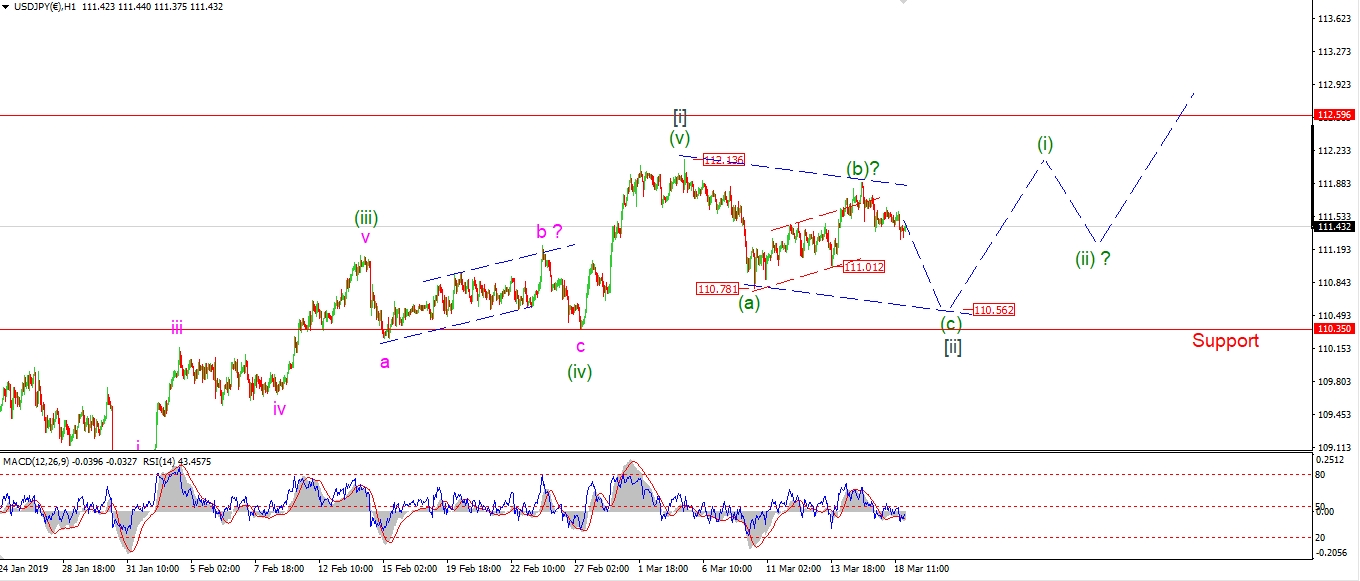 [/vc_column_text][/vc_column][vc_column width=”1/3″][vc_custom_heading text=”4 Hours” use_theme_fonts=”yes”][vc_column_text]
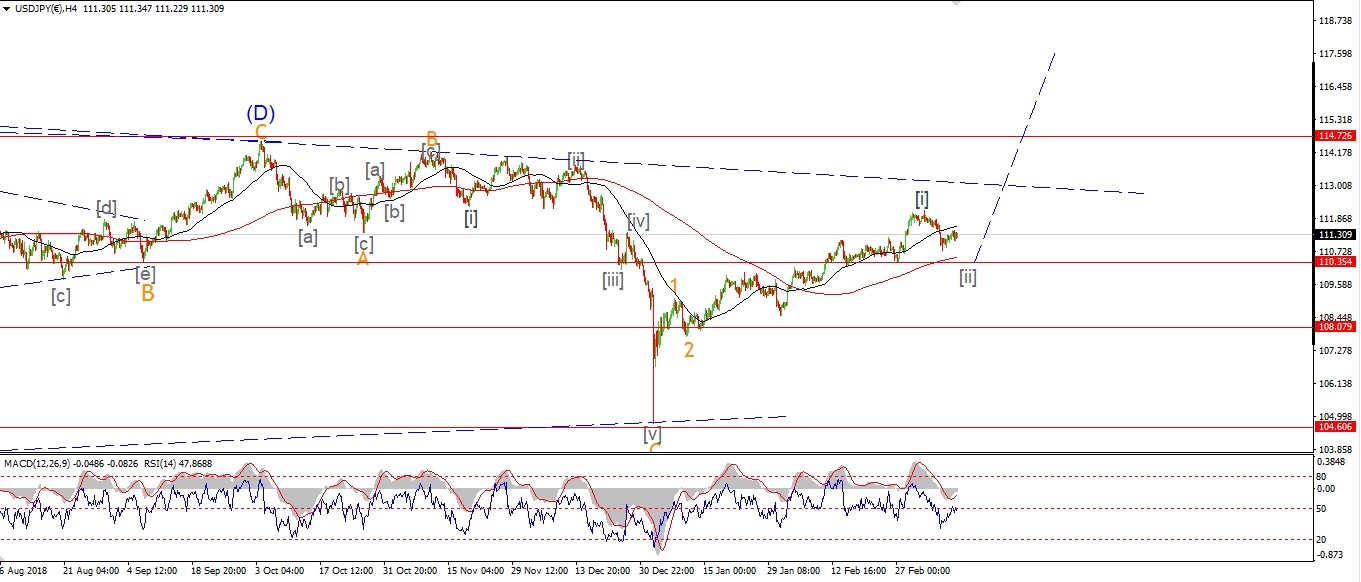 [/vc_column_text][vc_custom_heading text=”Daily” use_theme_fonts=”yes”][vc_column_text]
 [/vc_column_text][/vc_column][/vc_row]
[vc_row][vc_column][vc_column_text]
USDJPY is drifting off the wave (b) high without much force today.
Wave (c) of [ii] is expected to drop below 110.78 again to complete the three wave correction this week.
The overnight session should drop below the wave ‘b’ low at 111.02 again to confirm the count.
I don’t expect this corrective action to last very long though,
Wave [iii] up is itching to get started,
And that should get underway by the end of this week.
Tomorrow;
Watch for a break of 111.02 to confirm wave (c) has begun.
Wave (c) should hit the lower trend channel line at 110.56.
[/vc_column_text][/vc_column][/vc_row]
[/_s2If]
[_s2If current_user_can(access_s2member_ccap_dow_jones)]
[vc_row][vc_column][vc_separator border_width=”5″][/vc_column][/vc_row][vc_row][vc_column][vc_column_text]
DOW JONES INDUSTRIALS
[/vc_column_text][/vc_column][/vc_row][vc_row][vc_column][vc_separator border_width=”5″][/vc_column][/vc_row][vc_row][vc_column width=”2/3″][vc_custom_heading text=”1 hr” use_theme_fonts=”yes”][vc_column_text]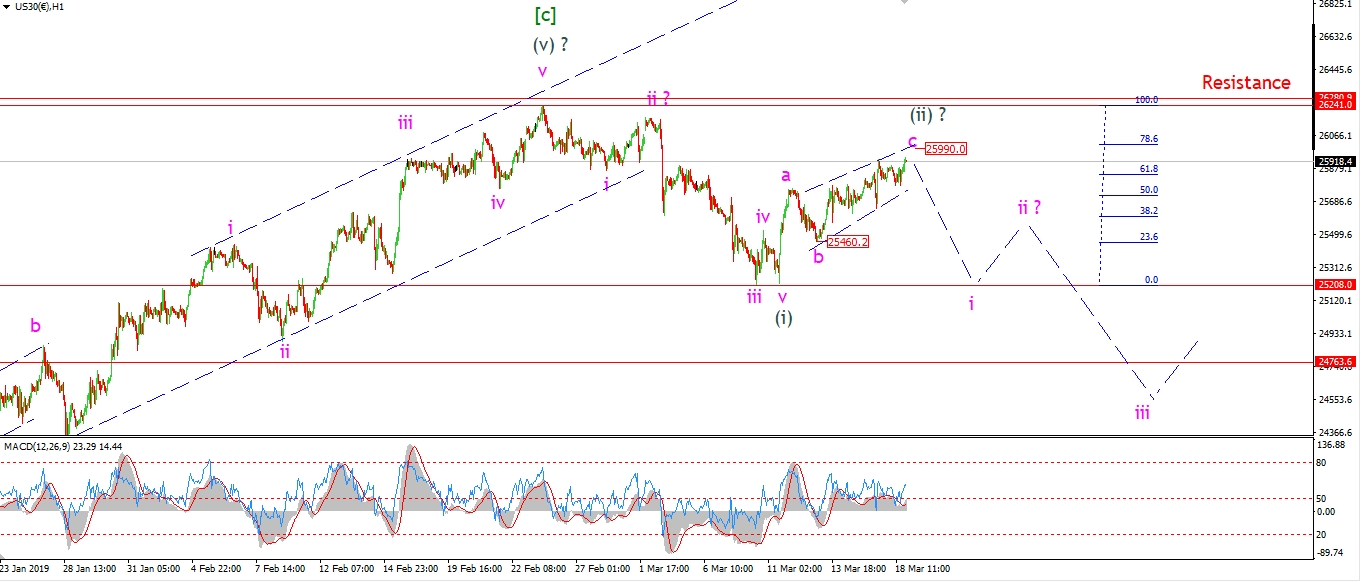 [/vc_column_text][/vc_column][vc_column width=”1/3″][vc_custom_heading text=”4 Hours” use_theme_fonts=”yes”][vc_column_text]
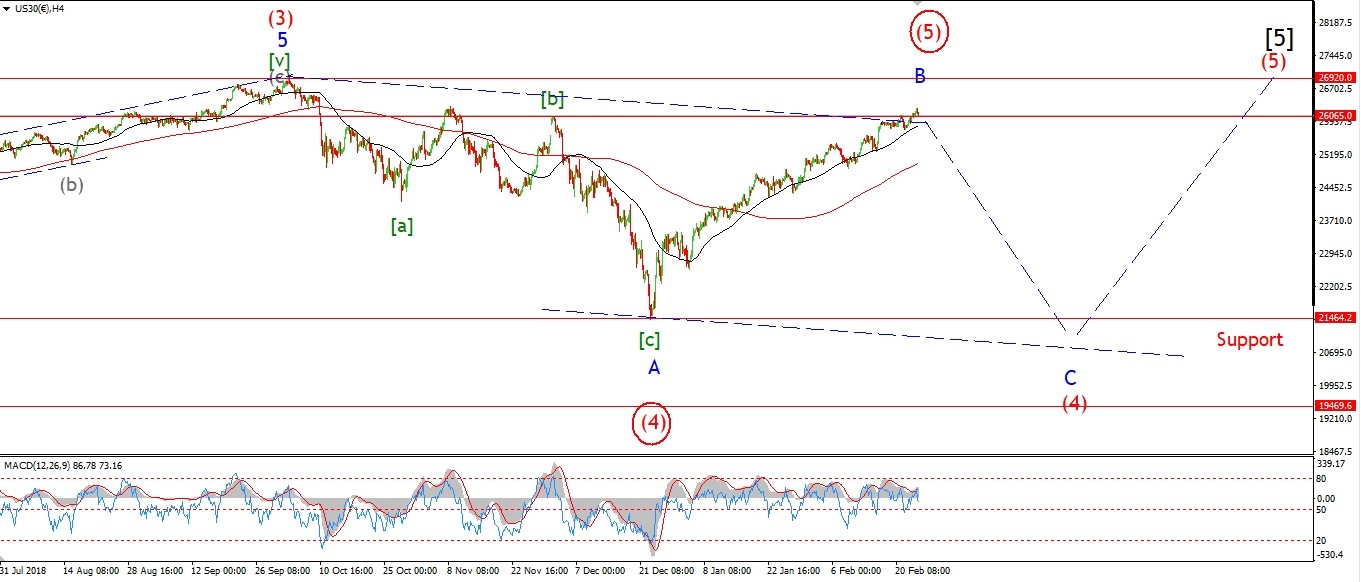 [/vc_column_text][vc_custom_heading text=”Daily” use_theme_fonts=”yes”][vc_column_text]
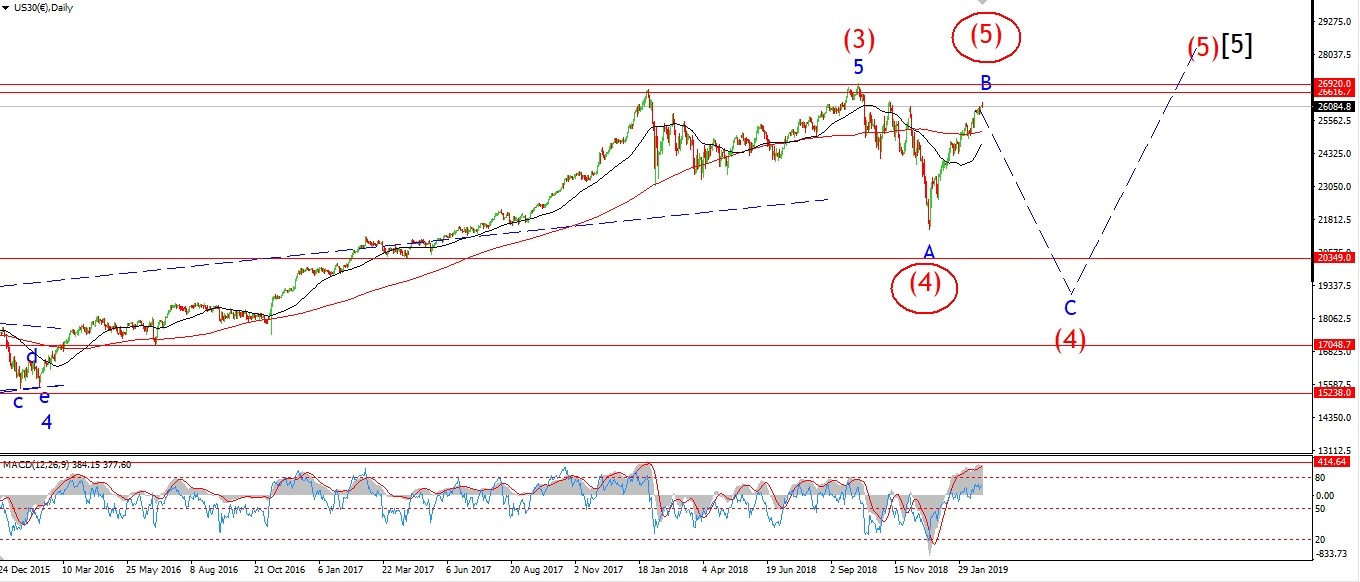 [/vc_column_text][/vc_column][/vc_row]
[vc_row][vc_column][vc_column_text]
Wave ‘c’ of (ii) is drifting towards the upper trend line again today.
The action is very choppy throughout the whole of wave ‘c’.
And this suggests an ending diagonal as the best fit wave form.
Wave ‘c’ will reach equality with wave ‘a’ at 25990,
If we see a drop back below 25460 again this week,
that will be viewed as wave ‘i’ of (iii).
A break of the low at 25200 again will confirm wave (iii) has begun.
If the price turns lower in an impulsive fashion this week,
That will be the third failure in the region of 26000 since last November.
Third times a charm?
Tomorrow;
26240 should still hold.
Watch for a reaction lower off the upper trendline to complete wave ‘c’ and wave (ii).
[/vc_column_text][/vc_column][/vc_row]
[/_s2If]
[_s2If current_user_can(access_s2member_ccap_gold)]
[vc_row][vc_column][vc_separator border_width=”5″][/vc_column][/vc_row][vc_row][vc_column][vc_column_text]
GOLD
[/vc_column_text][/vc_column][/vc_row][vc_row][vc_column][vc_separator border_width=”5″][/vc_column][/vc_row][vc_row][vc_column width=”2/3″][vc_custom_heading text=”1 hr” use_theme_fonts=”yes”][vc_column_text]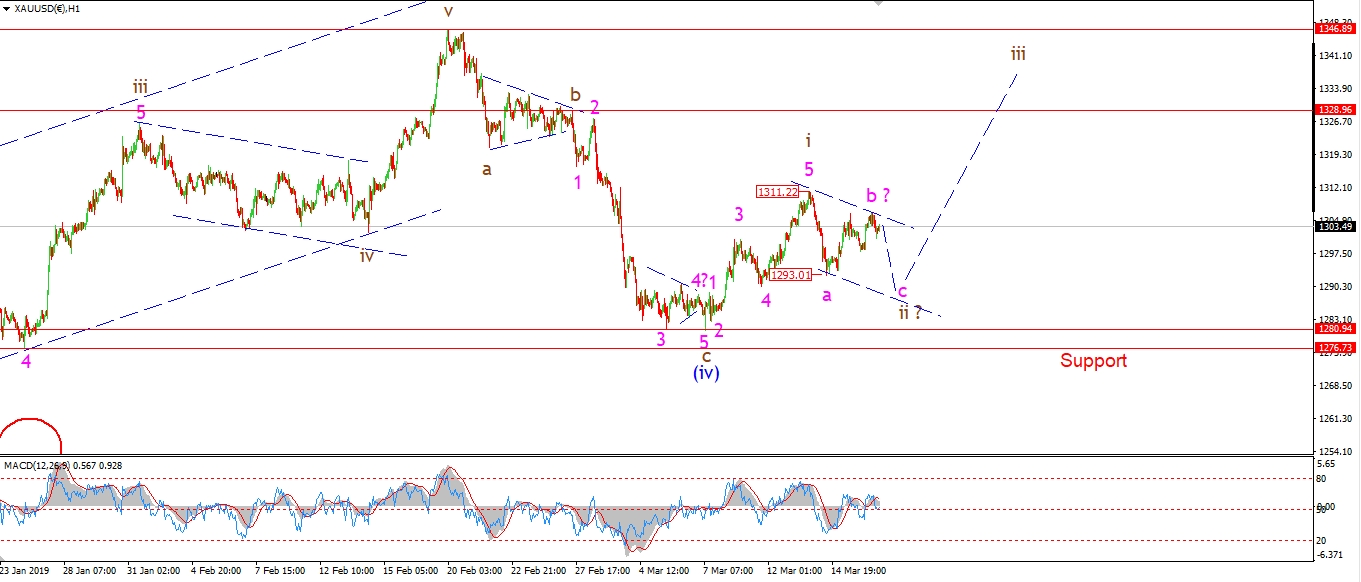 [/vc_column_text][/vc_column][vc_column width=”1/3″][vc_custom_heading text=”4 Hours” use_theme_fonts=”yes”][vc_column_text]
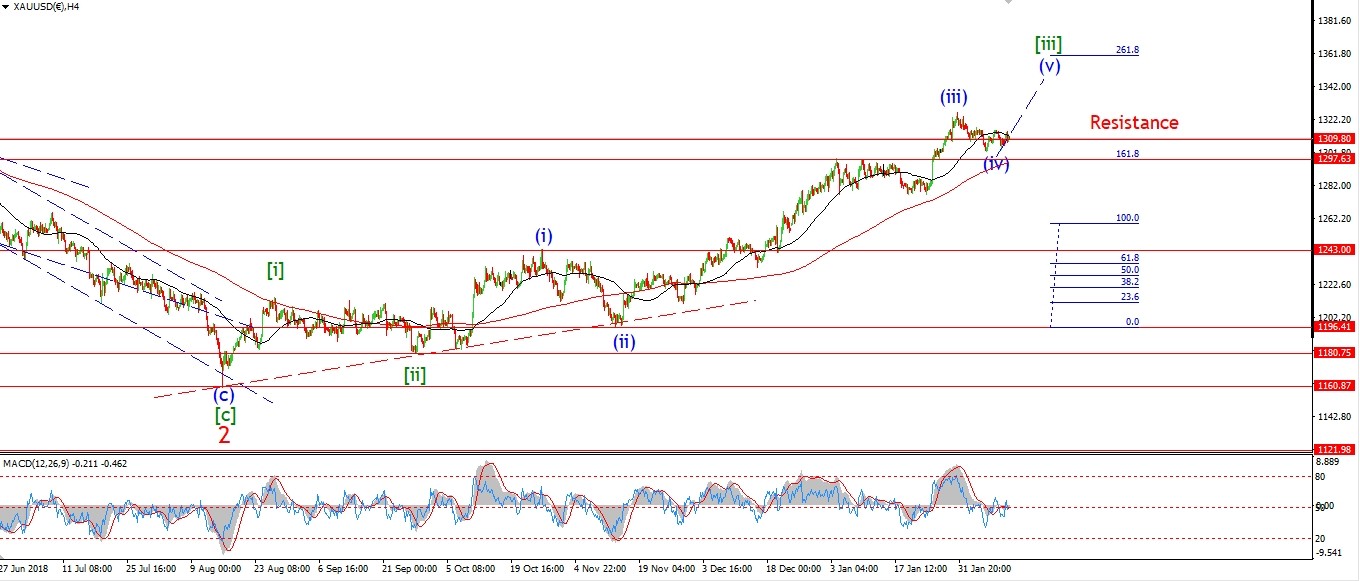 [/vc_column_text][vc_custom_heading text=”Daily” use_theme_fonts=”yes”][vc_column_text]
 [/vc_column_text][/vc_column][/vc_row]
[vc_row][vc_column][vc_column_text]
GOLD has so far failed to drop into the expected wave ‘c’ of ‘ii’.
This lower high is viewed as wave ‘b’ so far,
wave ‘c’ down will complete a clear three wave pattern in wave ‘ii’.
The correction should be complete by mid week,
we can then look higher into wave ‘iii’ of (v).
There is a chance that wave ‘ii’ is already complete at 1293,
if we see an impulsive break above 1311 again
that will favor the idea that wave ‘iii’ has begun.
Tomorrow;
This corrective action should give way to a rally in wave ‘iii’ later this week.
Lets see if wave ‘ii’ completes that clear three wave decline tomorrow.
[/vc_column_text][/vc_column][/vc_row]
[/_s2If]
[_s2If current_user_can(access_s2member_ccap_crude)]
[vc_row][vc_column][vc_separator border_width=”5″][/vc_column][/vc_row][vc_row][vc_column][vc_column_text]
U.S CRUDE OIL
[/vc_column_text][/vc_column][/vc_row][vc_row][vc_column][vc_separator border_width=”5″][/vc_column][/vc_row][vc_row][vc_column width=”2/3″][vc_custom_heading text=”1 hr” use_theme_fonts=”yes”][vc_column_text]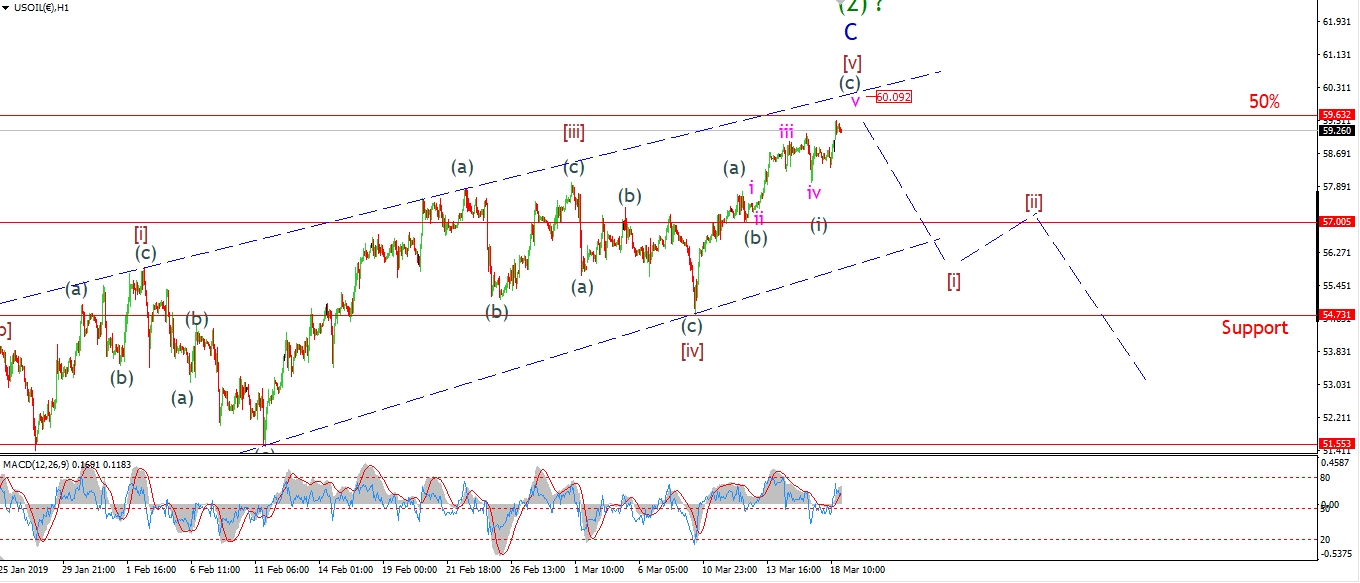 [/vc_column_text][/vc_column][vc_column width=”1/3″][vc_custom_heading text=”4 Hours” use_theme_fonts=”yes”][vc_column_text]
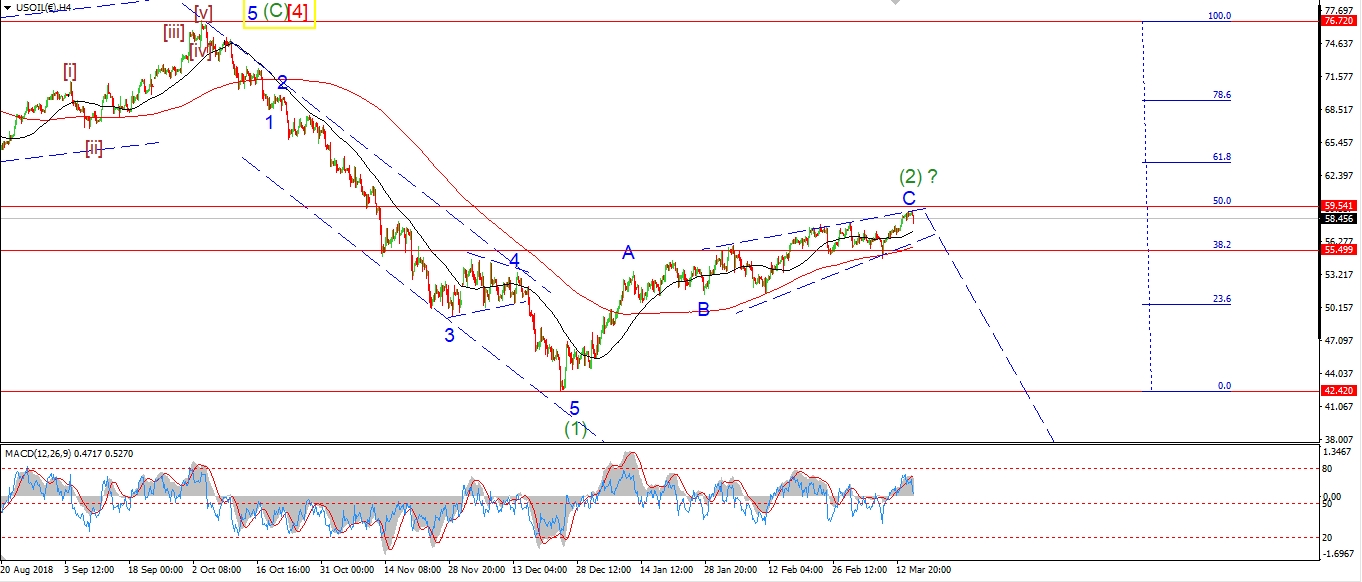 [/vc_column_text][vc_custom_heading text=”Daily” use_theme_fonts=”yes”][vc_column_text]
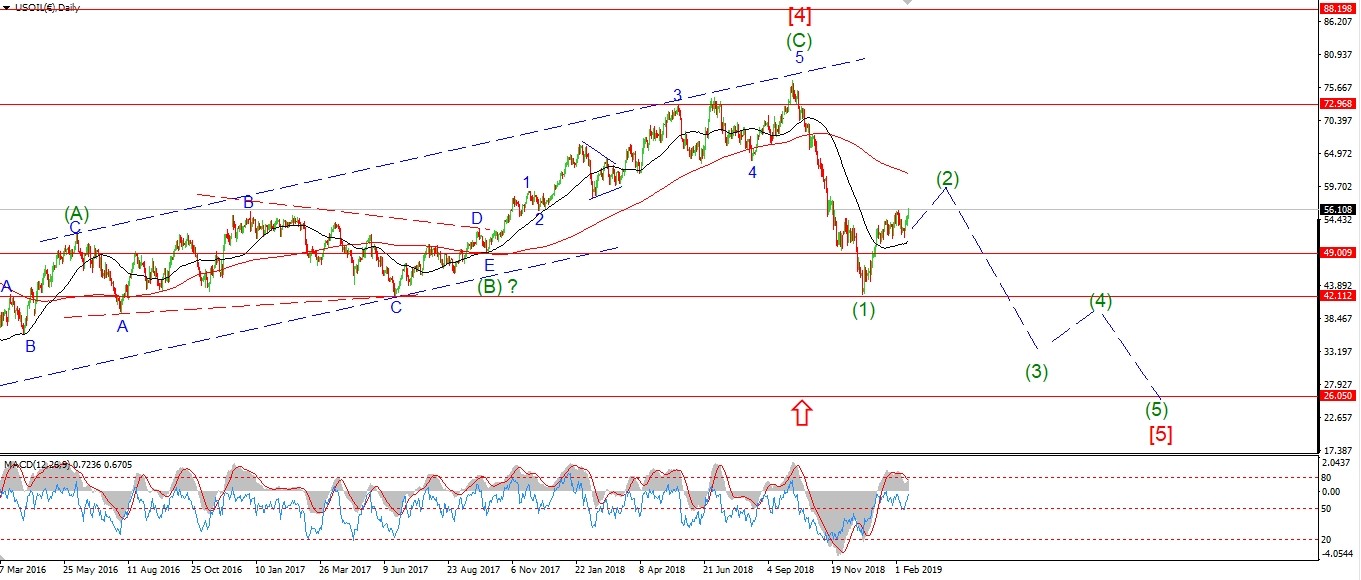 [/vc_column_text][/vc_column][/vc_row]
[vc_row][vc_column][vc_column_text]
The 50% retracement level at 59.60 is proving irresistible to the market now.
The price is almost there after today’s small rally.
A small break above 60.00 would be a perfect end to a perfect second wave rally.
That would carry price back to the upper trend-line again in wave (c) of [v].
And wave (c) would also reach equality with wave (a) at 60.10.
From there we can look for a bearish signal in the form of five wave down off the high to begin wave (3).
Tomorrow;
Wave (c) should top out at about 60.10.
The market should turn lower before the end of the week.
[/vc_column_text][/vc_column][/vc_row]
[/_s2If]
[_s2If current_user_can(access_s2member_ccap_us10yr)]
[vc_row][vc_column][vc_separator border_width=”5″][/vc_column][/vc_row][vc_row][vc_column][vc_column_text]
US 10 yr Treasuries.
[/vc_column_text][/vc_column][/vc_row][vc_row][vc_column][vc_separator border_width=”5″][/vc_column][/vc_row][vc_row][vc_column width=”2/3″][vc_custom_heading text=”1 hr” use_theme_fonts=”yes”][vc_column_text]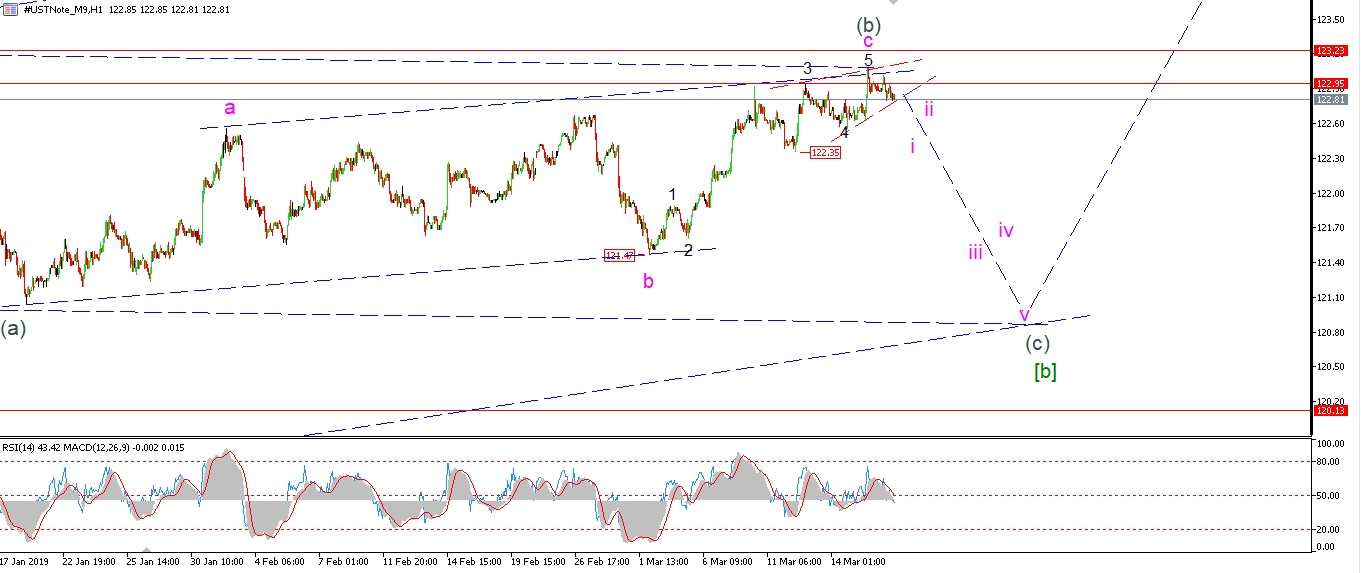 [/vc_column_text][/vc_column][vc_column width=”1/3″][vc_custom_heading text=”4 Hours” use_theme_fonts=”yes”][vc_column_text]
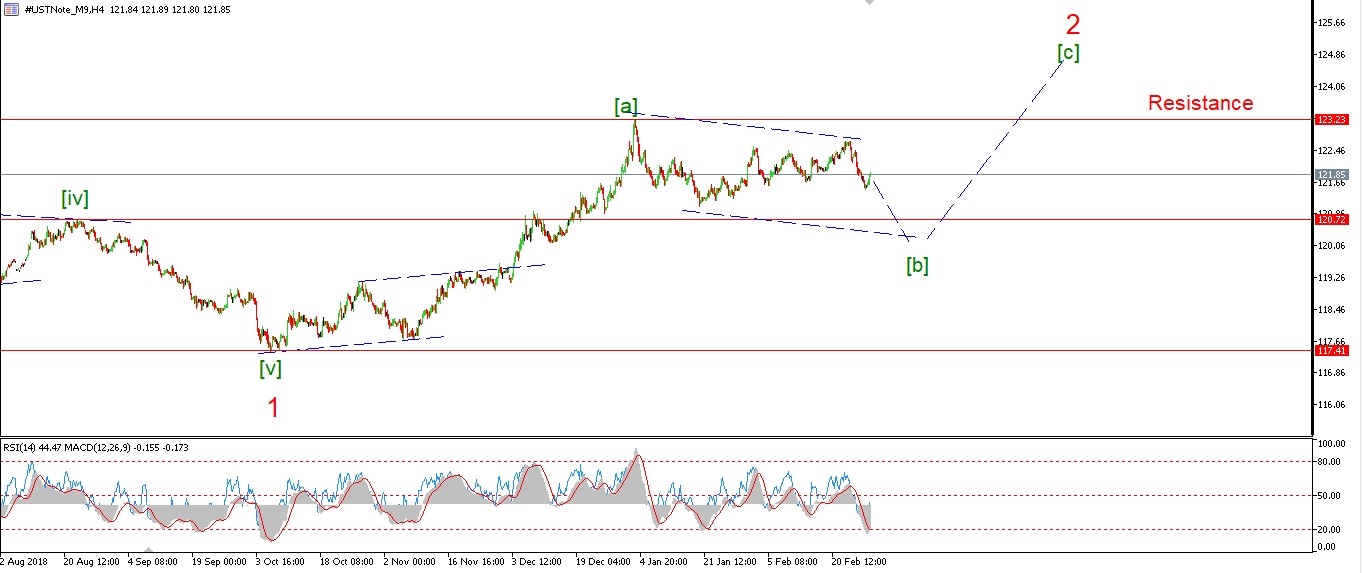 [/vc_column_text][vc_custom_heading text=”Daily” use_theme_fonts=”yes”][vc_column_text]
 [/vc_column_text][/vc_column][/vc_row]
[vc_row][vc_column][vc_column_text]
The focus this week so for a five wave decline to begin in wave (c) grey.
This will complete a larger three wave pattern in wave [b] as seen on the 4hr chart.
The market has not dropped off the high of wave (b) just yet.
But I think we should see the initial decline in wave ‘i’ of (c) by Tuesday evening.
The range is tightening in the recent rally as shown by the red trendlines.
It is possible that wave ‘5’ of ‘c’ is an ending diagonal,
If so we will see one more test of the upper trendline before turning lower in wave (c).
Tomorrow;
Watch for wave ‘c’ to close out and wave ‘i’ down to begin.
A break of 122.35 will confirm wave (c).
[/vc_column_text][/vc_column][/vc_row]
[/_s2If]
[_s2If current_user_can(access_s2member_ccap_silver)]
[vc_row][vc_column][vc_separator border_width=”5″][/vc_column][/vc_row][vc_row][vc_column][vc_column_text]
SILVER
[/vc_column_text][/vc_column][/vc_row][vc_row][vc_column][vc_separator border_width=”5″][/vc_column][/vc_row][vc_row][vc_column width=”2/3″][vc_custom_heading text=”1 hr” use_theme_fonts=”yes”][vc_column_text]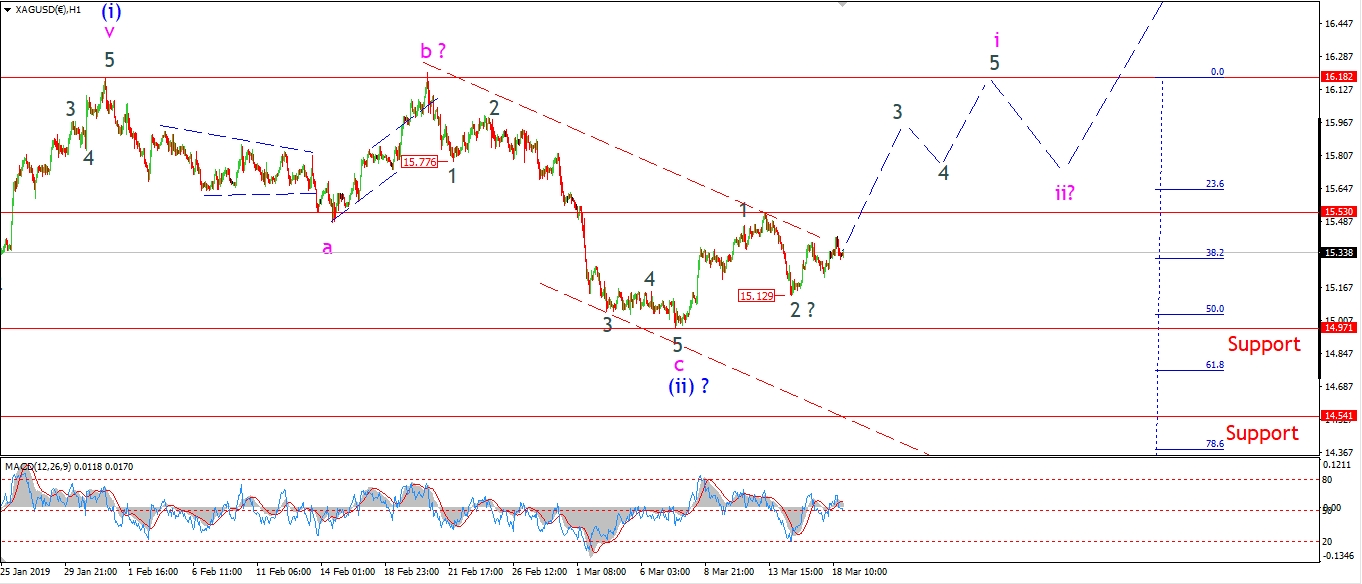 [/vc_column_text][/vc_column][vc_column width=”1/3″][vc_custom_heading text=”4 Hours” use_theme_fonts=”yes”][vc_column_text]
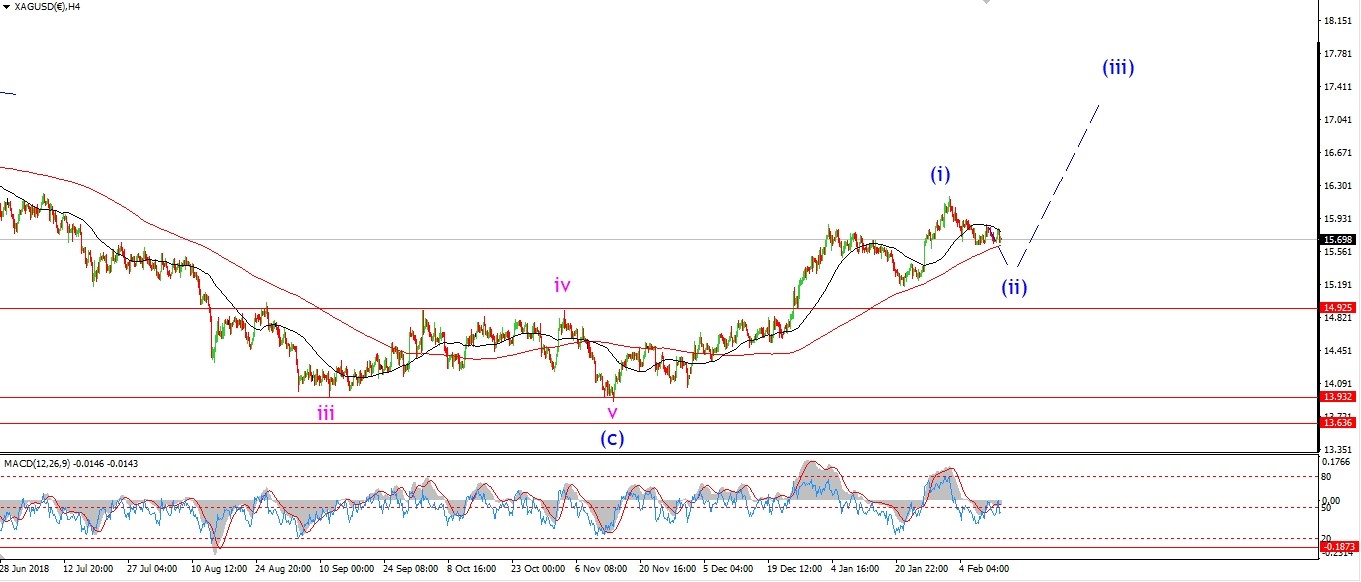 [/vc_column_text][vc_custom_heading text=”Daily” use_theme_fonts=”yes”][vc_column_text]
 [/vc_column_text][/vc_column][/vc_row]
[vc_row][vc_column][vc_column_text]
Silver is rising again off the low of wave ‘2’ at 15.12.
I want this level to hold and for wave ‘3’ to take over this week.
An impulsive break of 15.53 should confirm that wave ‘3’ of ‘i’ has begun.
Tomorrow;
14.97 must hold again,
Watch for wave ‘3’ up to break 15.53 tomorrow.
[/vc_column_text][/vc_column][/vc_row]
[/_s2If]
[_s2If current_user_can(access_s2member_ccap_sp500)]
[vc_row][vc_column][vc_separator border_width=”5″][/vc_column][/vc_row][vc_row][vc_column][vc_column_text]
S&P 500.
[/vc_column_text][/vc_column][/vc_row][vc_row][vc_column][vc_separator border_width=”5″][/vc_column][/vc_row][vc_row][vc_column width=”2/3″][vc_custom_heading text=”1 hr” use_theme_fonts=”yes”][vc_column_text]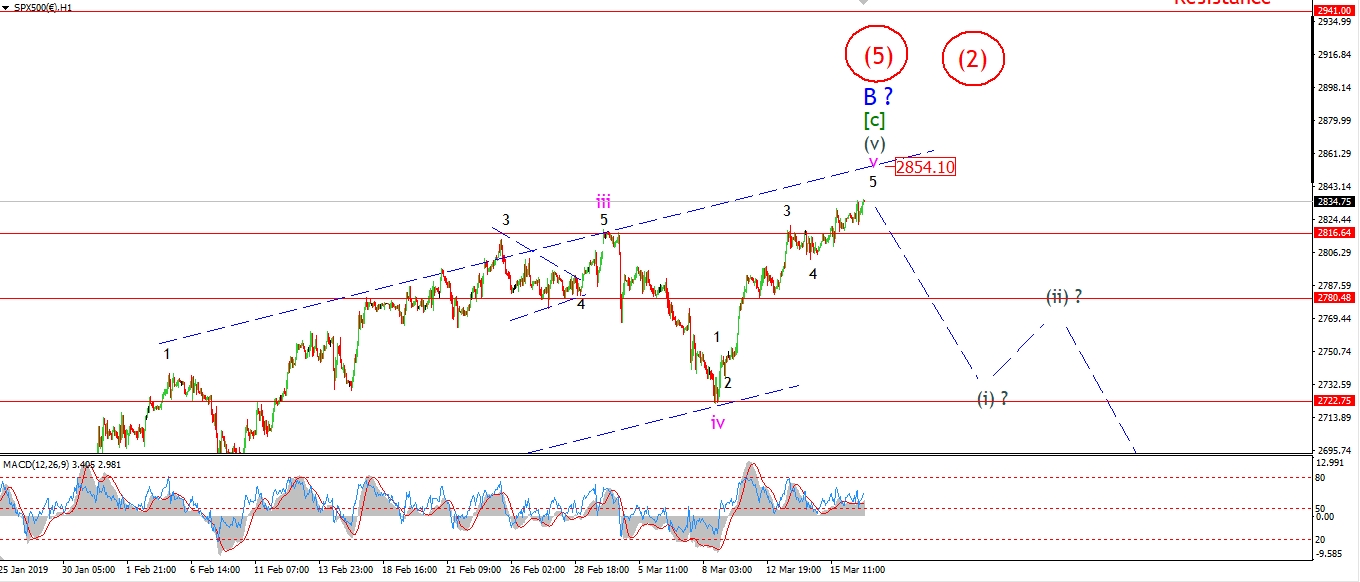 [/vc_column_text][/vc_column][vc_column width=”1/3″][vc_custom_heading text=”4 Hours” use_theme_fonts=”yes”][vc_column_text]
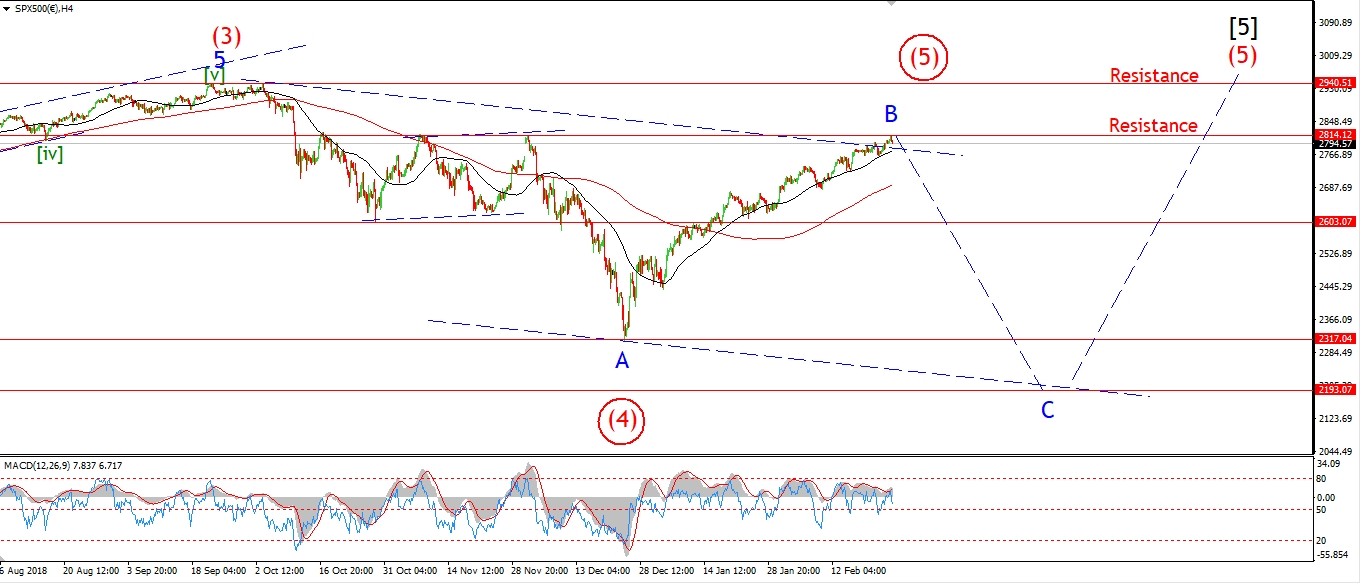 [/vc_column_text][vc_custom_heading text=”Daily” use_theme_fonts=”yes”][vc_column_text]
 [/vc_column_text][/vc_column][/vc_row]
[vc_row][vc_column][vc_column_text]
The market is behaving very much like the top back on the first week of October last.
Momentum on both the daily and 4hr charts has flatlined.
The wave pattern has subdivided to its limit.
Complacency has once again hit the bullish levels seen last September
in many of the indicators I follow.
Bullish sentiment on the Nasdaq hit an all time high in late February.
Added to that,
we are back at the 2850 brick wall which has held the market since November.
This is the fourth test of these levels since the top in October.
Another failure hear will not go unnoticed by the market.
Tomorrow;
The final leg higher in wave ‘v’ of (v) of [c] is all but complete.
The last few days trade have been less than impulsive indicating a possible ending diagonal wave ‘5’.
Price would hit the upper trend channel line again at 2854.
But we may not eve get there given the current action.
Tomorrow;
Watch for wave ‘v’ to complete and the first move lower into wave (i) this week.
[/vc_column_text][/vc_column][/vc_row]
[/_s2If]
[vc_row][vc_column][vc_column_text]
[/vc_column_text][/vc_column][/vc_row]
[vc_row][vc_column][vc_separator border_width=”5″][/vc_column][/vc_row]