
Good evening folks, the Lord’s Blessings to you all.

https://twitter.com/bullwavesreal
EURUSD.
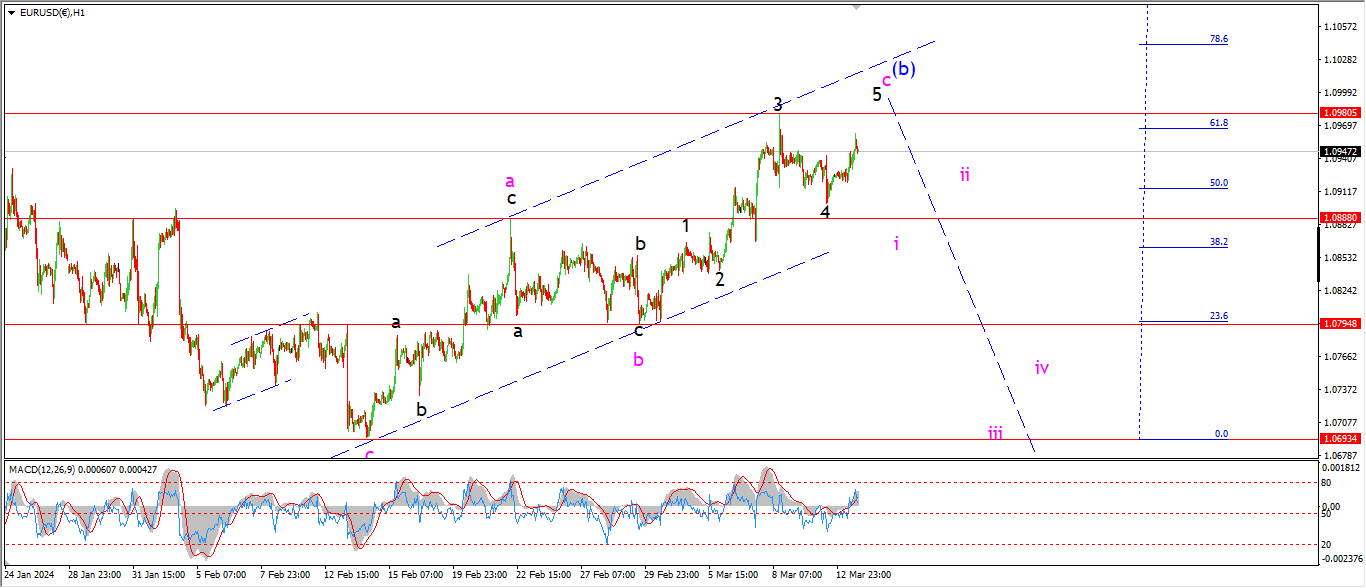
EURUSD 1hr.
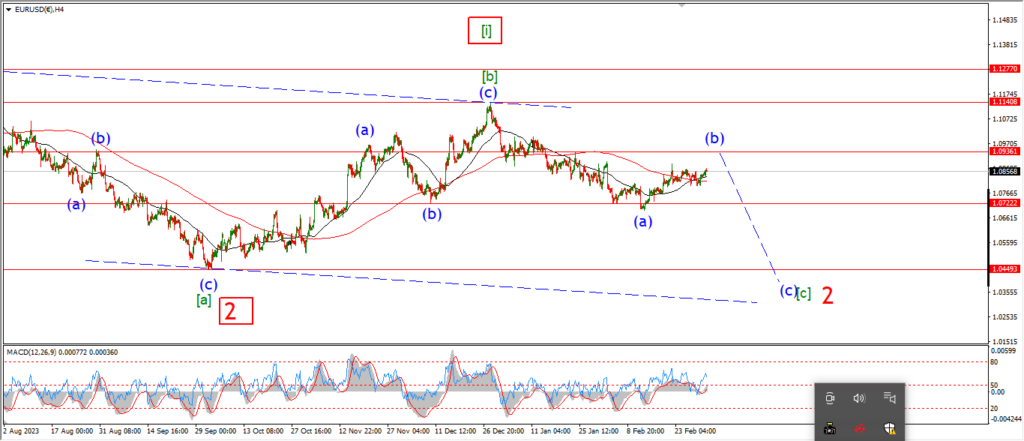
EURUSD 4hr.
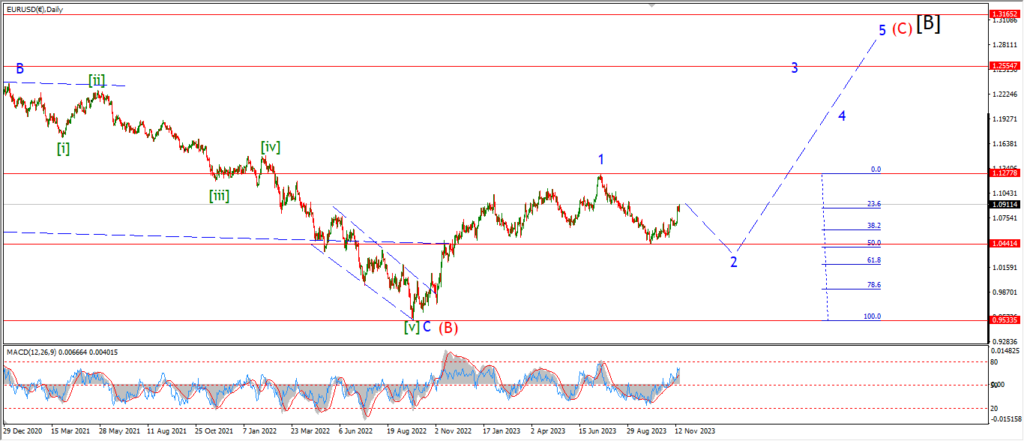
EURUSD daily.
EURUSD is still undecided on what to do with wave ‘c’ of (b).
The price action is leaning in favor of a new high for wave ‘5’ of ‘c’,
and that is what I am showing tonight on the short term chart.
Wave ‘5’ of ‘c’ will break the wave ‘3’ high at 1.0980 to complete three waves up,
and then I will look again for wave ‘i’ of (c) to begin off that new high.
Tomorrow;
Watch for wave ‘5’ of ‘c’ to run higher to break 1.0980 and complete the larger wave (b) pattern.
If we see a turn lower to break the wave ‘a’ high at 1.0888 again,
that will signal wave ‘i’ of (c) is underway.
GBPUSD
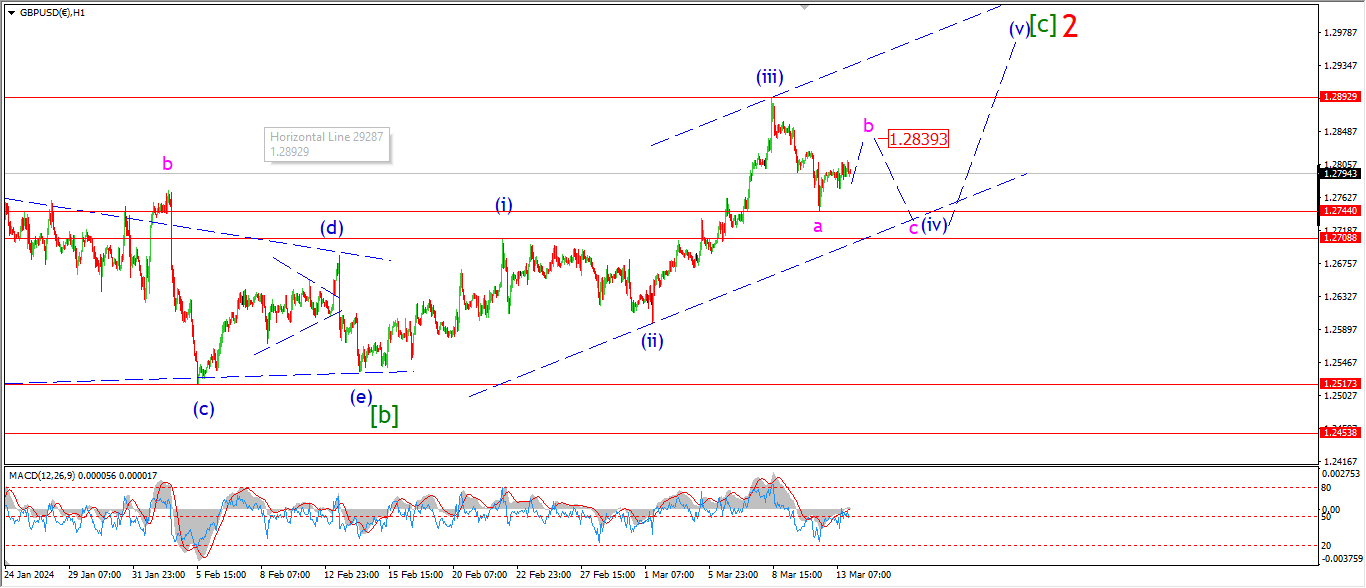
GBPUSD 1hr.
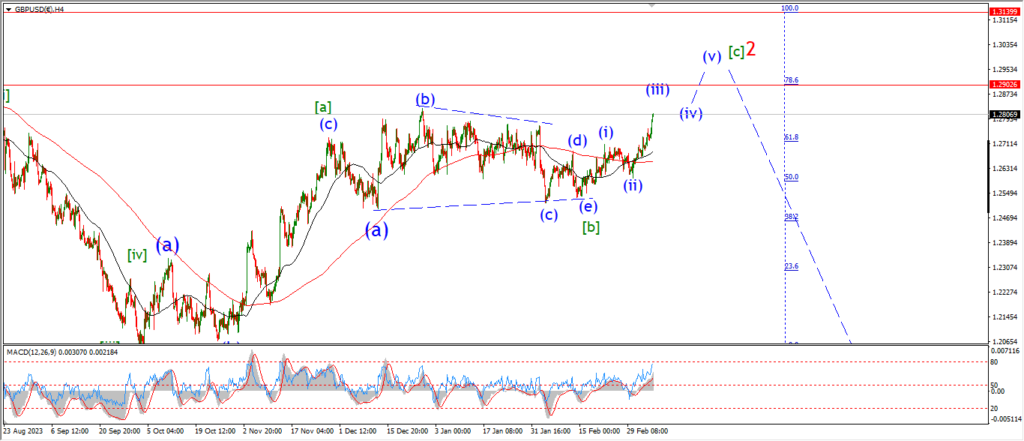
GBPUSD 4hr.
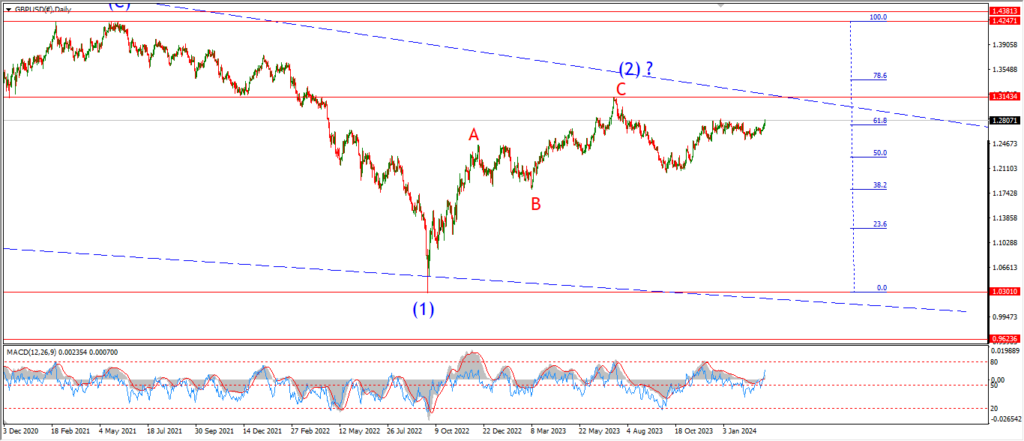
GBPUSD daily.
Wave ‘b’ of (iv) is taking it’s time to develop and I think there is more to come in wave ‘b’ yet.
the price should trace out three waves up near 1.2840,
and then wave ‘c’ will be free to turn lower again as shown.
three waves down in wave (iv) will complete between 1.2744 and 1.2708.
That is a very tight range for the pattern to complete in,
but the wave (i) high must not be broken for this pattern to remain valid.
If the wave (i) high is broken,
that will be the first signal that the price is ready to turn down into that long awaited wave ‘3’ red.
Tomorrow;
Watch for wave ‘b’ of (iv) to trace out a clear three wave pattern to form a lower high near 1.2840.
USDJPY.
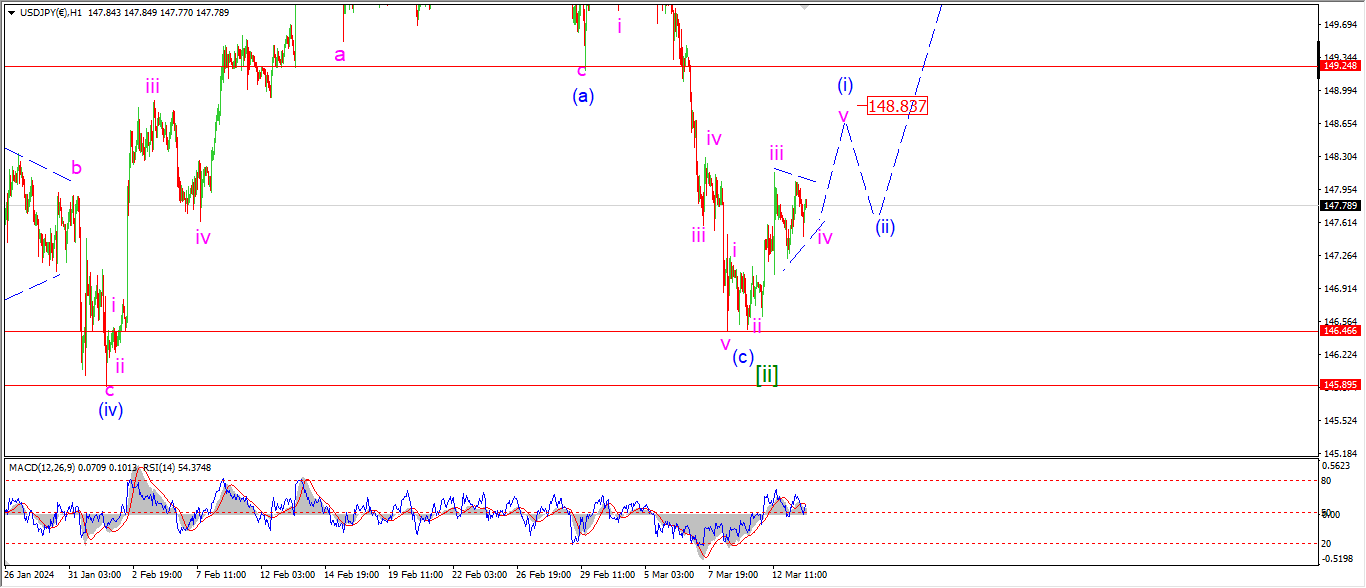
USDJPY 1hr.
USDJPY 4hr.
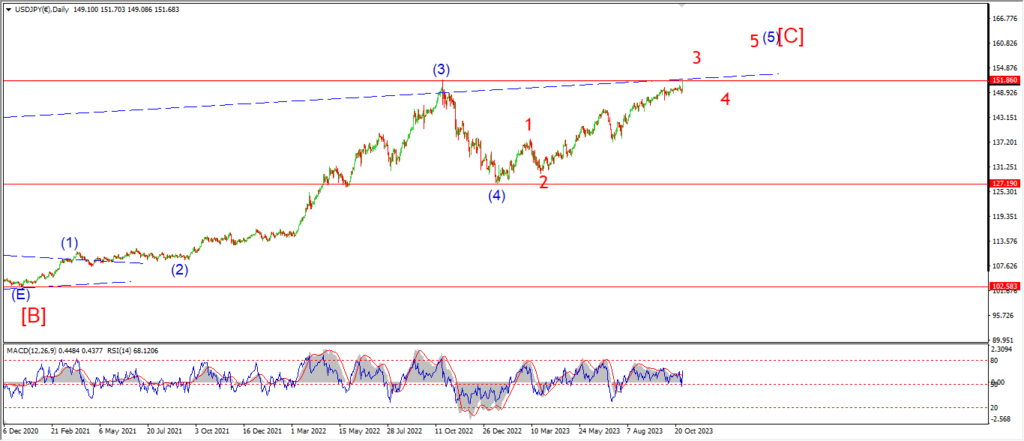
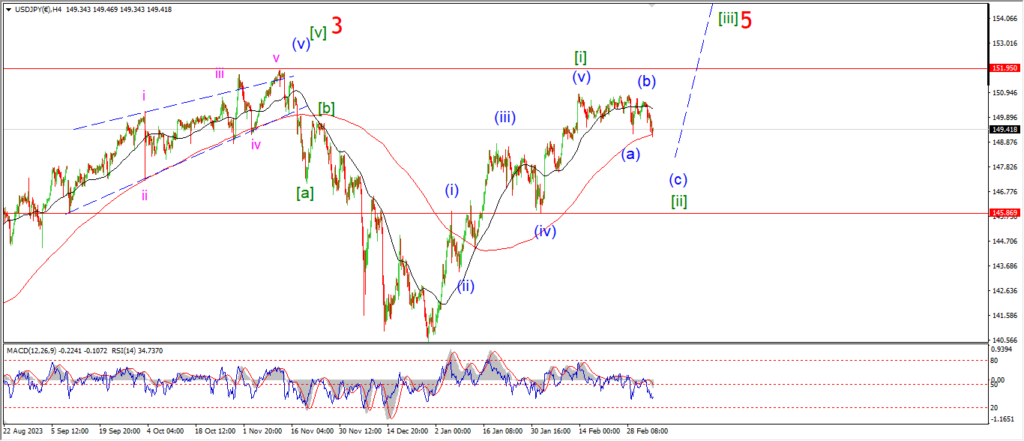
USDJPY daily.
I am tracking a possible five wave pattern higher in wave (i) in more detail tonight.
the sideways action today is shown as a possible triangle wave ‘iv’ in pink.
If this is correct,
then wave ‘v’ will turn higher again tomorrow and top out near 148.80.
I was looking for a break of the wave (a) low at 149.25 to complete wave (i),
that does not look likely at the moment.
The wave (i) pattern is working out quite well so far,
so I think it is worth giving this idea time to flesh out.
Tomorrow;
The overnight trade should be enough to complete that small triangle in wave ‘iv’.
Watch for wave (i) to complete five waves up near 148.80.
DOW JONES.
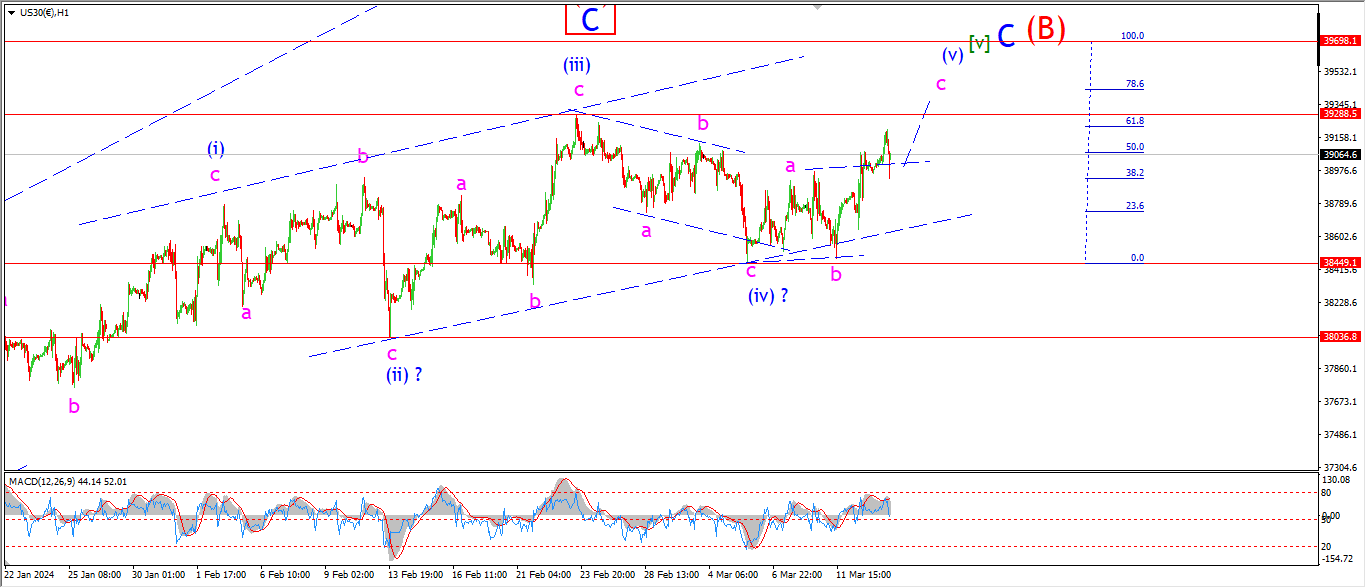
DOW 1hr.
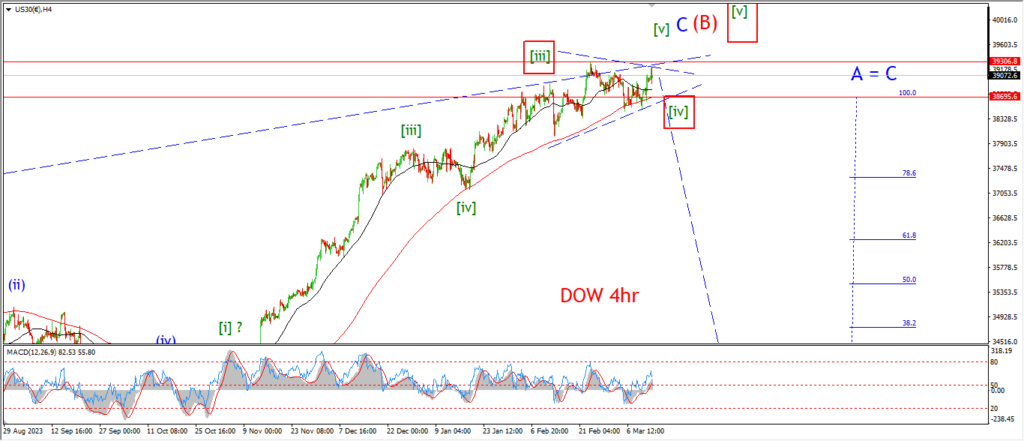
DOW 4hr
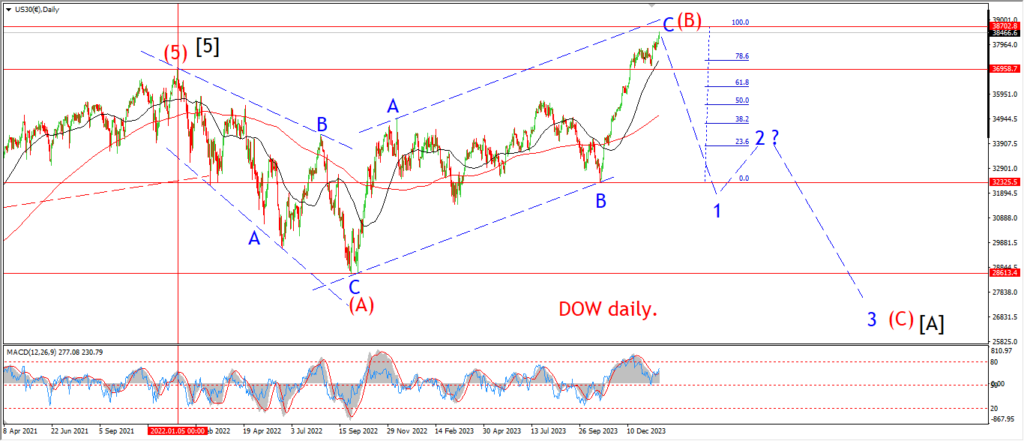
DOW daily.
Lets zoom out a little tonight and start on the 4hr chart.
This market has spent the last 6 weeks hugging the upper trend channel line of wave (B) in red.
The market hit the A=C target level on February the 2nd,
and since then we have basically tracked sideways within a pretty tight range.
This action can be read in 2 ways at the moment.
The price is consolidating in a triangle wave [iv],
before moving higher again in a final fifth wave.
Or,
this market has lost all bullish potential here,
and we are sputtering out the last sub waves in wave ‘v’ of (v) of [v].
The gains are becoming more difficult,
and the loss of momentum will result in a sharp and decisive move lower to begin wave [i] of ‘1’ of (C) to the downside soon.
I cannot decide between those ideas at the moment.
My bias sits with the latter interpretation as you can see on the hourly chart.
I’m sorry that I can’t be more precise than that at the moment!
Tomorrow;
After the action today came so close to a new high I think the main count is is worth sticking with.
Wave ‘c’ of (v) of this ending diagonal pattern should hit a new high this week.
And then we have another completed pattern on our hands.
GOLD
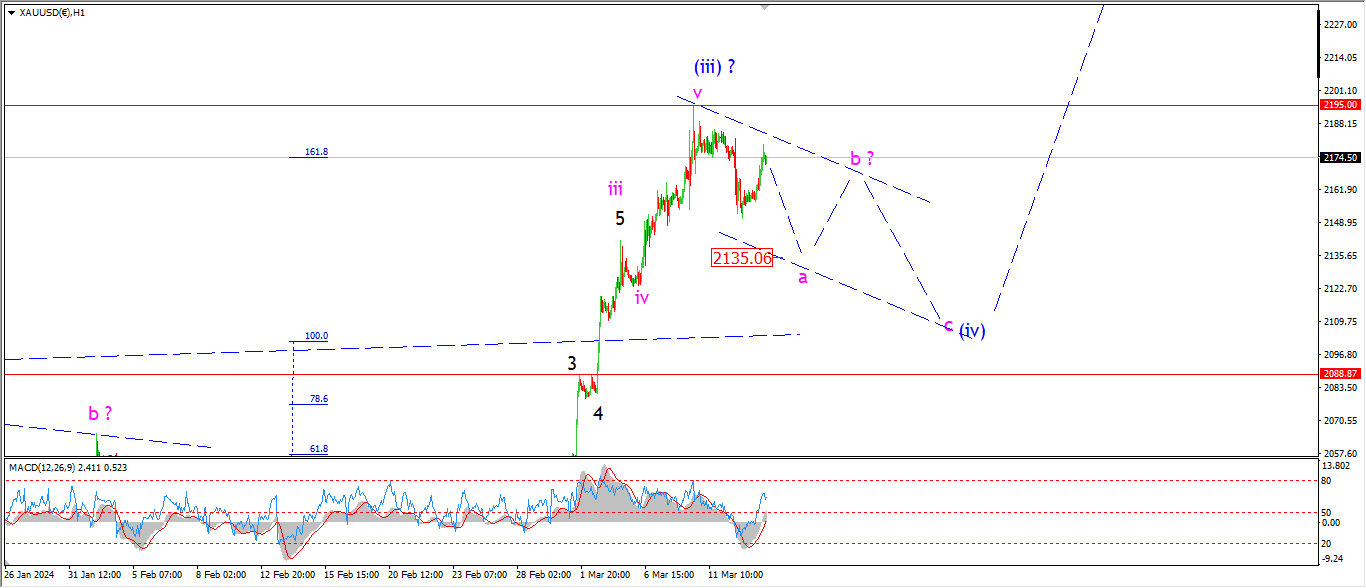
GOLD 1hr.
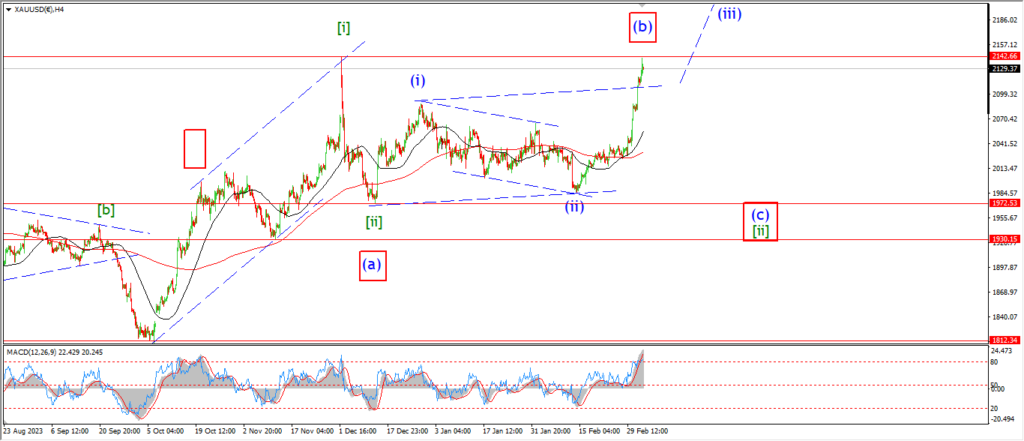
GOLD 4hr.
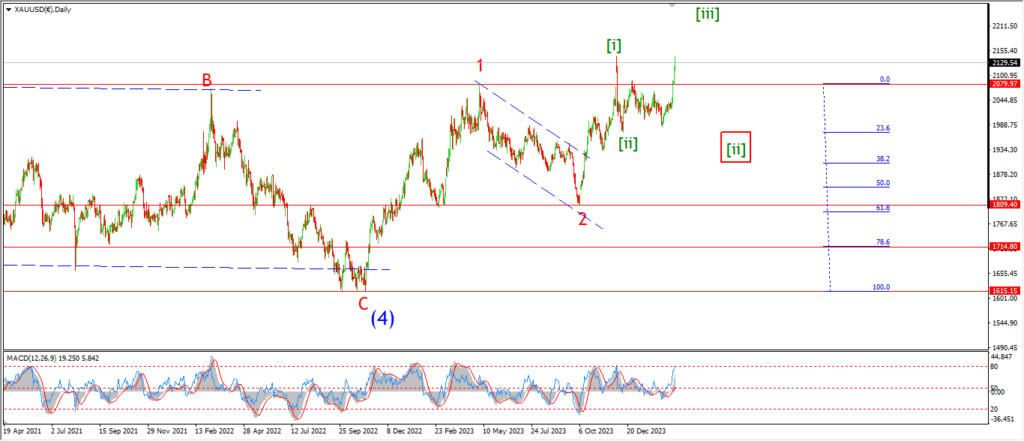
GOLD daily.
I am going to give more time this wave ‘a’ down to complete,
and if this idea is correct,
then wave ‘a’ can drag into Friday before we hit the final low.
Wave ‘b’ and ‘c’ will take all of next weeks action to complete,
so in all wave (iv) will take almost 2 weeks to finish.
That should be enough time to calm the sentiment enough to allow for another run higher into wave (v) of [iii].
Wave (v) has the potential to carry the price substantially higher so it will be worth the wait.
Tomorrow;
Watch for wave ‘a’ of (iv) to complete three waves down by the end of this week.
Wave ‘a’ should complete near 2135.
CRUDE OIL.
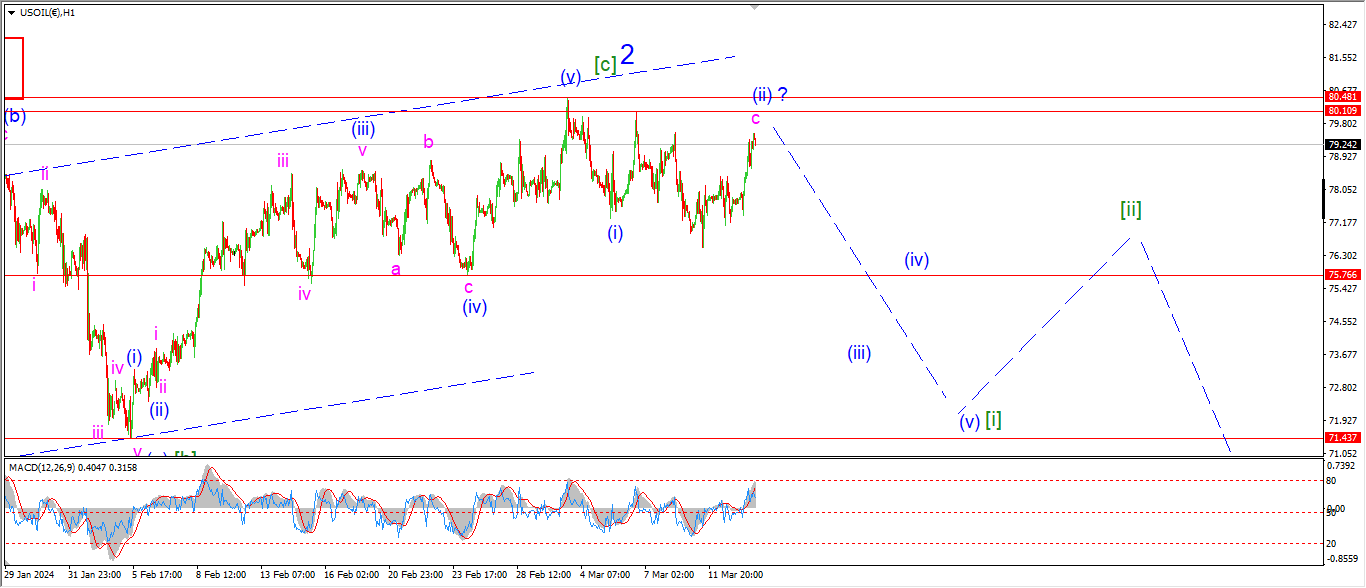
CRUDE OIL 1hr.
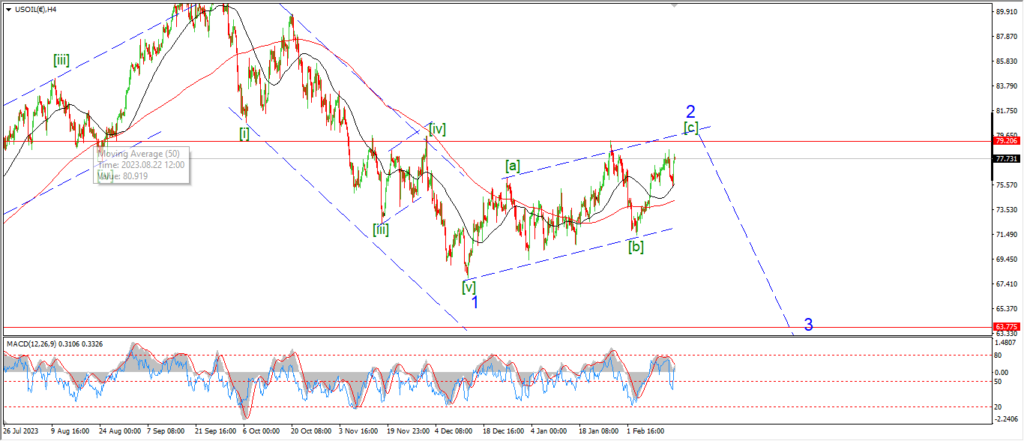
CRUDE OIL 4hr.
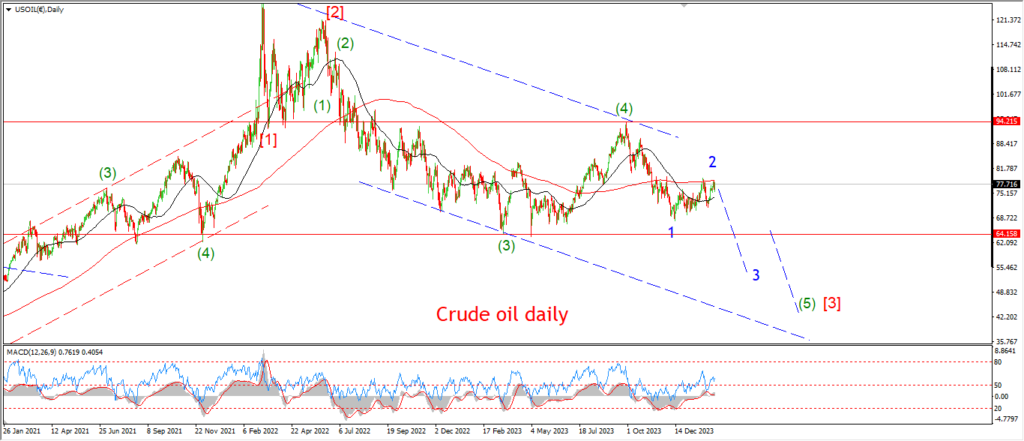
CRUDE OIL daily.
Crude has turned higher today which puts pressure on the main count here.
I am looking at a possible running flat correction in wave (ii) now as a possible explanation for todays rally,
in this scenario,
wave ‘c’ of (ii) will complete below 80.10,
and then wave (iii) down will take over and break the support at 75.76 this week.
That is the key level for this short term count now,
so the sooner that level breaks,
the better.
tomorrow;
Watch for wave (ii) to hold below the highs.
And wave (iii) down to begin early tomorrow with a sharp turn down into support at 75.76.
S&P 500.
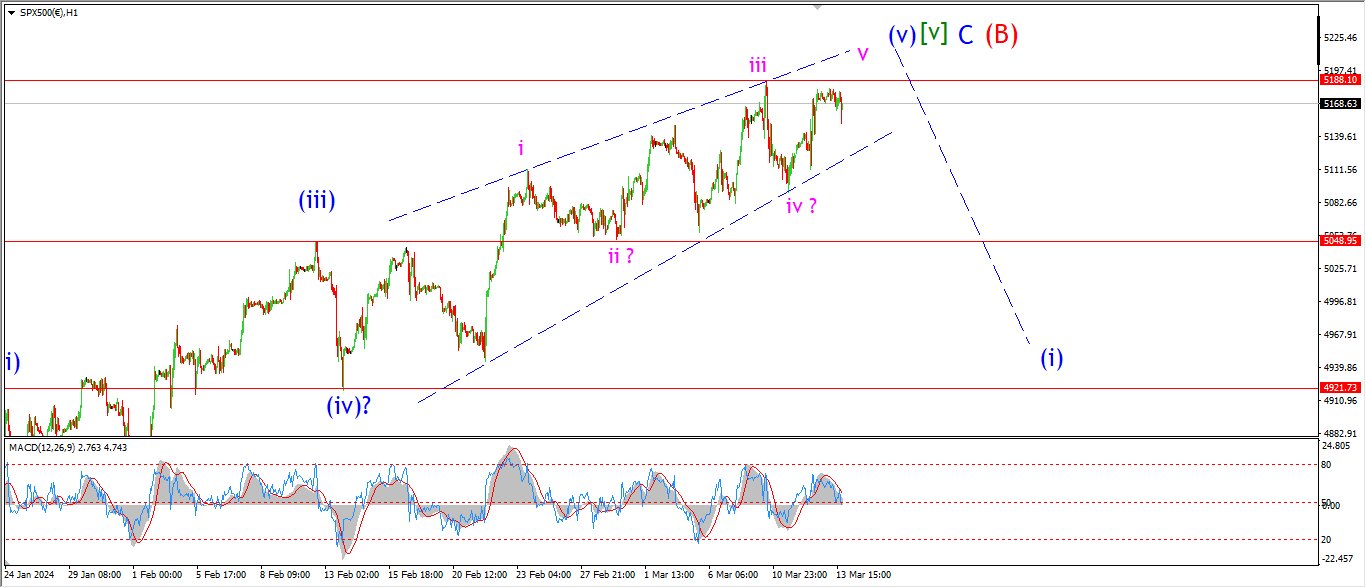
S&P 500 1hr
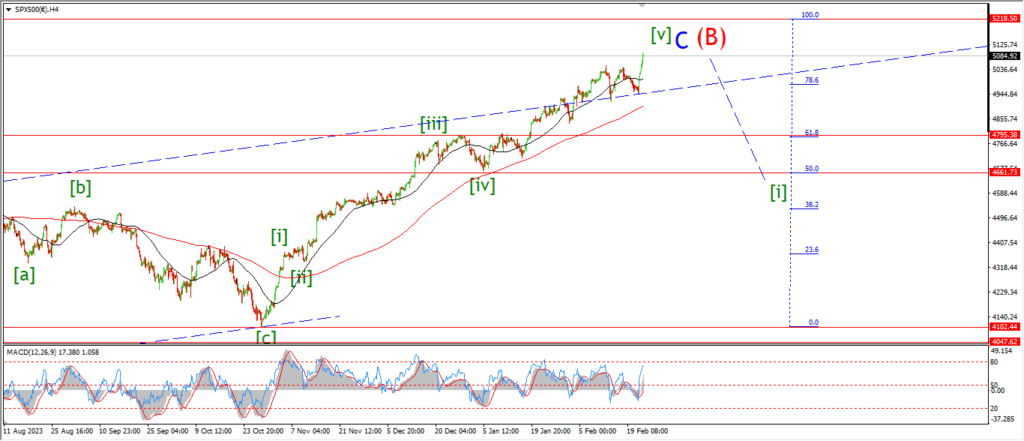
S&P 500 4hr
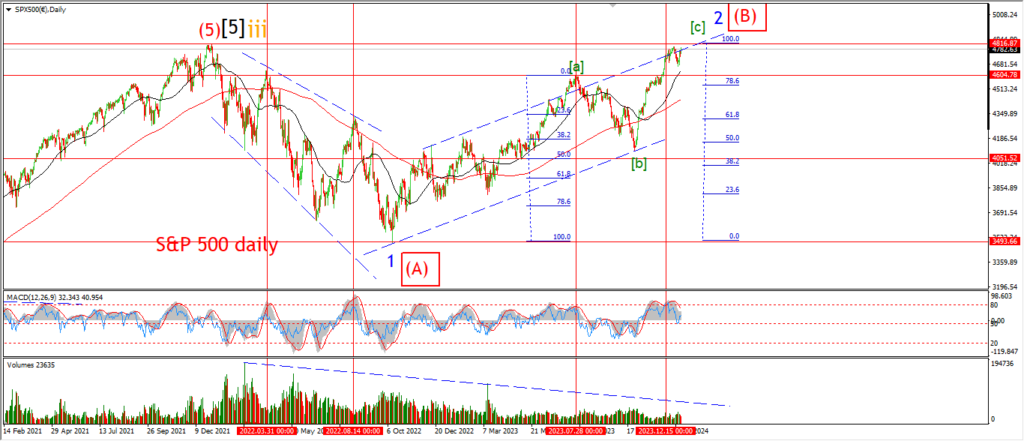
S&P 500 daily.
The S&P is very close again to hitting the minimum target for wave ‘v’ of (v) today.
the pattern in wave (v) still favors the wedge or ending diagonal idea.
And this pattern will require a new high to complete this week.
Once that happens,
then I can start to look for a top out scenario again.
Tomorrow;
Watch for wave ‘v’ of (v) to top with a new high.
Until that happens,
this pattern remains incomplete.
SILVER.
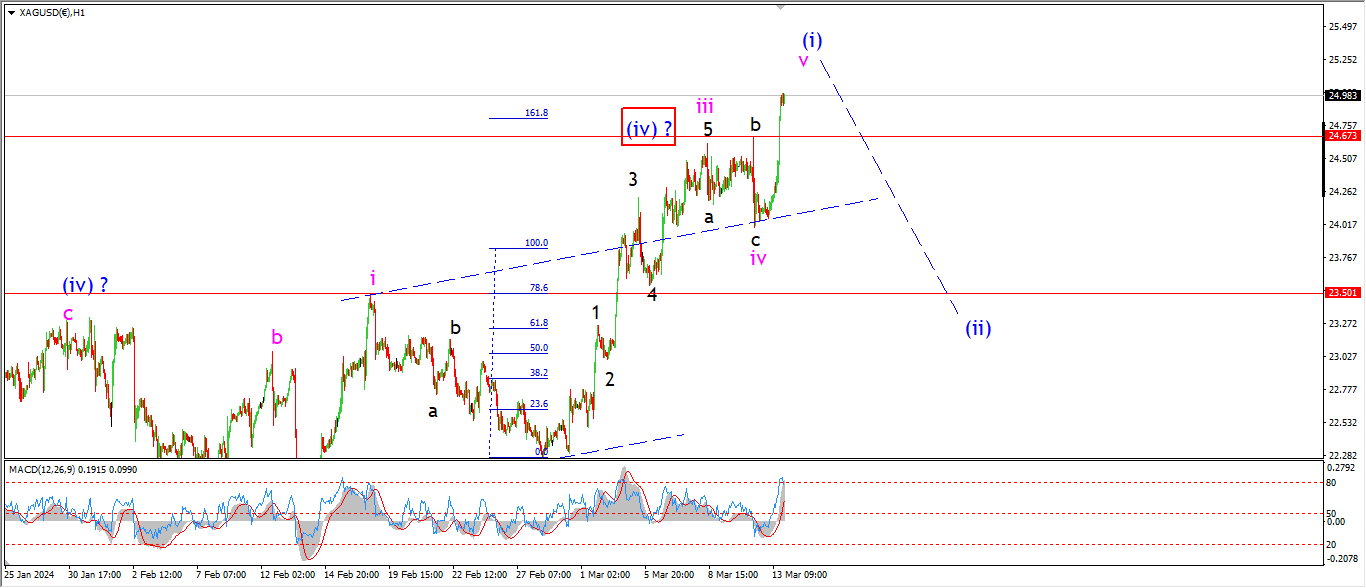
SILVER 1hr
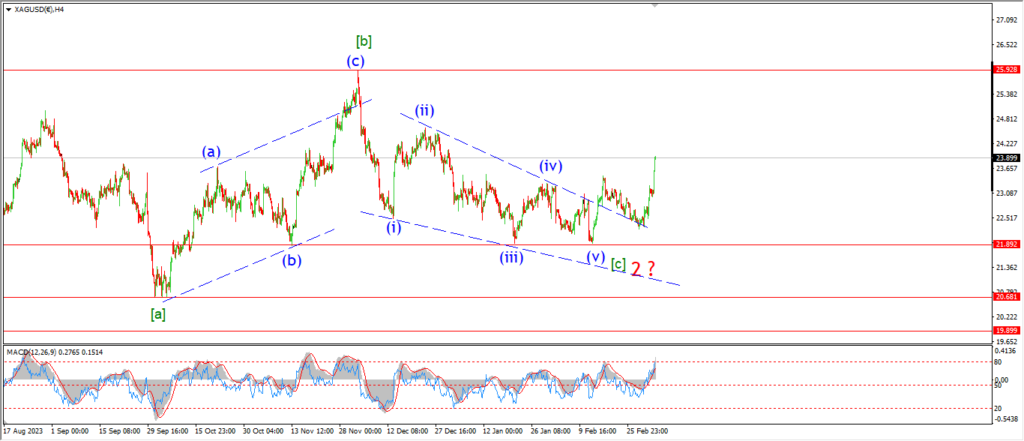
SILVER 4hr.
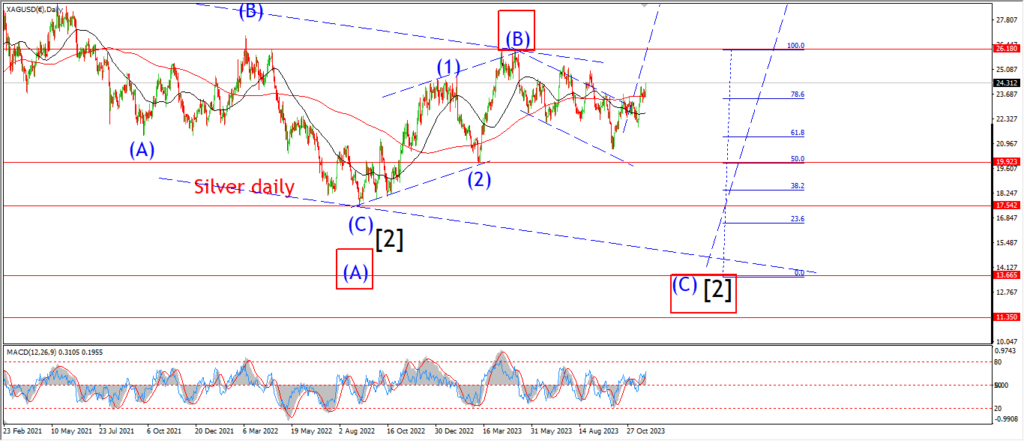
SILVER daily.
Silver has moved into wave ‘v’ quicker than expected today.
the price completed a smaller wave ‘iv’ at Tuesdays lows,
and now today the price has rallied to a new high for this pattern in wave ‘v’ of (i) today.
This pattern does suggest that silver will hit a brick wall soon as wave (i) tops out,
then we can expect the retracement into wave (ii) to begin next week.
Tomorrow;
Watch for wave ‘v’ of (i) complete this week.
BITCOIN
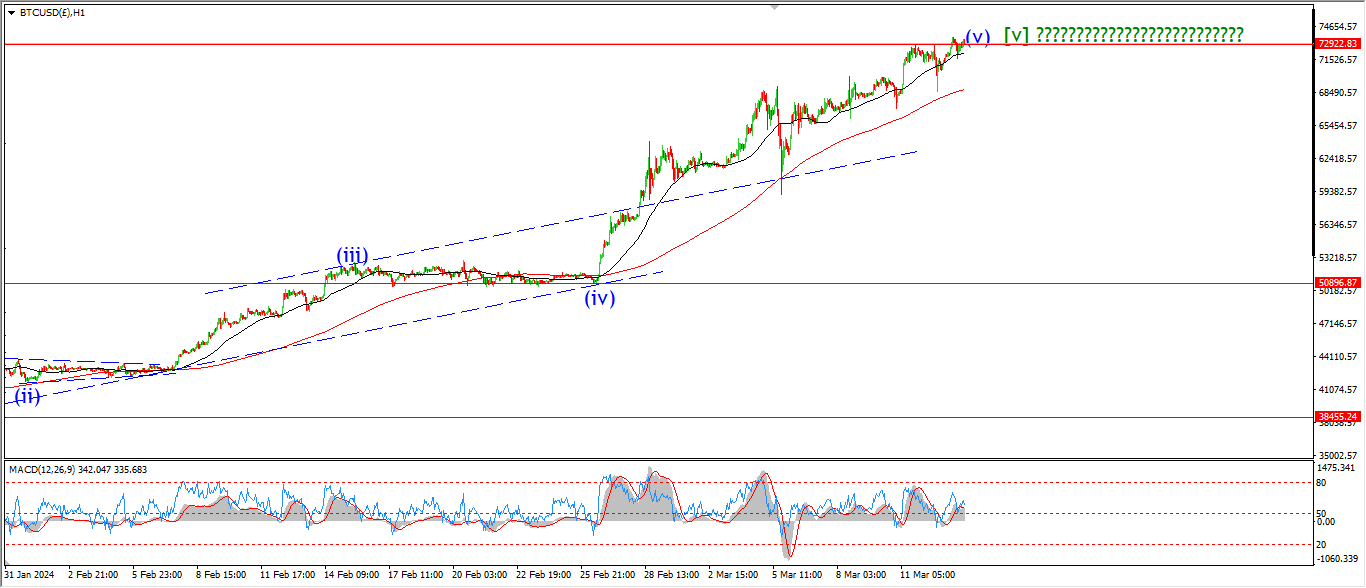
BITCOIN 1hr.
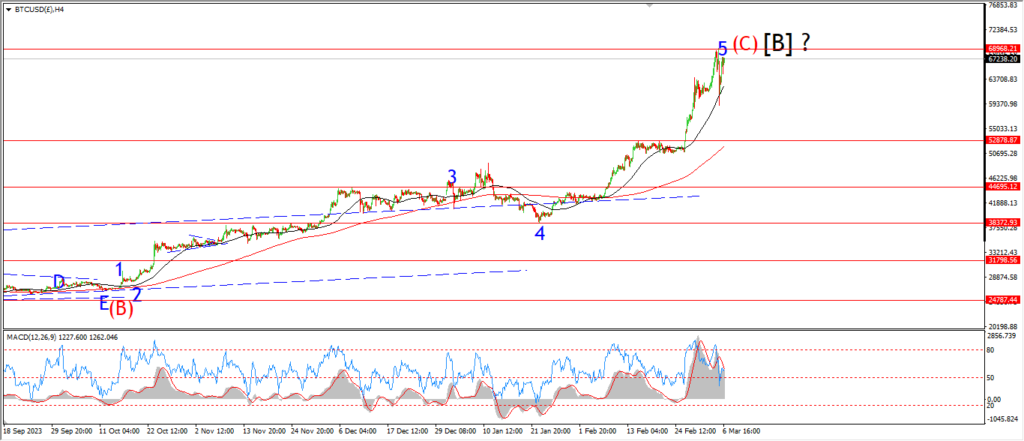
BITCOIN 4hr.
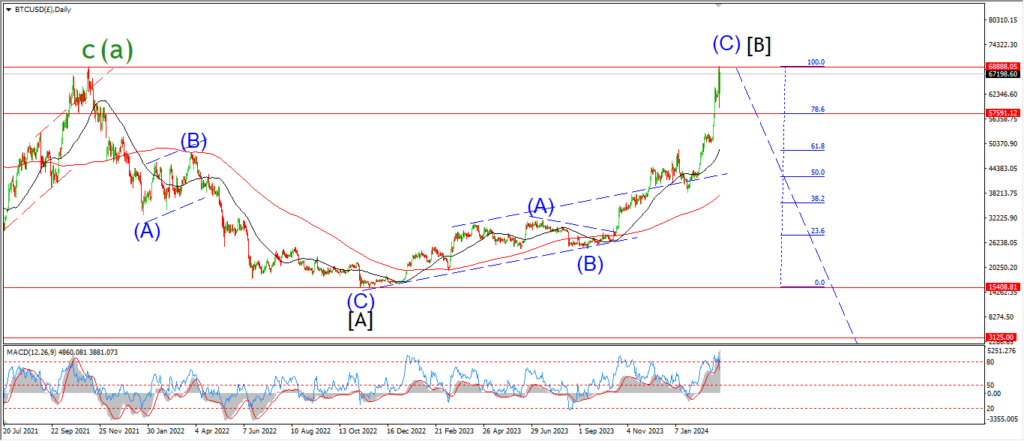
BITCOIN daily.
….
FTSE 100.
FTSE 100 1hr.

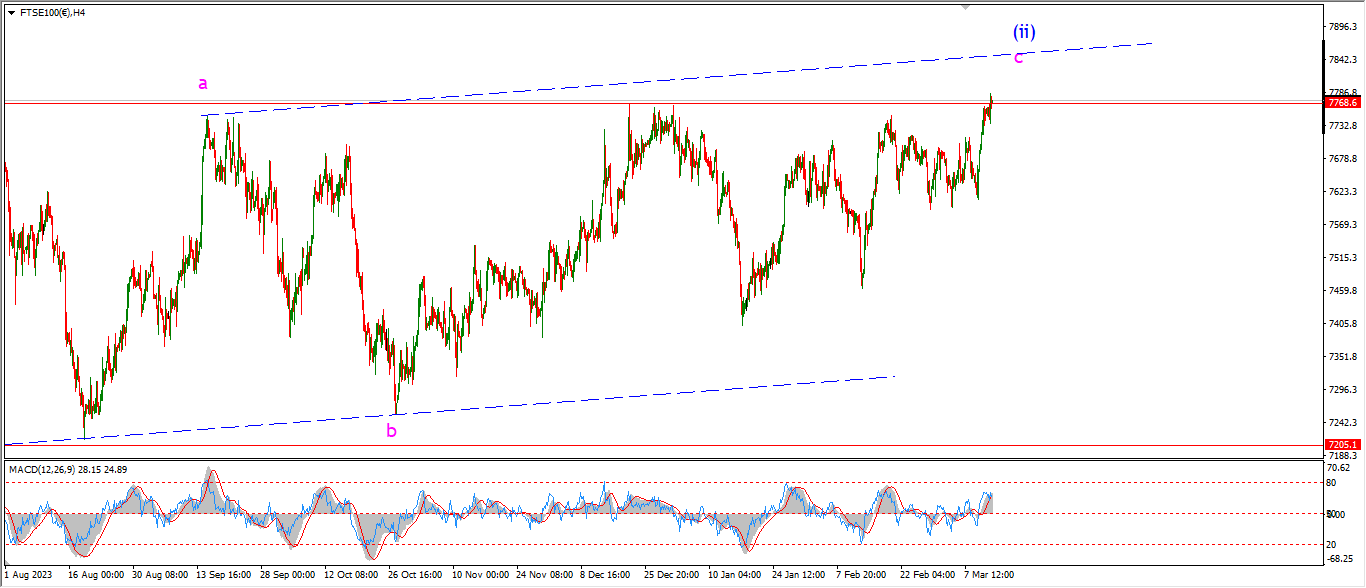
FTSE 100 4hr.

FTSE 100 daily.
….
DAX.
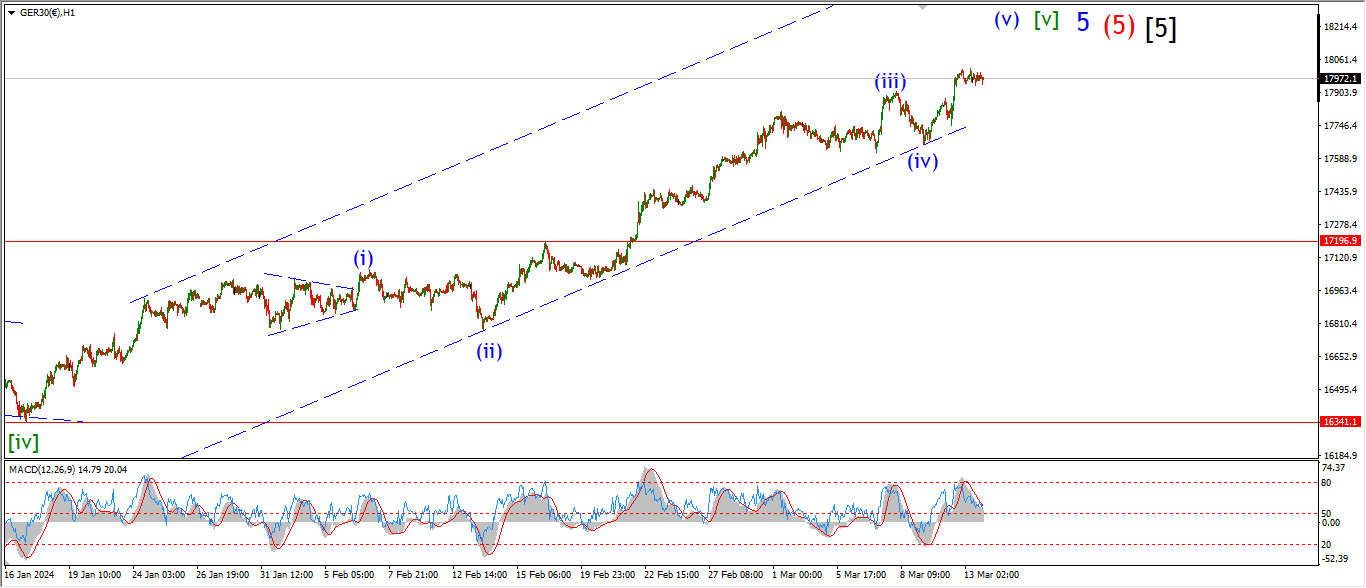
DAX 1hr
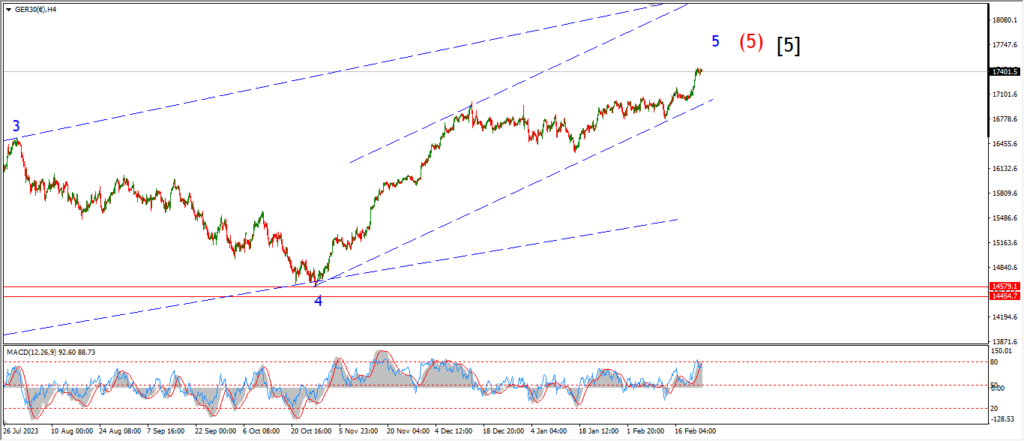
DAX 4hr

DAX daily.
….
NASDAQ 100.
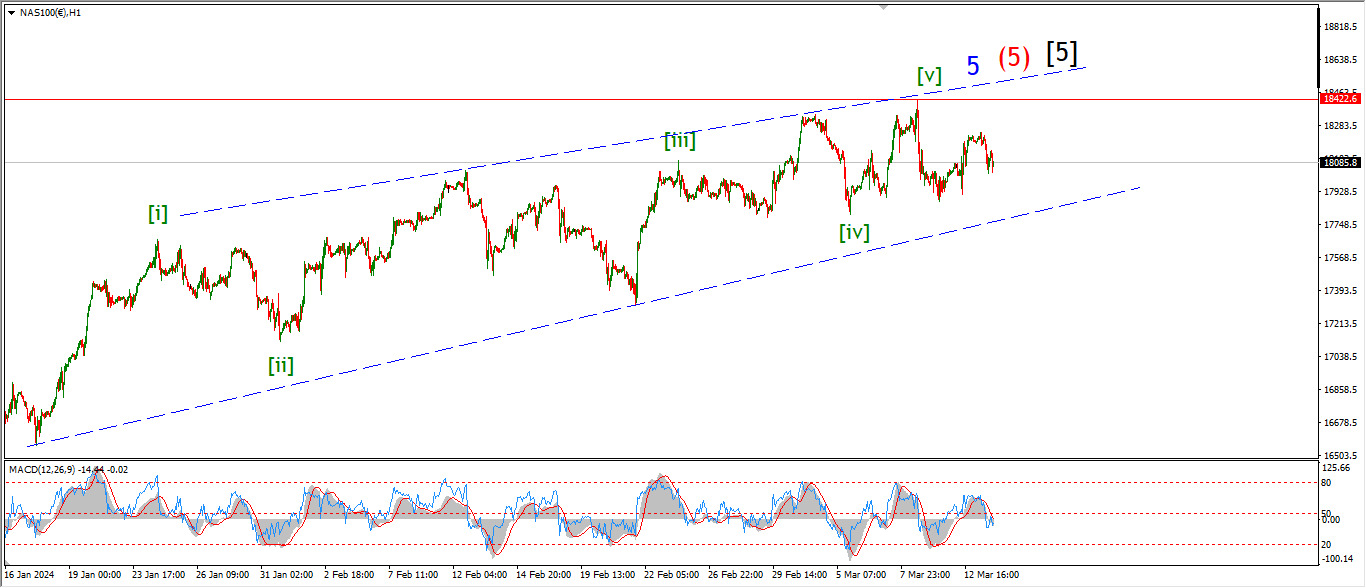
NASDAQ 1hr
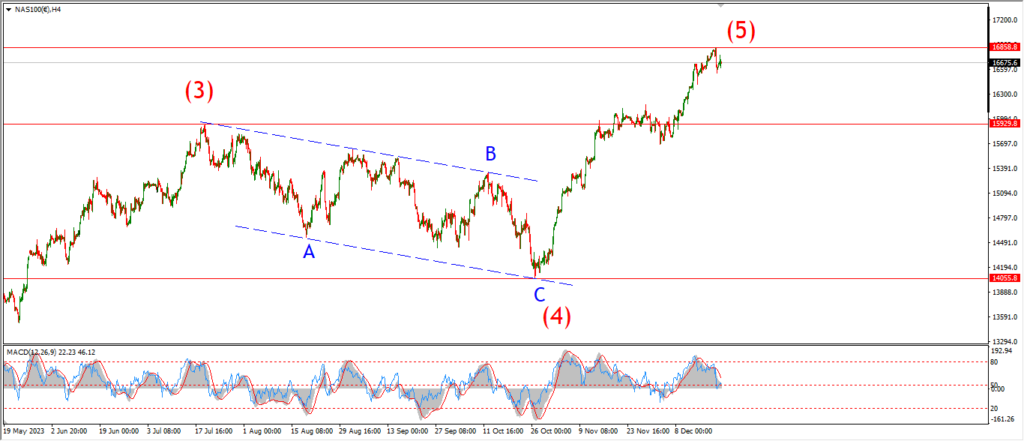
NASDAQ 4hr.
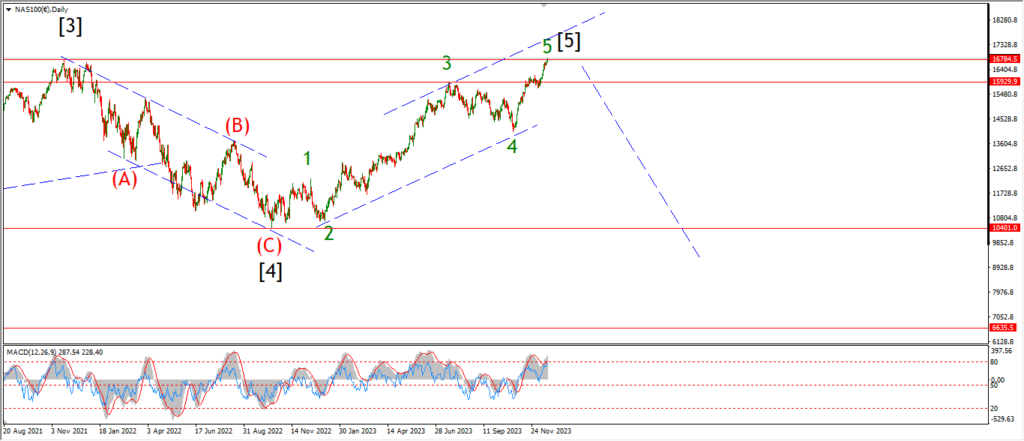
NASDAQ daily.
….