
[vc_row][vc_column][vc_separator border_width=”5″][/vc_column][/vc_row]
[vc_row][vc_column][vc_column_text]
Hi there all.
I watched this presentation by Jeff Gundalach at the Barrons conference recently.
And boy did he tear a hole in the idea that this is a safe market to be invested in!
He speaks in some depth about the miss-pricing and the miss-rating going on the the corporate bond market.
According to a study b Morgan Stanley,
If the corporate bond market were rated correctly right now,
55% of the whole $3 trillion market would be rated junk!
Gundalach says that the corporate bond market now,
is in a similar position to the mortgage securities market in 2007.
tick tick tick tick………..
But of course this problem is contained, its not a big issue, and all of the other excuses that can be rolled out.
We all should have affairs in order because this problem is actually far bigger than the mortgage securities problem was in 2007.
Just imagine the size of the derivative market on the back of the corporate bond market!
Here we go.
[/vc_column_text][/vc_column][/vc_row]
[_s2If current_user_can(access_s2member_ccap_eurusd)]
[vc_row][vc_column][vc_separator border_width=”5″][/vc_column][/vc_row]
[vc_row][vc_column][vc_column_text]
EURUSD
[/vc_column_text][/vc_column][/vc_row]
[vc_row][vc_column][vc_separator border_width=”5″][/vc_column][/vc_row][vc_row][vc_column width=”2/3″][vc_custom_heading text=”1 hr” use_theme_fonts=”yes”][vc_column_text]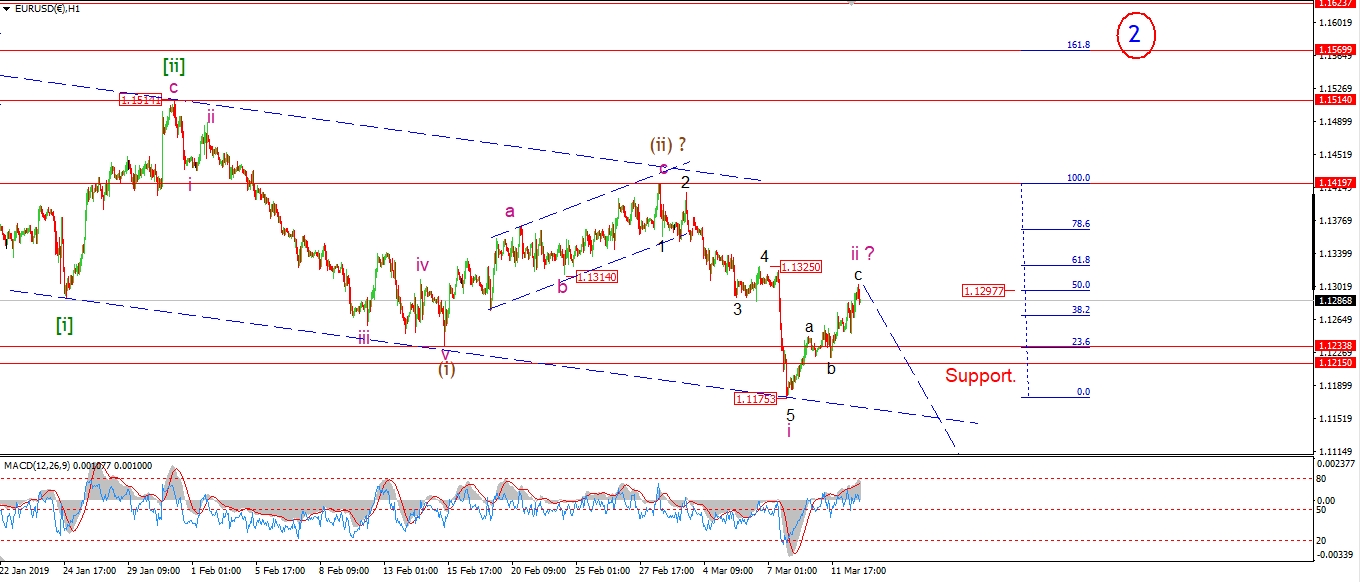 [/vc_column_text][/vc_column][vc_column width=”1/3″][vc_custom_heading text=”4 Hours” use_theme_fonts=”yes”][vc_column_text]
 [/vc_column_text][vc_custom_heading text=”Daily” use_theme_fonts=”yes”][vc_column_text]
 [/vc_column_text][/vc_column][/vc_row]
[vc_row][vc_column][vc_column_text]
Wave ‘c’ of ‘ii’ is tracking higher today to complete a three wave correction.
We are now back into the target area of the previous fourth wave,
and the 50% retracement level at 1.1297.
These factors suggest that wave ‘ii’ is near to completion.
I am acutely aware of the level of bearishness against the Euro at the moment,
and that is why I am keeping that alternate wave ‘2’ scenario in view.
But so long as the wave structure points lower,
then I am bearish into large degree wave ‘3’ down.
Tomorrow;
Watch for wave ‘ii’ to complete and then turn lower again into support.
Wave ‘iii’ of (iii) will be confirmed with a break of 1.1175.
[/vc_column_text][/vc_column][/vc_row]
[/_s2If]
[_s2If current_user_can(access_s2member_ccap_gbpusd)]
[vc_row][vc_column][vc_separator border_width=”5″][/vc_column][/vc_row][vc_row][vc_column][vc_column_text]
GBPUSD
[/vc_column_text][/vc_column][/vc_row][vc_row][vc_column][vc_separator border_width=”5″][/vc_column][/vc_row][vc_row][vc_column width=”2/3″][vc_custom_heading text=”1 hr” use_theme_fonts=”yes”][vc_column_text]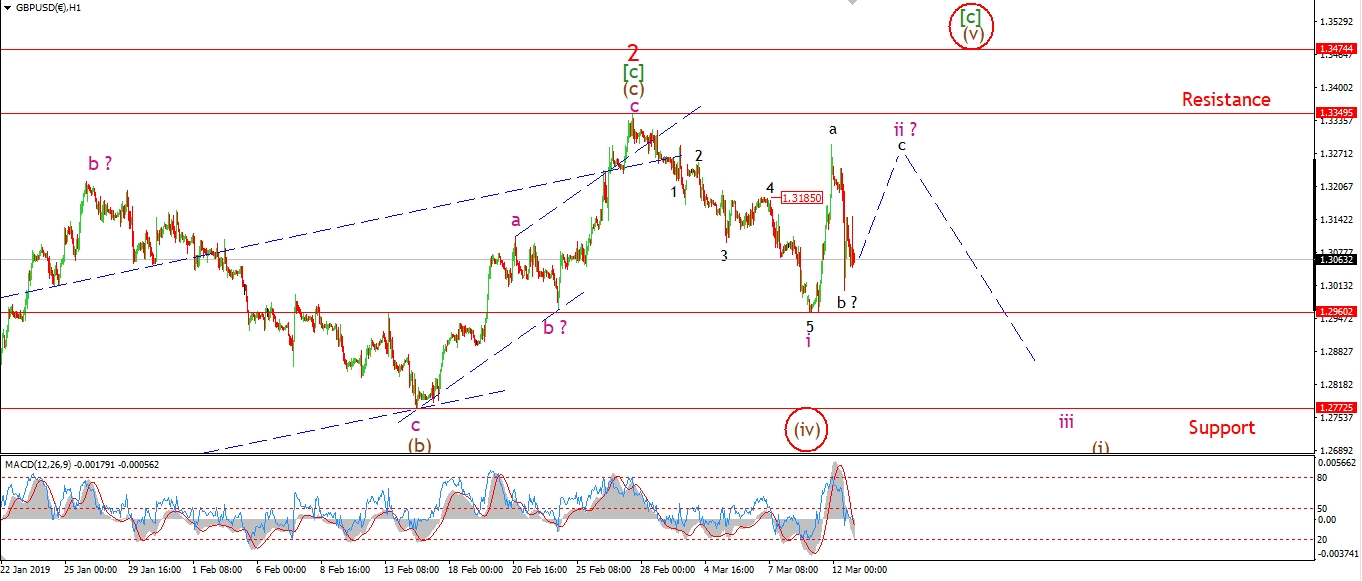 [/vc_column_text][/vc_column][vc_column width=”1/3″][vc_custom_heading text=”4 Hours” use_theme_fonts=”yes”][vc_column_text]
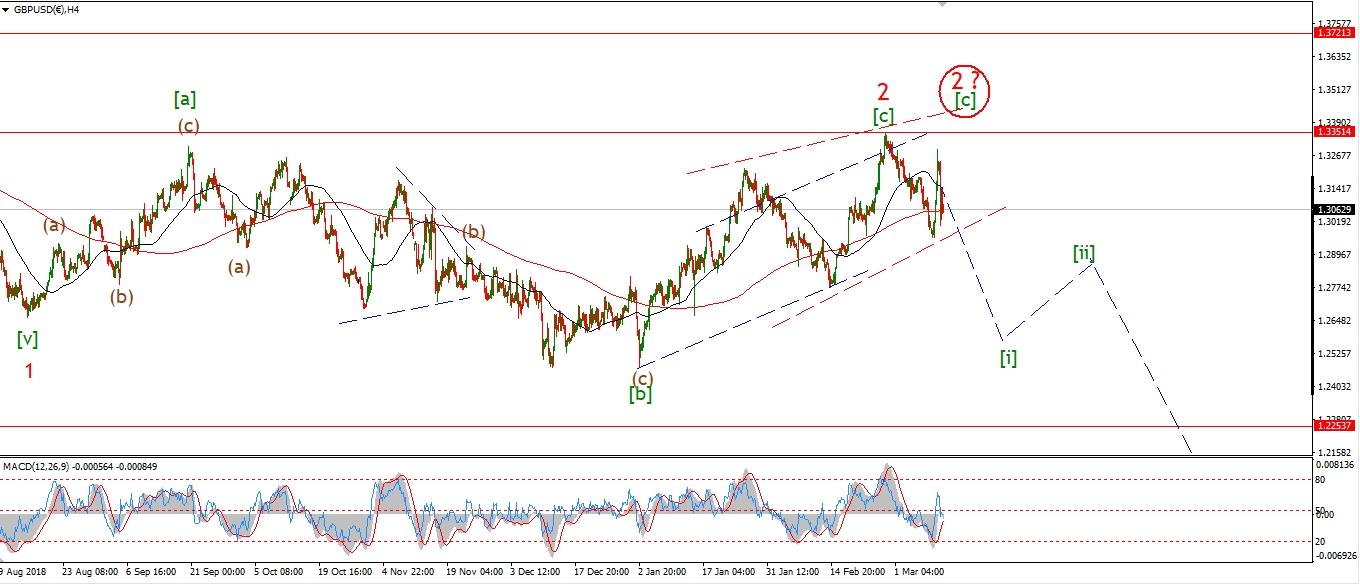 [/vc_column_text][vc_custom_heading text=”Daily” use_theme_fonts=”yes”][vc_column_text]
 [/vc_column_text][/vc_column][/vc_row]
[vc_row][vc_column][vc_column_text]
I want to start on the 4hr chart tonight.
The market action in cable has been wild over the last few sessions!
So with that in mind,
I am looking at a possible alternate for wave [c] of ‘2’.
I have shown a possible ending diagonal higher in wave [c] as the alternate count on the 4hr chart.
An ending diagonal will be in five internal subdivisions.
Each subdivision will be in three waves.
If the price breaks 1.3350 again this week,
that will trigger this interpretation.
Even so,
the alternate count is nearing completion again in three waves
as shown on the hourly chart.
Tomorrow;
If wave ‘ii’ is to remain valid,
Then 1.3349 must not break.
Watch for wave ‘c’ of ‘ii’ to complete and wave ‘iii’ down to begin.
A break of 1.2960 will confirm wave ‘iii’.
[/vc_column_text][/vc_column][/vc_row]
[/_s2If]
[_s2If current_user_can(access_s2member_ccap_usdjpy)]
[vc_row][vc_column][vc_separator border_width=”5″][/vc_column][/vc_row][vc_row][vc_column][vc_column_text]
USDJPY
[/vc_column_text][/vc_column][/vc_row][vc_row][vc_column][vc_separator border_width=”5″][/vc_column][/vc_row][vc_row][vc_column width=”2/3″][vc_custom_heading text=”1 hr” use_theme_fonts=”yes”][vc_column_text]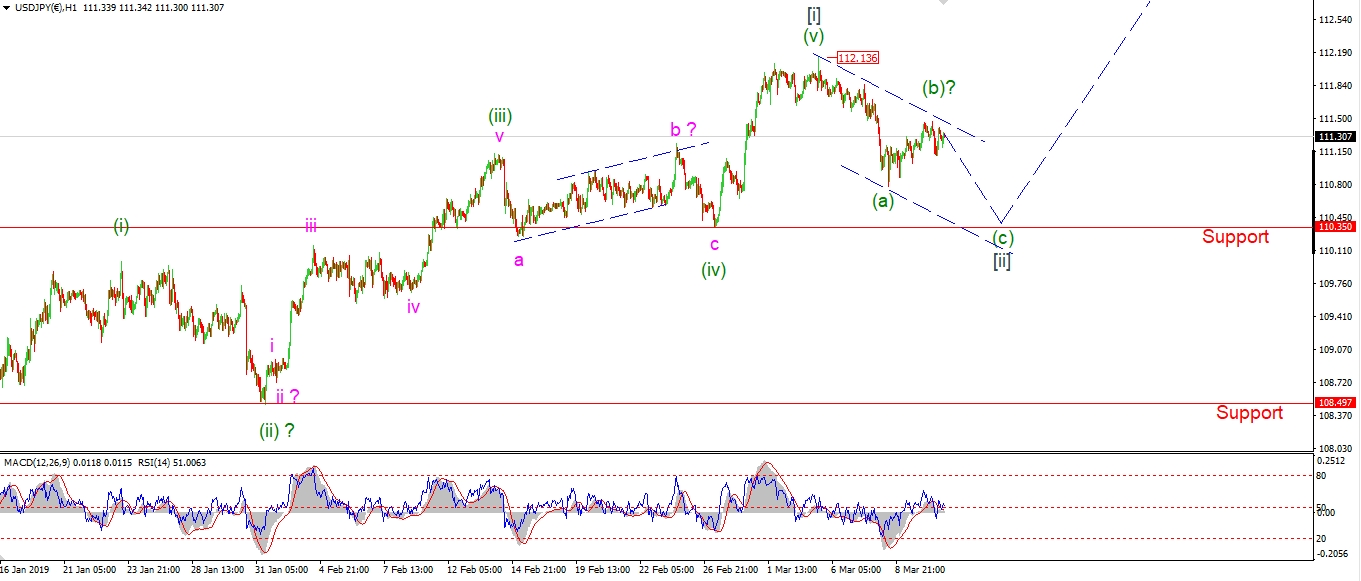 [/vc_column_text][/vc_column][vc_column width=”1/3″][vc_custom_heading text=”4 Hours” use_theme_fonts=”yes”][vc_column_text]
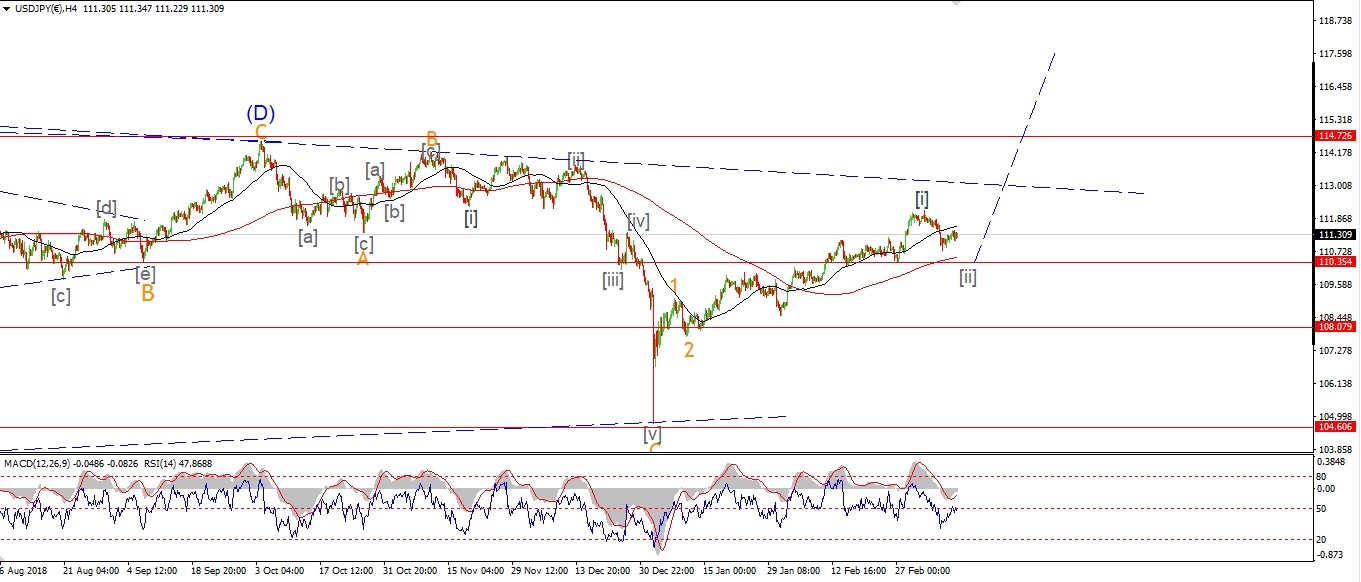 [/vc_column_text][vc_custom_heading text=”Daily” use_theme_fonts=”yes”][vc_column_text]
 [/vc_column_text][/vc_column][/vc_row]
[vc_row][vc_column][vc_column_text]
A new count for USDJPY today!
The overall thesis does not change one bit.
I still expect USDJPY to rally for the rest of the year in a large degree wave [C] higher.
But the short term action is very corrective looking over the last couple of sessions.
I think we have seen the high of wave [i] of ‘3’ at recent high of 112.13.
The market is now falling in three waves in wave [ii].
with the choppy upside action this week taking the wave (b) label.
Tomorrow;
Watch for wave (c) of [ii] to drop into the previous fourth wave low
at about 110.30 again before completing wave [ii].
Wave [iii] up should then begin.
[/vc_column_text][/vc_column][/vc_row]
[/_s2If]
[_s2If current_user_can(access_s2member_ccap_dow_jones)]
[vc_row][vc_column][vc_separator border_width=”5″][/vc_column][/vc_row][vc_row][vc_column][vc_column_text]
DOW JONES INDUSTRIALS
[/vc_column_text][/vc_column][/vc_row][vc_row][vc_column][vc_separator border_width=”5″][/vc_column][/vc_row][vc_row][vc_column width=”2/3″][vc_custom_heading text=”1 hr” use_theme_fonts=”yes”][vc_column_text]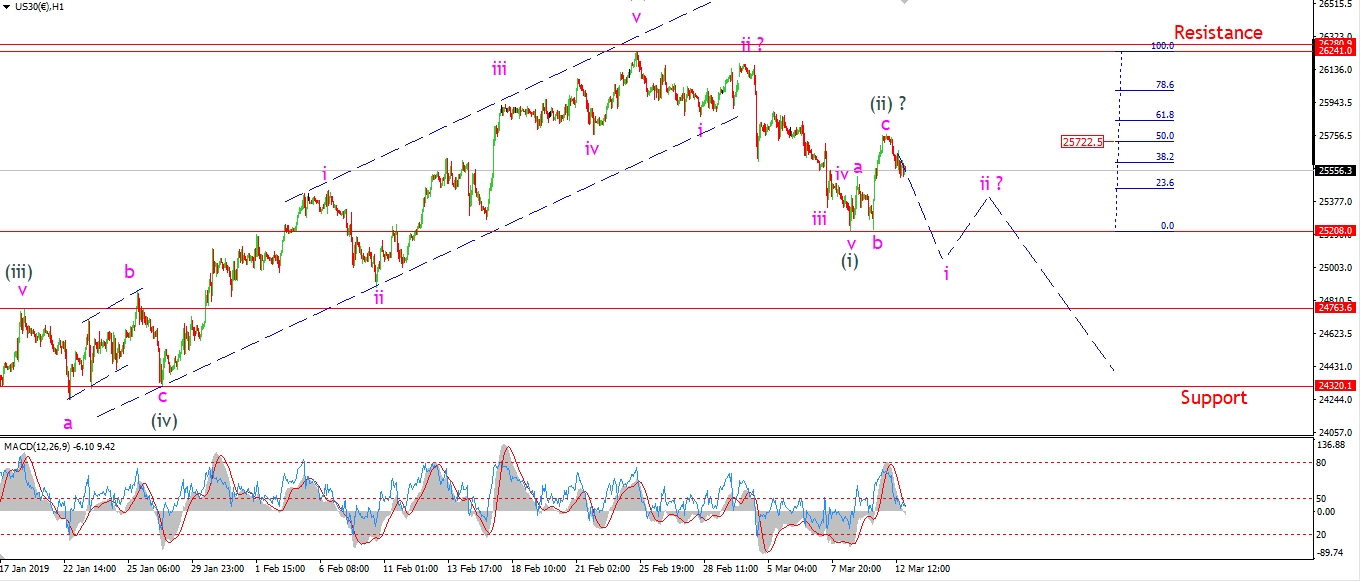 [/vc_column_text][/vc_column][vc_column width=”1/3″][vc_custom_heading text=”4 Hours” use_theme_fonts=”yes”][vc_column_text]
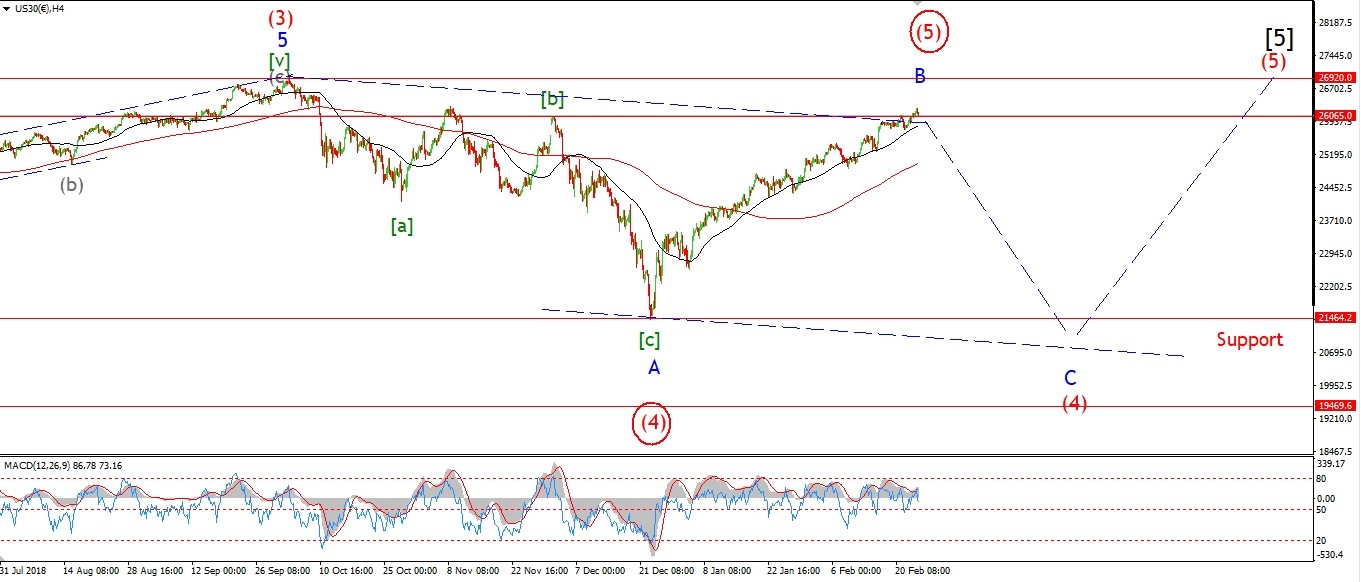 [/vc_column_text][vc_custom_heading text=”Daily” use_theme_fonts=”yes”][vc_column_text]
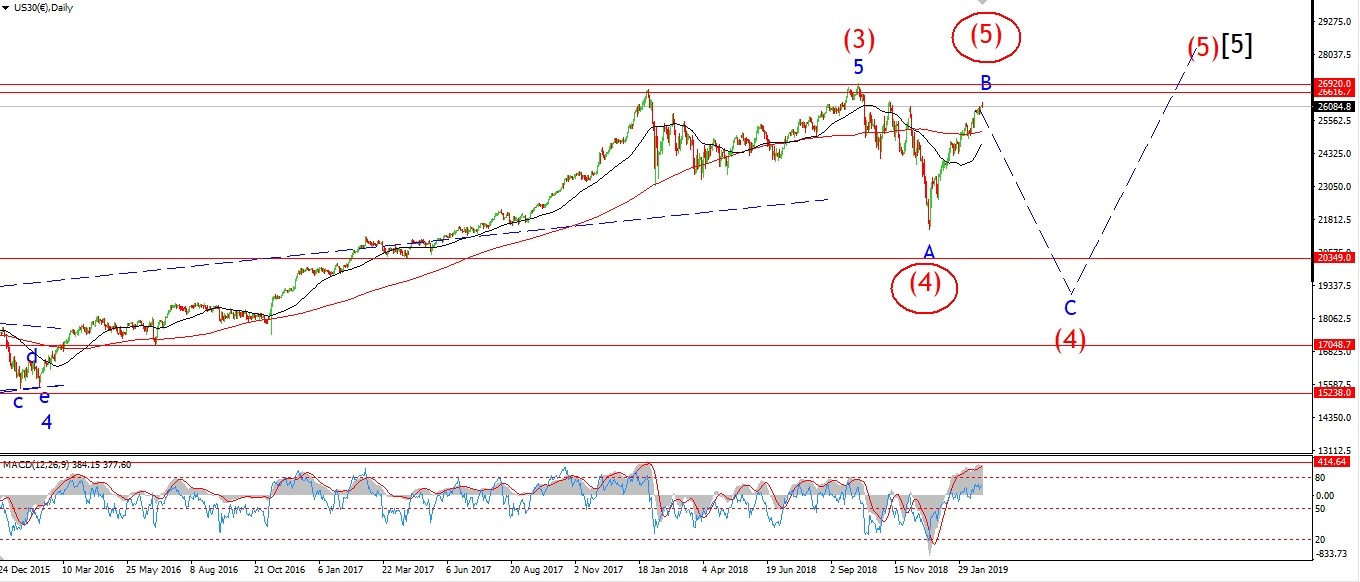 [/vc_column_text][/vc_column][/vc_row]
[vc_row][vc_column][vc_column_text]
The DOW is off the highs this evening after retracing a little over 50% of the recent decline.
I am interpreting this rally as a second wave correction to a lower high.
The short term pattern has been altered slightly this evening.
Mondays rally is viewed as wave ‘c’ of (ii) in an upwards expanded flat correction.
The price must now return lower in an impulsive wave as shown,
and break the recent low at wave (i)
This will confirm that wave (iii) down has begun.
If that happens,
wave (iii) down should carry into support at 24300 at the previous fourth wave.
Tomorrow;
Watch for wave ‘i’ of (iii) to continue lower and break 25208.
[/vc_column_text][/vc_column][/vc_row]
[/_s2If]
[_s2If current_user_can(access_s2member_ccap_gold)]
[vc_row][vc_column][vc_separator border_width=”5″][/vc_column][/vc_row][vc_row][vc_column][vc_column_text]
GOLD
[/vc_column_text][/vc_column][/vc_row][vc_row][vc_column][vc_separator border_width=”5″][/vc_column][/vc_row][vc_row][vc_column width=”2/3″][vc_custom_heading text=”1 hr” use_theme_fonts=”yes”][vc_column_text]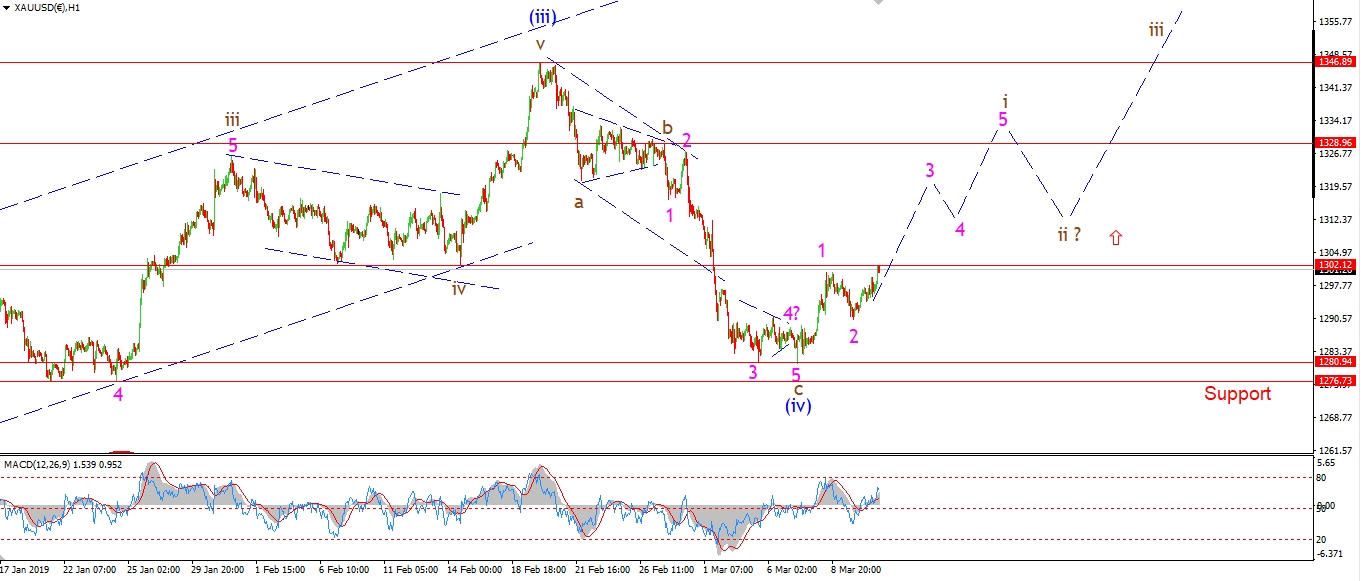 [/vc_column_text][/vc_column][vc_column width=”1/3″][vc_custom_heading text=”4 Hours” use_theme_fonts=”yes”][vc_column_text]
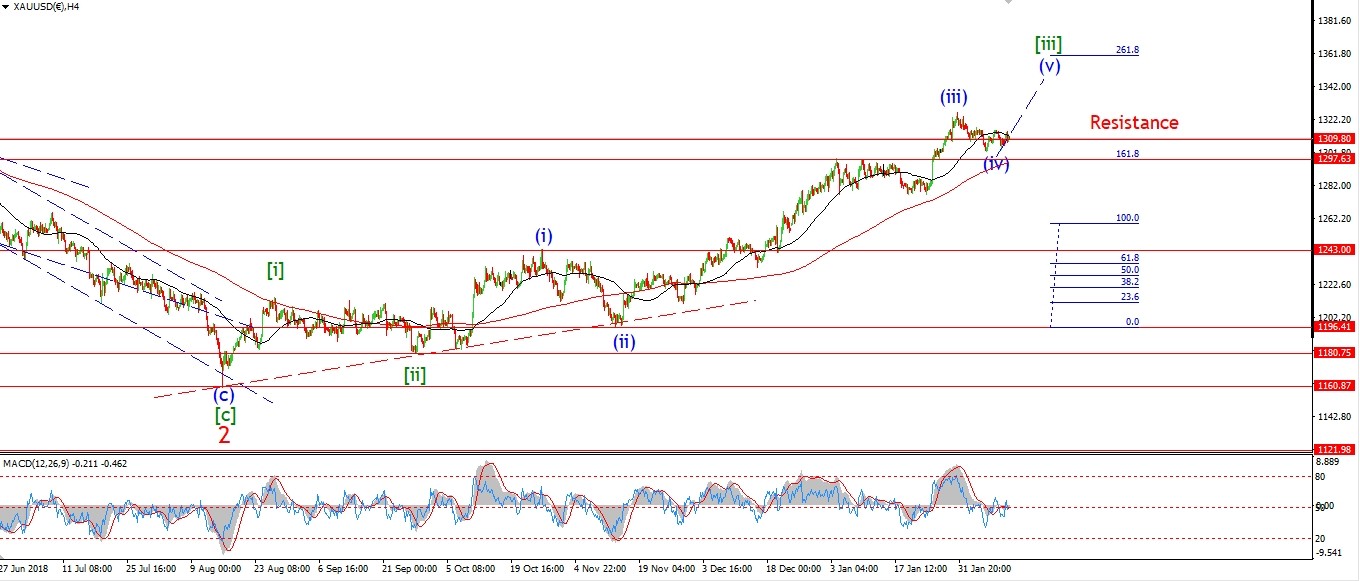 [/vc_column_text][vc_custom_heading text=”Daily” use_theme_fonts=”yes”][vc_column_text]
 [/vc_column_text][/vc_column][/vc_row]
[vc_row][vc_column][vc_column_text]
Gold is heading higher today,
but so far the rise is a bit subdued.
The wave count has not changed today,
I still expect that wave (v) should carry higher over the coning weeks,
but the rally off the wave (iv) low is not very impressive just yet!
Tomorrow;
This rise today may be the initial first wave within wave ‘3’ of ‘i’.
If so,
wave ‘3’ should continue hgier tomorrow and push back above 1310 again.
The wave ‘2’ low came in at 1290.
watch for that level to hold and wave ‘3’ to pick up the pace higher.
[/vc_column_text][/vc_column][/vc_row]
[/_s2If]
[_s2If current_user_can(access_s2member_ccap_crude)]
[vc_row][vc_column][vc_separator border_width=”5″][/vc_column][/vc_row][vc_row][vc_column][vc_column_text]
U.S CRUDE OIL
[/vc_column_text][/vc_column][/vc_row][vc_row][vc_column][vc_separator border_width=”5″][/vc_column][/vc_row][vc_row][vc_column width=”2/3″][vc_custom_heading text=”1 hr” use_theme_fonts=”yes”][vc_column_text]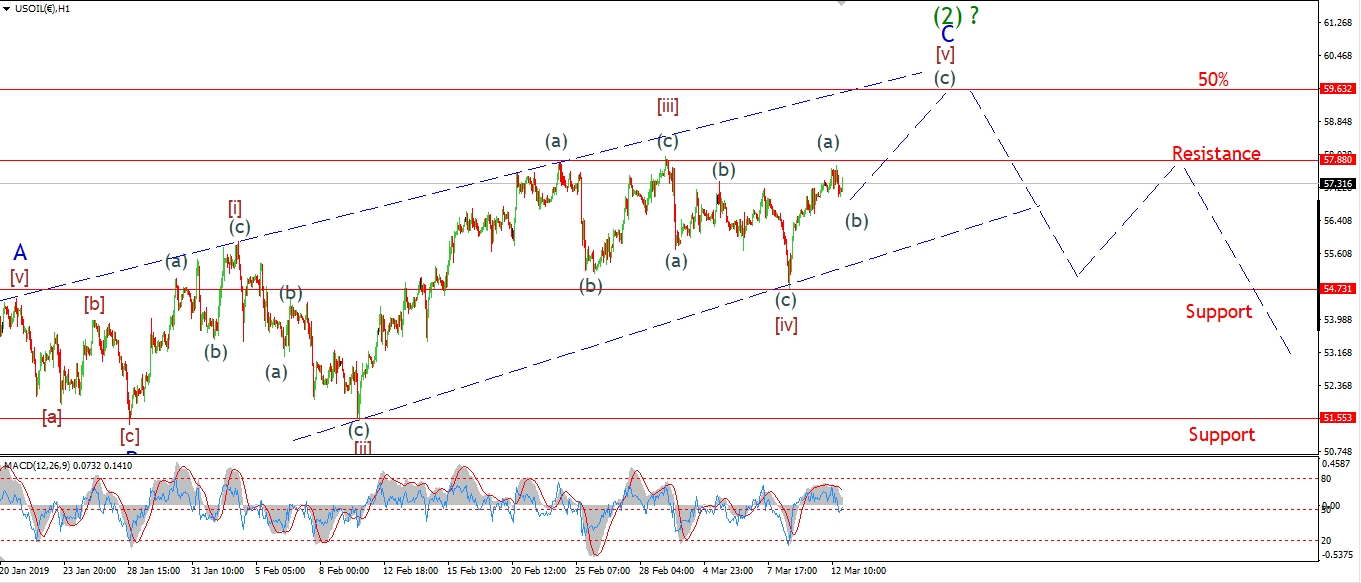 [/vc_column_text][/vc_column][vc_column width=”1/3″][vc_custom_heading text=”4 Hours” use_theme_fonts=”yes”][vc_column_text]
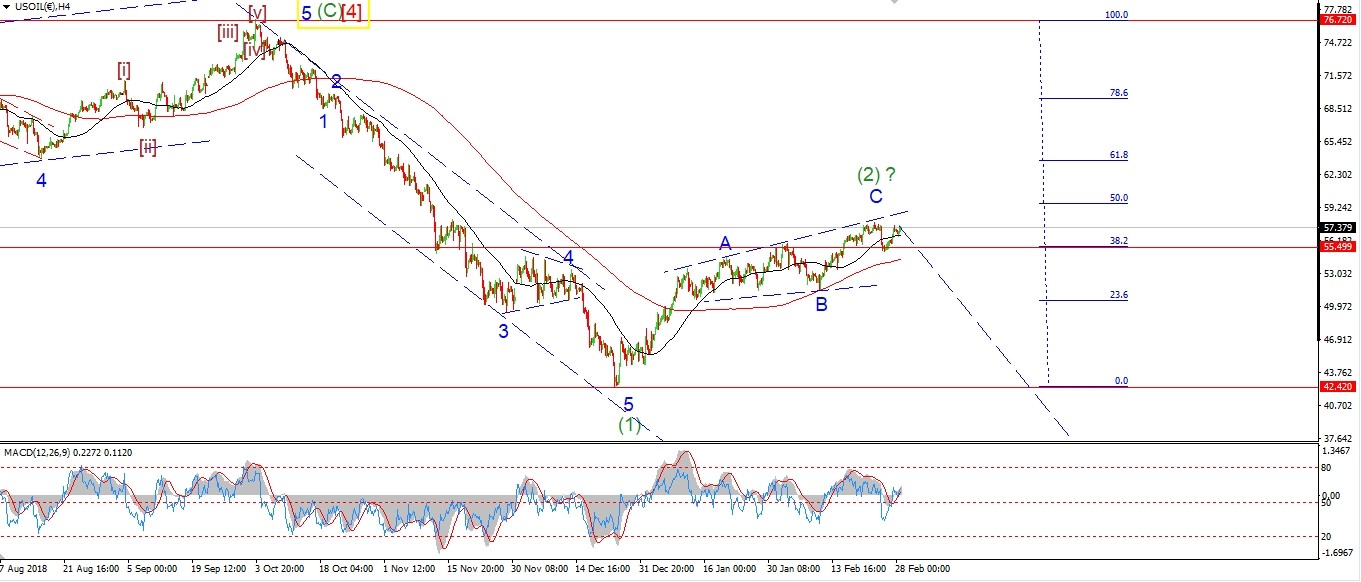 [/vc_column_text][vc_custom_heading text=”Daily” use_theme_fonts=”yes”][vc_column_text]
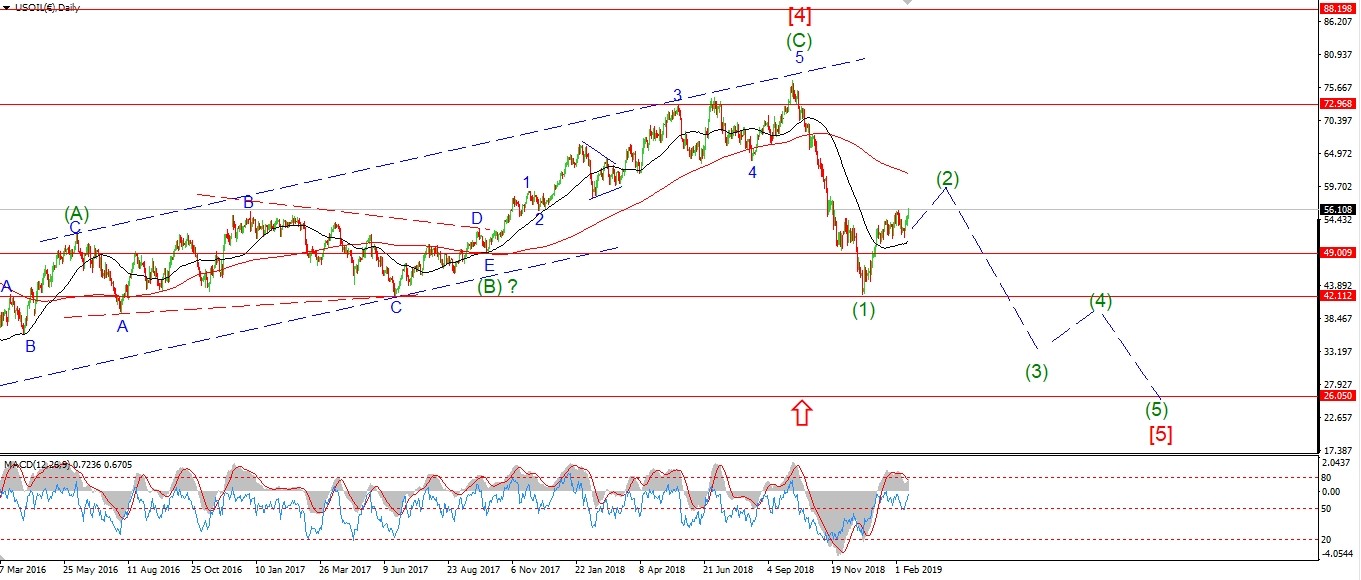 [/vc_column_text][/vc_column][/vc_row]
[vc_row][vc_column][vc_column_text]
Just when you think that crude is going to impress to the upside,
you get a dead day like today!
I update the wave count last night without updating the internal labeling.
Forgive me!
If this rally in wave ‘C’ is an ending diagonal.
Then each internal move will be in three waves.
So,
The sharp rise off the recent low is now labelled wave (a) of [v].
Todays action is viewed as wave (b).
Wave (b) should be in three waves,
so we should see another push lower early tomorrow to do just that.
Then wave (c) if [v] should rally into the target area
at the 50% retracement level at 59.60.
This will complete the whole correction in wave (2).
Tomorrow;
Watch for wave (b) to complete a higher low again, and wave (c) to begin.
[/vc_column_text][/vc_column][/vc_row]
[/_s2If]
[_s2If current_user_can(access_s2member_ccap_us10yr)]
[vc_row][vc_column][vc_separator border_width=”5″][/vc_column][/vc_row][vc_row][vc_column][vc_column_text]
US 10 yr Treasuries.
[/vc_column_text][/vc_column][/vc_row][vc_row][vc_column][vc_separator border_width=”5″][/vc_column][/vc_row][vc_row][vc_column width=”2/3″][vc_custom_heading text=”1 hr” use_theme_fonts=”yes”][vc_column_text]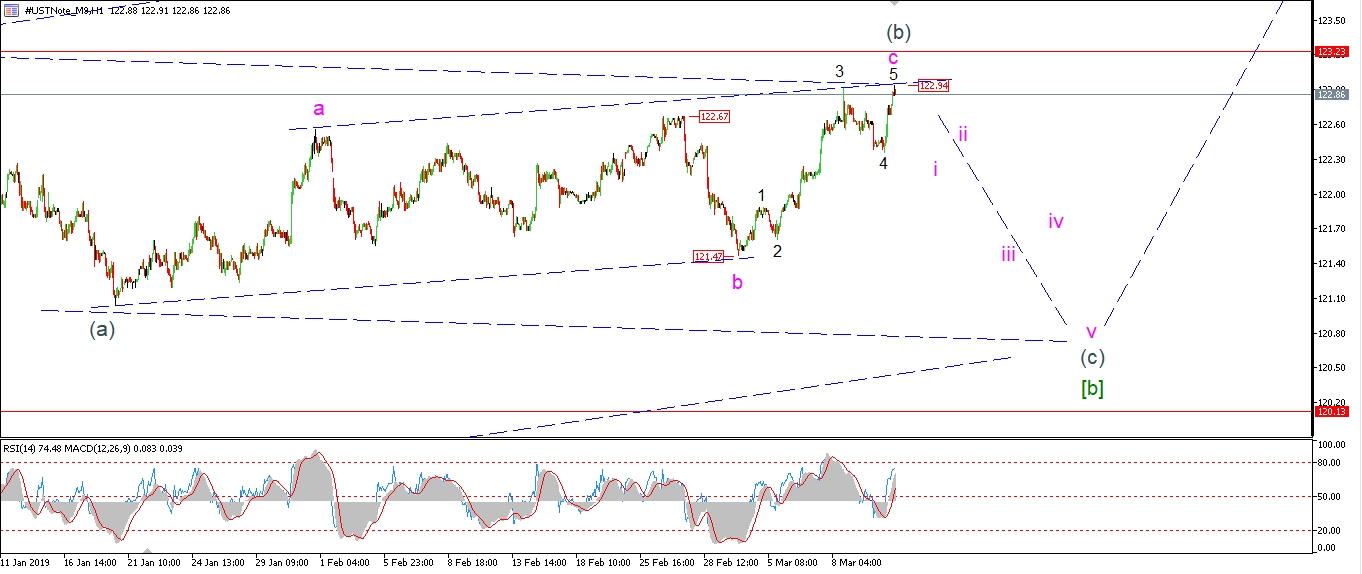 [/vc_column_text][/vc_column][vc_column width=”1/3″][vc_custom_heading text=”4 Hours” use_theme_fonts=”yes”][vc_column_text]
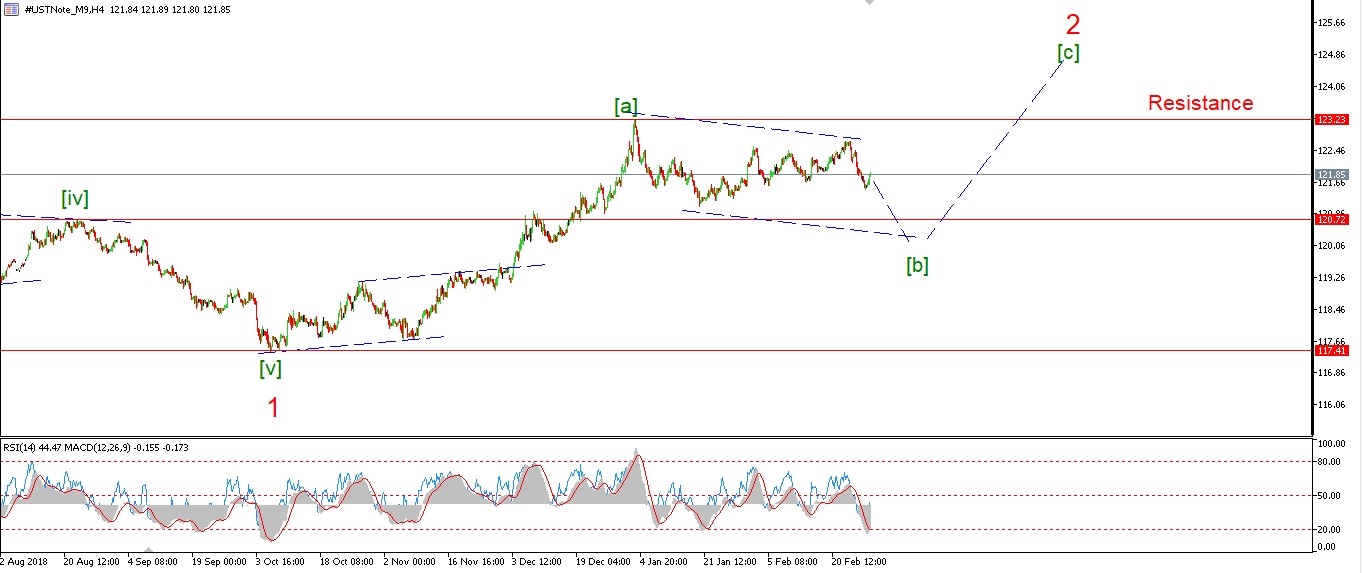 [/vc_column_text][vc_custom_heading text=”Daily” use_theme_fonts=”yes”][vc_column_text]
 [/vc_column_text][/vc_column][/vc_row]
[vc_row][vc_column][vc_column_text]
The 10YR surprised to the upside today,
however I think this is the final move to complete five waves within wave ‘c’ of (b).
The price has met the trendline again this evening at 122.94,
so wave (c) grey should now take over and carry the price lower into 120.50 again.
Tomorrow;
Watch for a lower high to be created in waves ‘i’ and ‘ii’ to begin wave (c).
[/vc_column_text][/vc_column][/vc_row]
[/_s2If]
[_s2If current_user_can(access_s2member_ccap_silver)]
[vc_row][vc_column][vc_separator border_width=”5″][/vc_column][/vc_row][vc_row][vc_column][vc_column_text]
SILVER
[/vc_column_text][/vc_column][/vc_row][vc_row][vc_column][vc_separator border_width=”5″][/vc_column][/vc_row][vc_row][vc_column width=”2/3″][vc_custom_heading text=”1 hr” use_theme_fonts=”yes”][vc_column_text]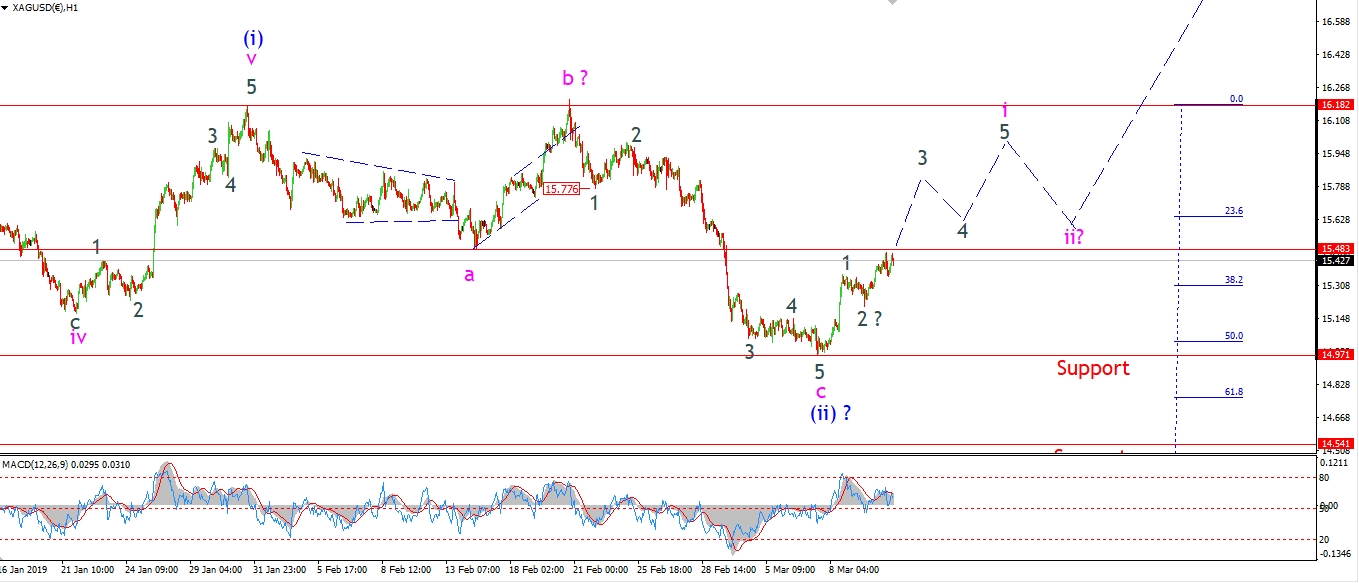 [/vc_column_text][/vc_column][vc_column width=”1/3″][vc_custom_heading text=”4 Hours” use_theme_fonts=”yes”][vc_column_text]
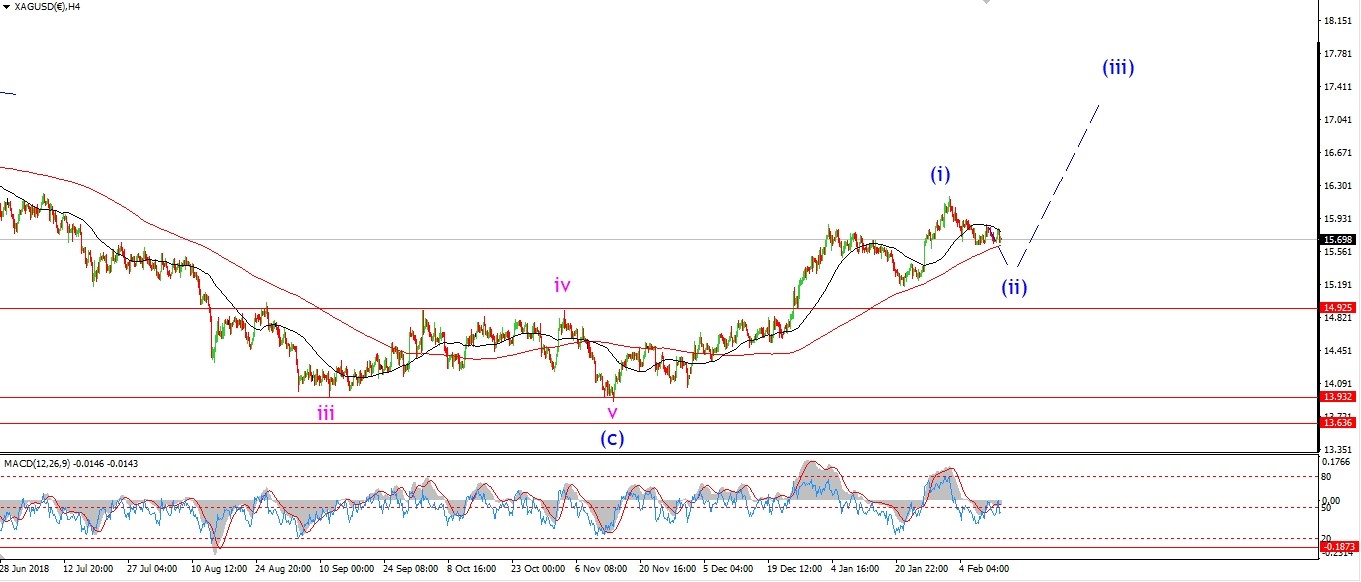 [/vc_column_text][vc_custom_heading text=”Daily” use_theme_fonts=”yes”][vc_column_text]
 [/vc_column_text][/vc_column][/vc_row]
[vc_row][vc_column][vc_column_text]
Much like Gold,
Silver is rising but it is unclear if this is wave ‘3’ of ‘i’,
or if wave ‘1’ of ‘i’ is still unfolding.
If the price drops back into 15.20 tomorrow,
that will suggest wave ‘1’ and ‘2’ are still in force with wave ‘3’ yet to come later in the week.
For now,
the bullish case for a rally in wave (iii) is getting better.
We just need five waves up in wave ‘i’ to confirm it.
Tomorrow;
Watch for 14.97 to hold,
and wave ‘i’ to continue higher in five waves.
[/vc_column_text][/vc_column][/vc_row]
[/_s2If]
[_s2If current_user_can(access_s2member_ccap_sp500)]
[vc_row][vc_column][vc_separator border_width=”5″][/vc_column][/vc_row][vc_row][vc_column][vc_column_text]
S&P 500.
[/vc_column_text][/vc_column][/vc_row][vc_row][vc_column][vc_separator border_width=”5″][/vc_column][/vc_row][vc_row][vc_column width=”2/3″][vc_custom_heading text=”1 hr” use_theme_fonts=”yes”][vc_column_text]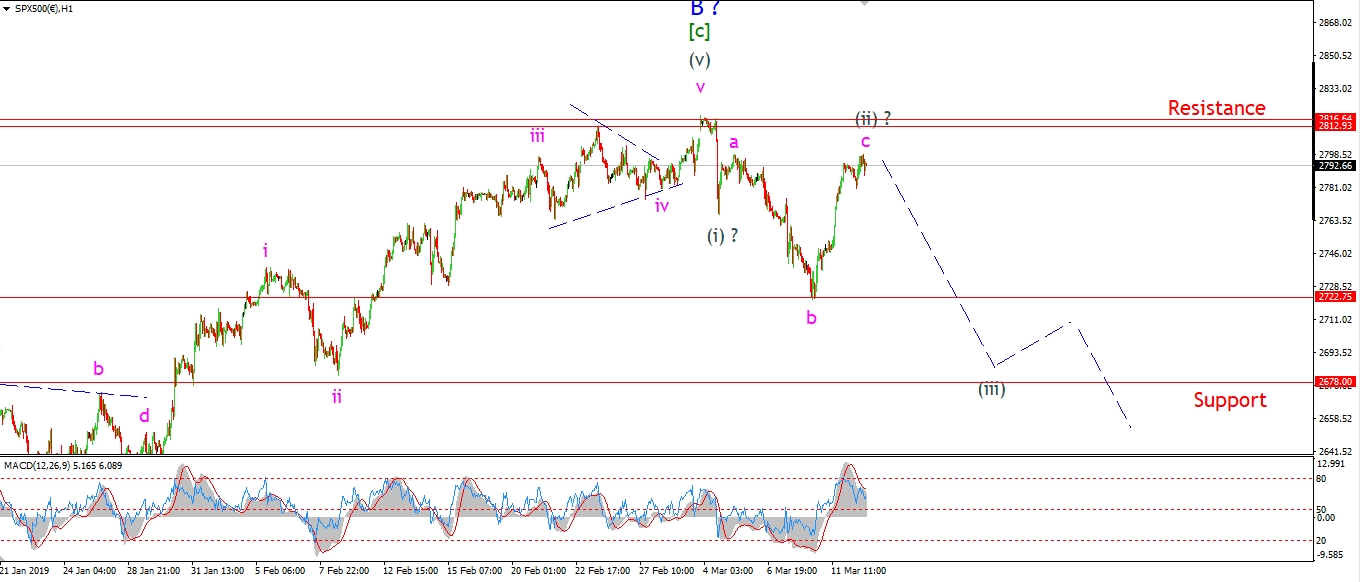 [/vc_column_text][/vc_column][vc_column width=”1/3″][vc_custom_heading text=”4 Hours” use_theme_fonts=”yes”][vc_column_text]
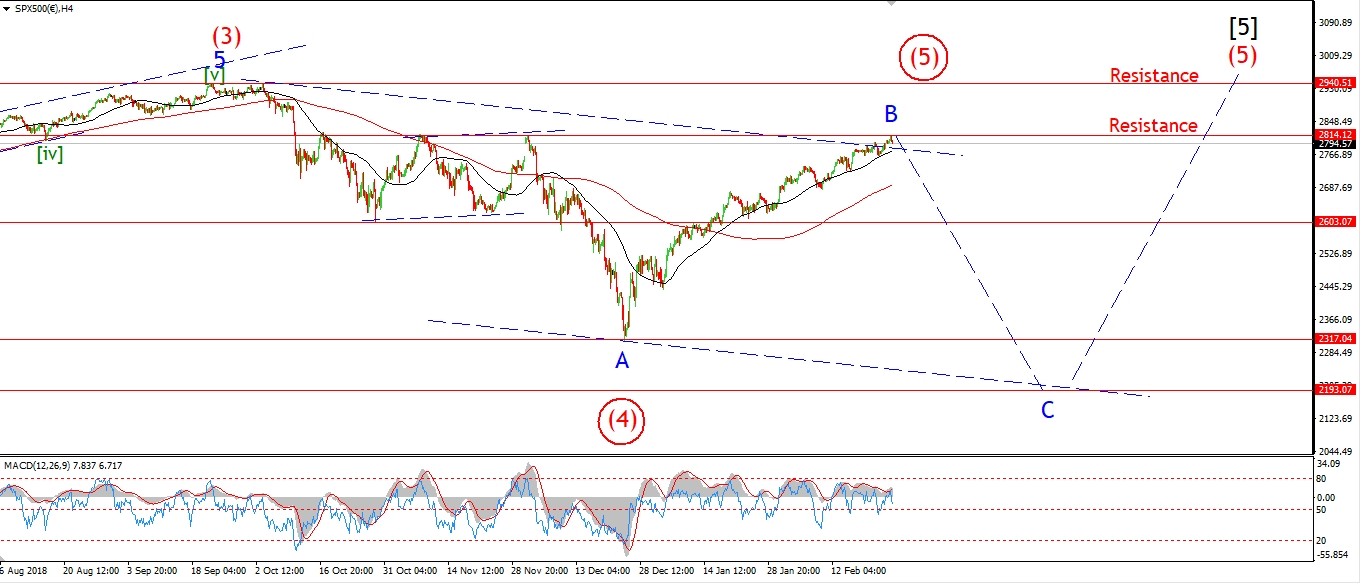 [/vc_column_text][vc_custom_heading text=”Daily” use_theme_fonts=”yes”][vc_column_text]
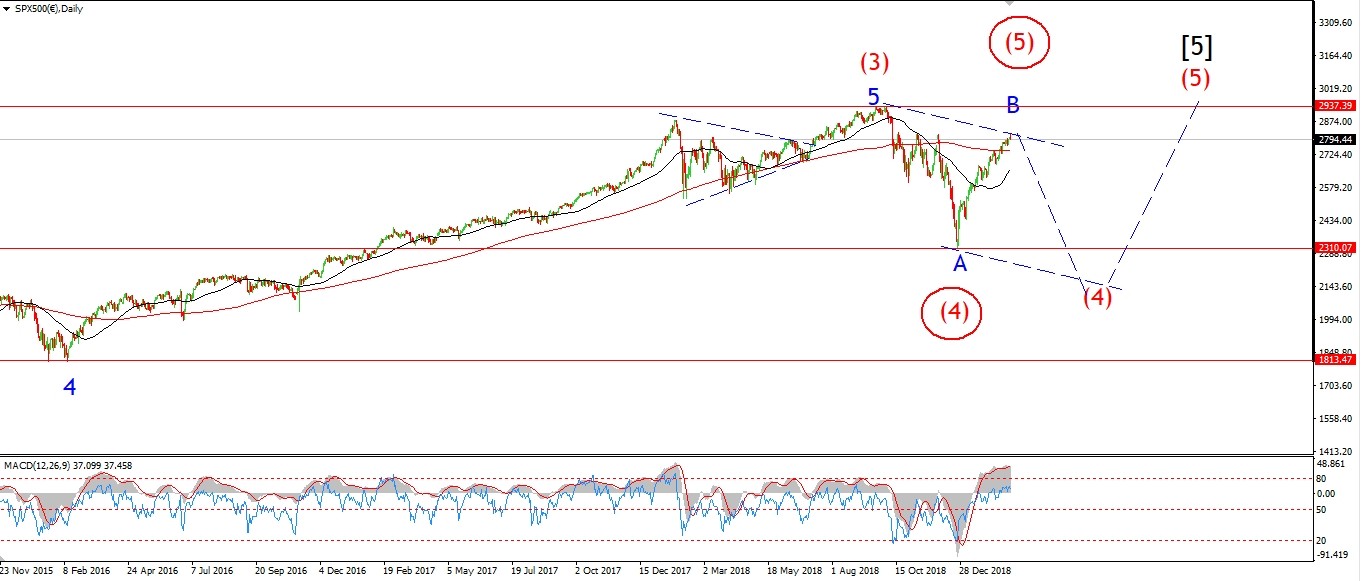 [/vc_column_text][/vc_column][/vc_row]
[vc_row][vc_column][vc_column_text]
The rise off Fridays lows in the S&P definitely looks like a five wave structure now.
But the price has come to halt this evening back at the previous interim high.
I have shown another bearish interpretation that might explain that action.
The decline could still be impulsive to the downside in waves (i) and (ii).
With wave (ii) being an expanded flat 3,3,5 structure.
Wave ‘c’ is then a five wave rally to complete wave (ii).
The price must turn lower tomorrow to begin wave (iii) in this scenario.
A break of 2722 will confirm this count.
But we are close to the upper invalidation line also,
So;
Tomorrow,
2816 must hold and wave (iii) down must begin with a sharp move lower.
[/vc_column_text][/vc_column][/vc_row]
[/_s2If]
[vc_row][vc_column][vc_column_text]
[/vc_column_text][/vc_column][/vc_row]
[vc_row][vc_column][vc_separator border_width=”5″][/vc_column][/vc_row]