
Good evening to one and all.
The Lord’s Blessing’s to you all again tonight.
https://twitter.com/bullwavesreal
EURUSD.
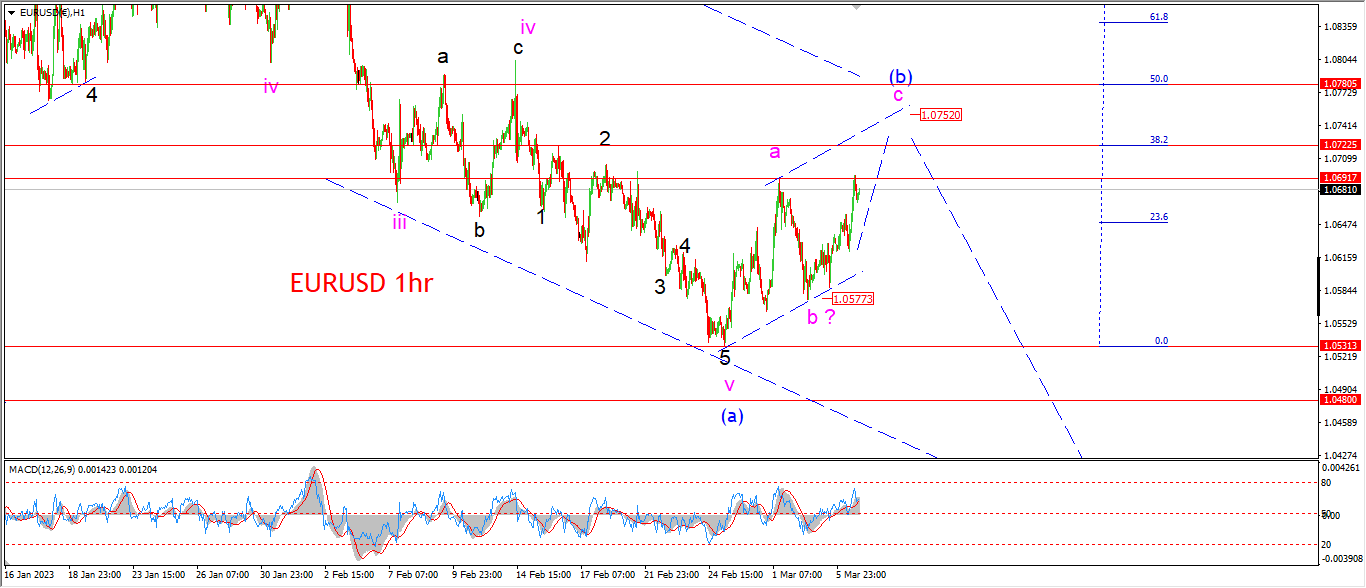
EURUSD 1hr.
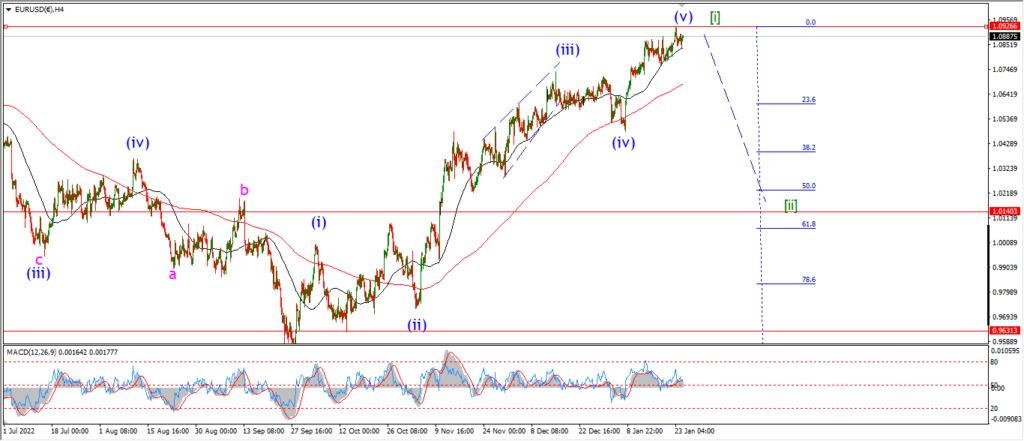
EURUSD 4hr.

EURUSD daily.
EURUSD bounced today and broke above the wave ‘a’ high again.
The price action has met the minimum target for wave ‘c’ now,
but I suspect wave ‘c’ will complete between the 38% and 50% retracement levels.
That gives us target for wave ‘c’ near the 1.0750 level.
The trend channel for wave (b) will be filled in the same price area also.
Tomorrow;
Watch for wave ‘c’ of (b) to top out with one more push into the 1.0750 level.
GBPUSD
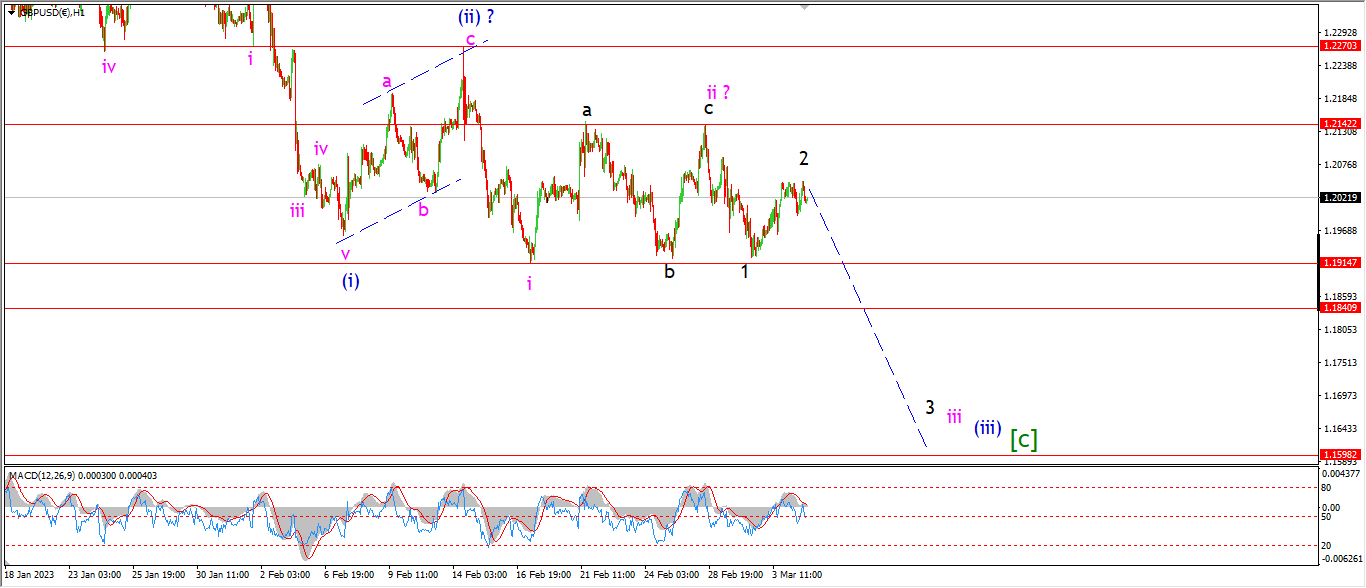
GBPUSD 1hr.
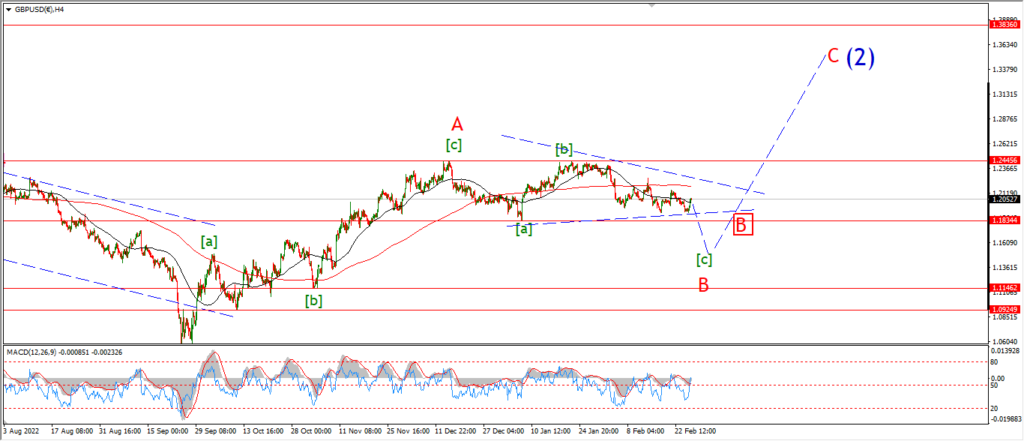
GBPUSD 4hr.

GBPUSD daily.
The wave count for cable is stuck in the mud today as the action is refusing to move in any direction over the last few days.
the price is holding at a lower high this evening,
As long as that wave ‘ii’ high holds at 1.2142,
then this pattern remains valid.
I do want to see a sharp move lower to begin wave ‘3’ of ‘iii’ tomorrow though,
if that next leg down does not begin soon,
then I will be forced to rethink the main pattern on the hourly chart.
Tomorrow;
21.42 must hold and wave ‘iii’ must turn down again for the rest of this week.
USDJPY.
USDJPY 1hr.
USDJPY 4hr.

USDJPY daily.
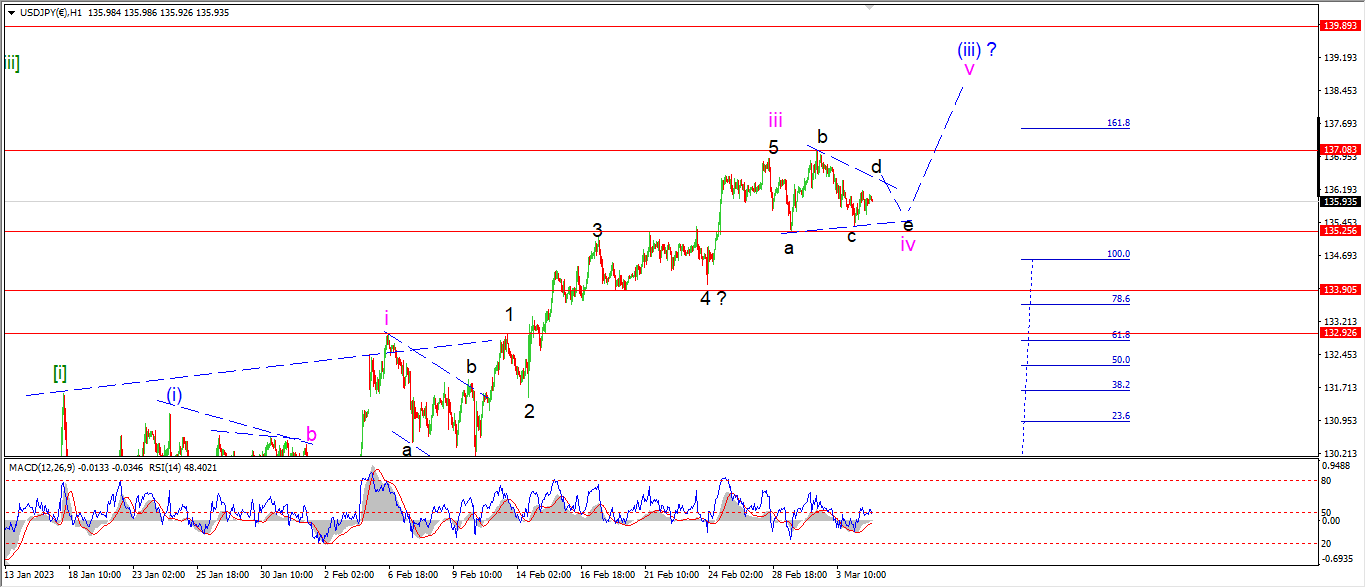
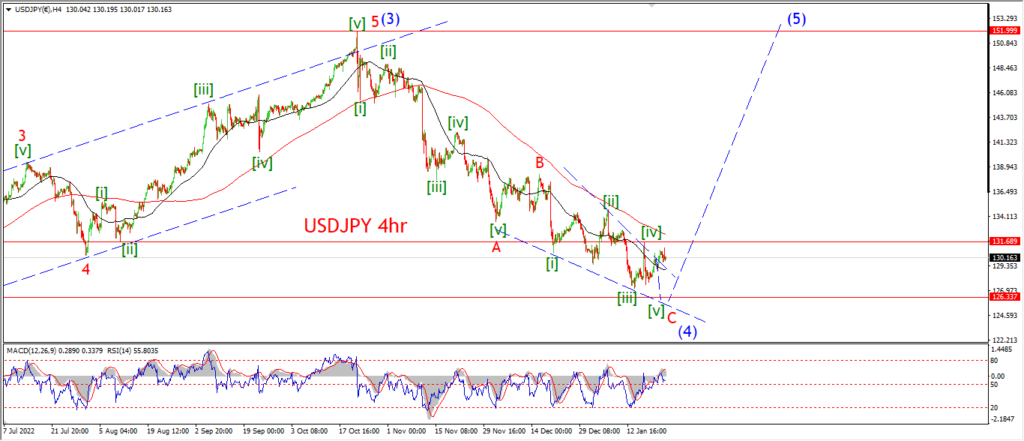
I am showing another possible pattern for wave ‘iv’ of (iii) today.
The action is continuing in a corrective sideways pattern for three days now.
And this opens up the possibility that a triangle is underway here.
If the price holds above 135.25 at the wave ‘c’ low,
that should be enough to confirm the triangle.
And wave ‘v’ should rally again back above 138.00 to complete the wave (iii).
Tomorrow;
Watch for wave ‘iv’ to continue and complete wave ‘d’ and ‘e’ above 135.25.
A break above 137.00 again should confirm wave ‘v’ is underway.
DOW JONES.
DOW 1hr.
DOW 4hr
DOW daily.
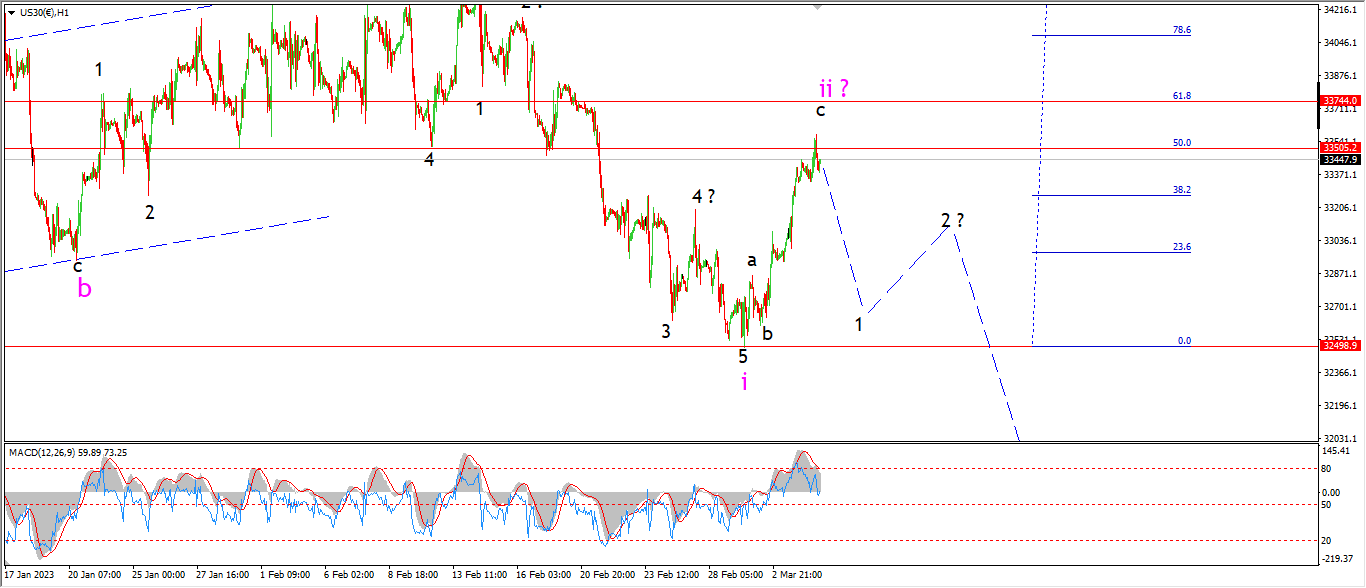
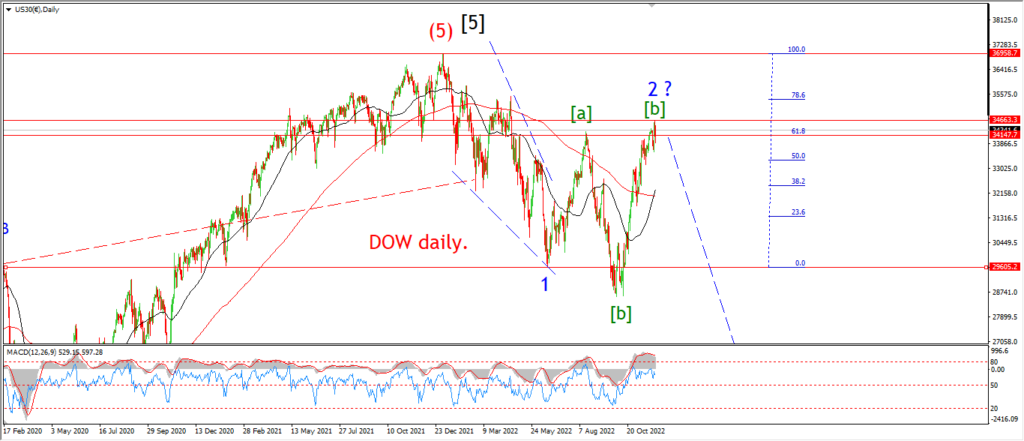
I have switched to the alternate low for wave ‘i’ tonight,
the low of wave ‘i’ is now shown as 32498,
and that larger wave ‘i’ decline puts a better perspective on last weeks rally.
That rally off the wave ‘i’ low is pretty sharp,
but I think we can label the internal pattern of wave ‘ii’ as a 3,3,5 correction higher.
This wave ‘ii’ retracement has gone far enough now.
The top of todays session broke the 50% Fib level,
and we have registered at least a short term momentum extreme in a second wave.
The overall pattern has been working out really well lately.
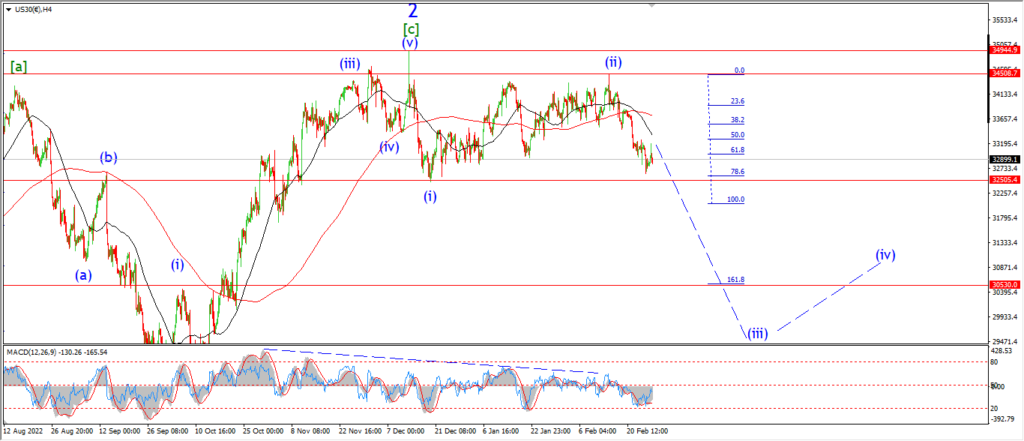
Since the middle of December last year we have another two second wave lower highs in place.
The big one is coming!
Wave (iii) of [i] of ‘3’ could accelerate lower this week if the pattern on the hourly chart is correct.
So I think it will be worth staying vigilant here.
Tomorrow;
Watch for wave ‘ii’ to top out and reverse into wave ‘1’ of ‘iii’ as shown.
GOLD
GOLD 1hr.
GOLD 4hr.

GOLD daily.
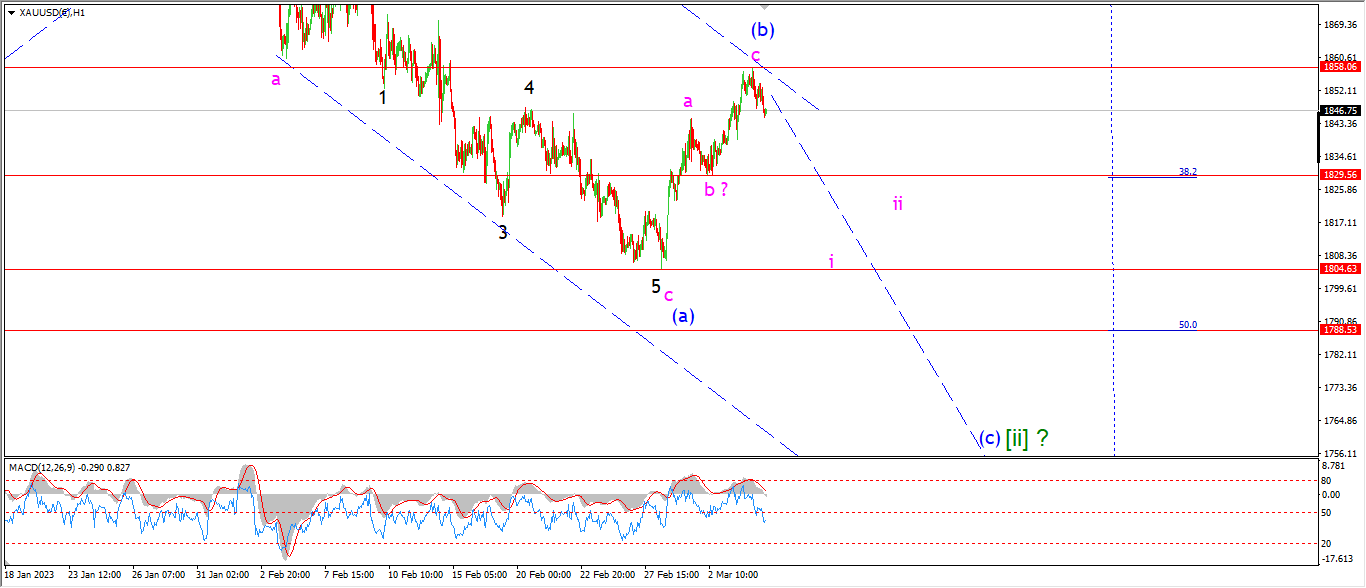
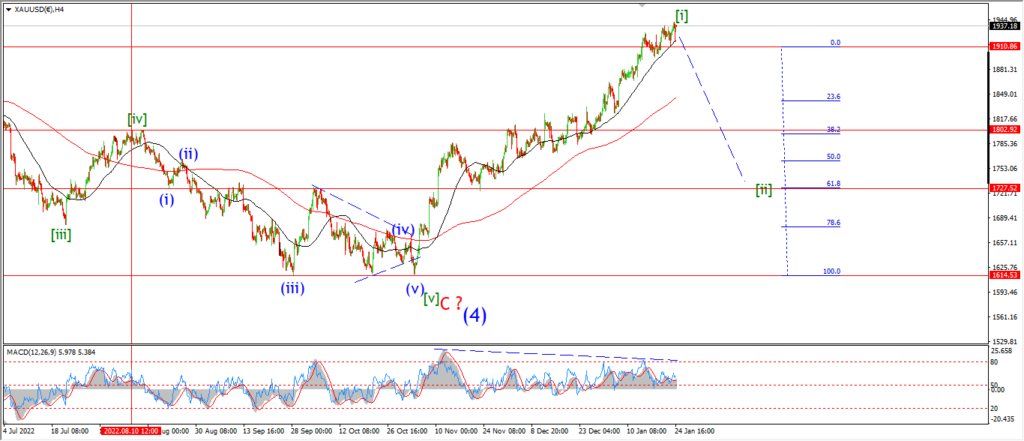
Gold has put in a short term top today at 1858,
the target that I was looking at for wave (b) was 1860.
that’s a reasonable strike.
But the action off the top of wave (b) is not convincing as an impulsive decline.
So I cannot call a top for wave (b) just yet.
If we see a sharp drop below the wave ‘b’ low at 1829 again,
that will be a reasonable signal that wave ‘i’ of (c) has begun.
There is another possibility for wave (b) as a larger flat correction,
but I will wait and see how the next few sessions play out before introducing that pattern.
Tomorrow;
Watch for a drop below 1829 again to indicate wave (b) has topped out and wave ‘i’ of (c) has begun.
CRUDE OIL.
CRUDE OIL 1hr.
CRUDE OIL 4hr.
CRUDE OIL daily.
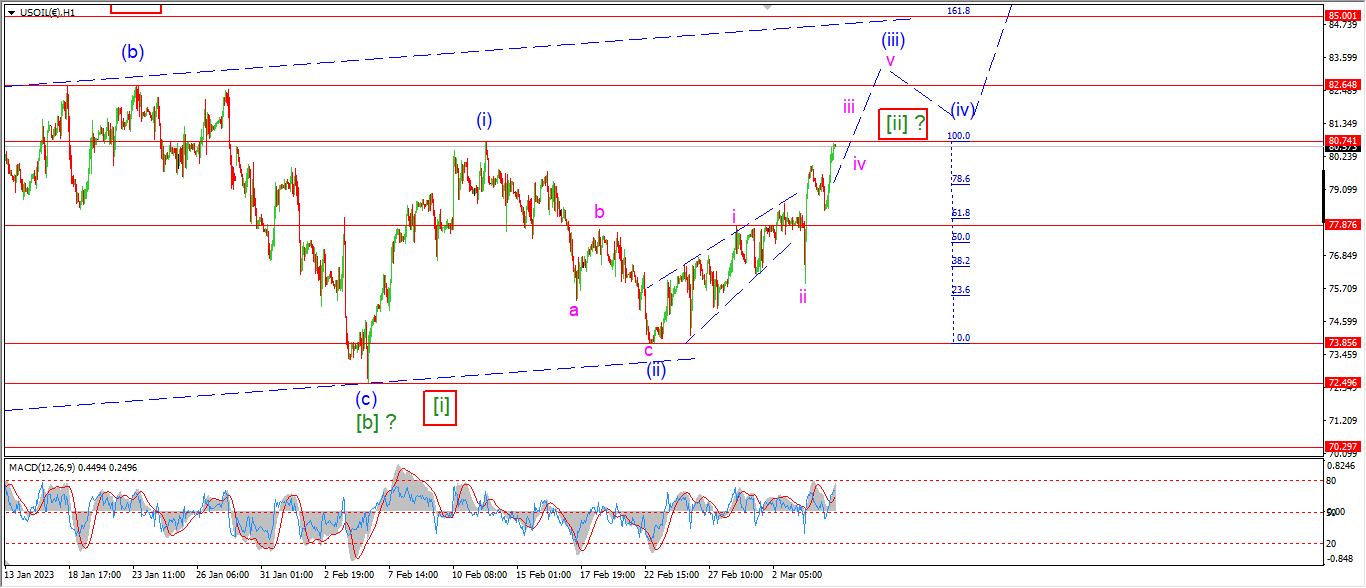
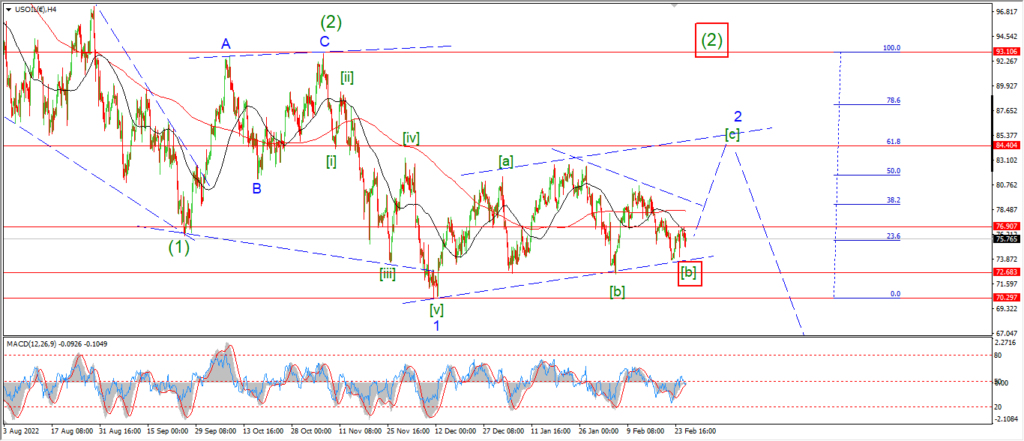
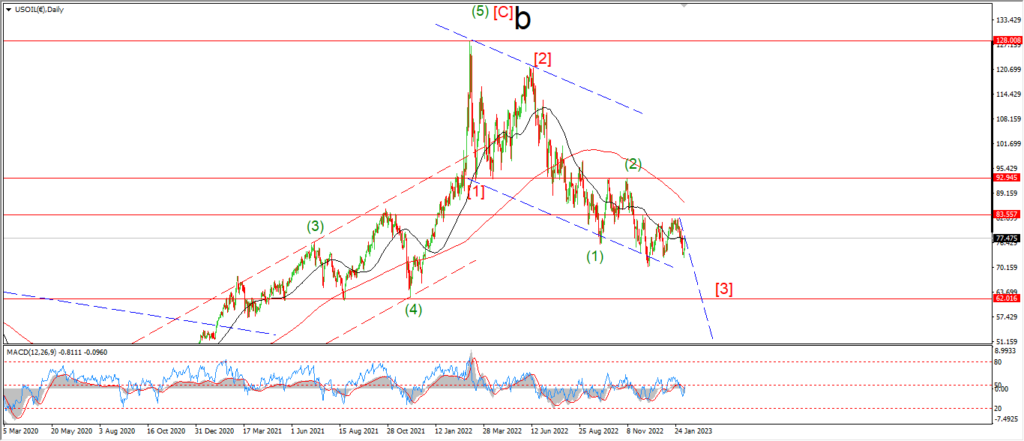
this pattern is a little closer to confirming wave [c] up this evening with another small spike higher towards that trigger level at 82.65.
The pattern in wave [c] is not ideal,
But as long as the price goes higher,
then wave [c] is in play.
As I write in favor of a wave [c] rally,
I can already see another possible alternate count for wave [i] and [ii] shown in red boxes.
A break above 82.65 again will confirm the main pattern for wave [c] and rule out this alternate count at the same time.
Until we get to that level,
I’m afraid this alternate will be lurking in the background.
Tomorrow;
Watch for wave (iii) of [c] to continue higher and break above 82.64 to confirm the pattern.
S&P 500.
S&P 500 1hr
S&P 500 4hr
S&P 500 daily.
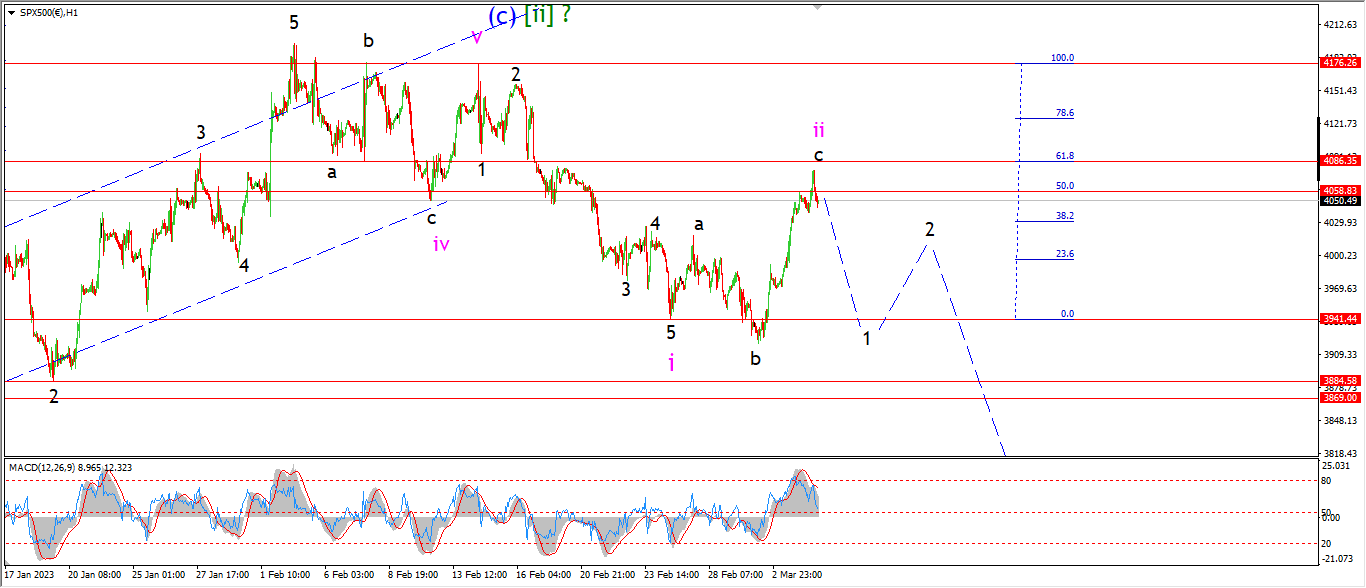
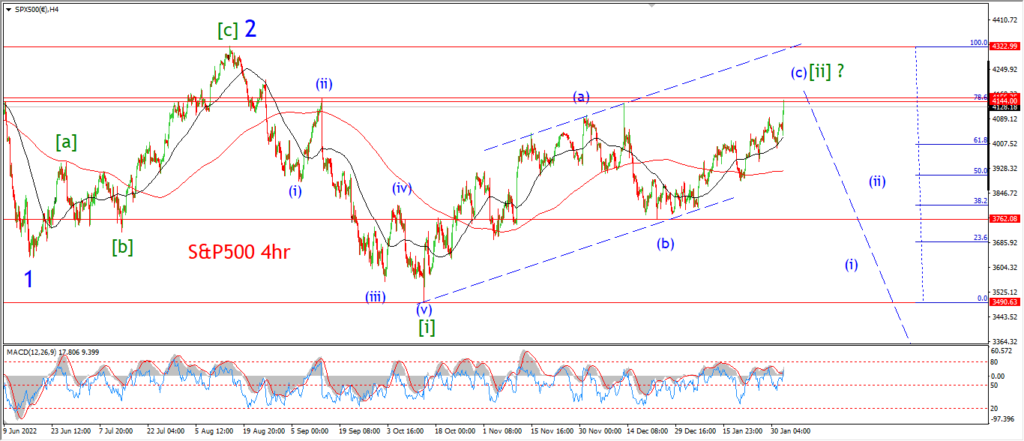
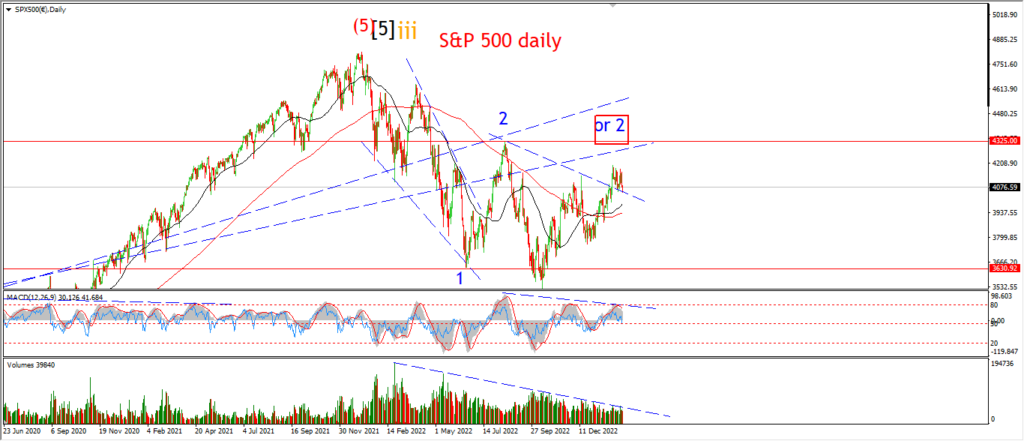
The rally in wave ‘c’ of ‘ii’ reached into that Fibonacci target zone between the 50 and 62% retracement levels today.
And this evening we have a small reversal off the top of the session.
I can see a five wave rally complete at todays high.
that completes a 3,3,5 expanded flat correction pattern in wave ‘ii’.
And now we need to see a sharp reversal off the top of wave ‘ii’ to signal wave ‘iii’ is underway.
I want to see the initial decline into wave ‘iii’ of (i) of [iii] by midweek.
And if we see a break of the wave ‘i’ low at 3941 again,
that should confirm wave ‘iii’ is underway.
Tomorrow;
Watch for wave ‘1’ and ‘2’ of ‘iii’ to for a lower high over the next few sessions.
Wave ‘iii’ down should extend the declines as the week progresses.
A break of 3941 again will signal wave ‘iii’ is underway.
SILVER.
SILVER 1hr
SILVER 4hr.
SILVER daily.
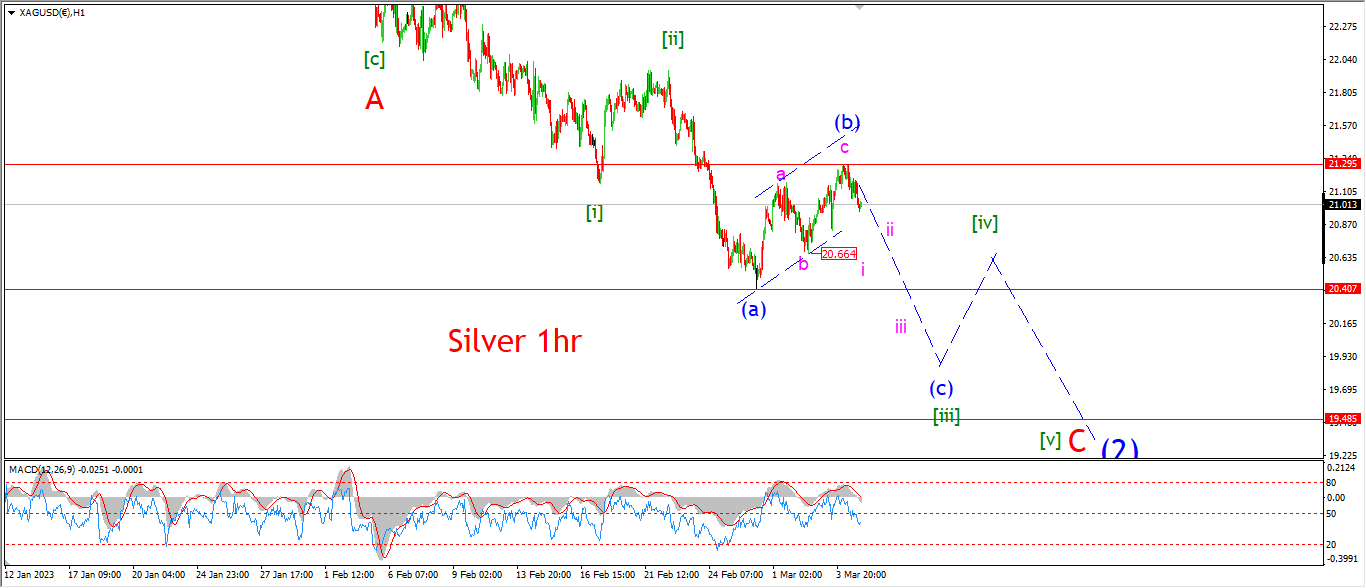
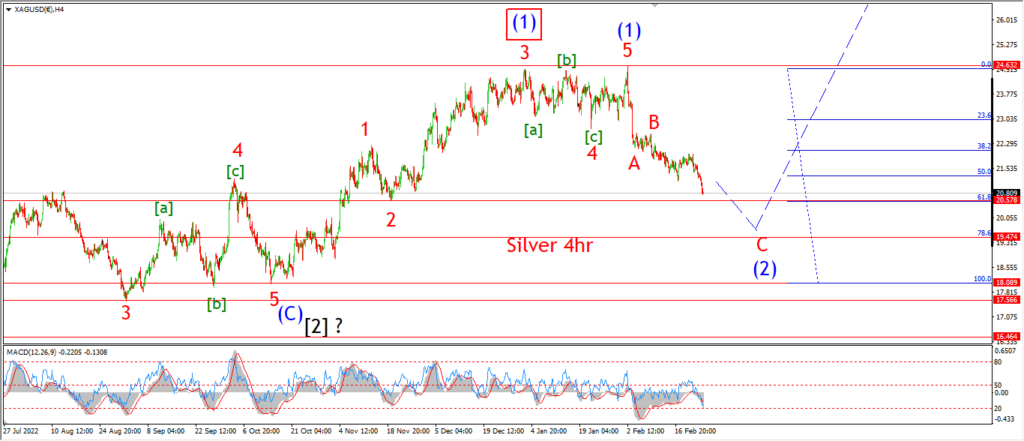
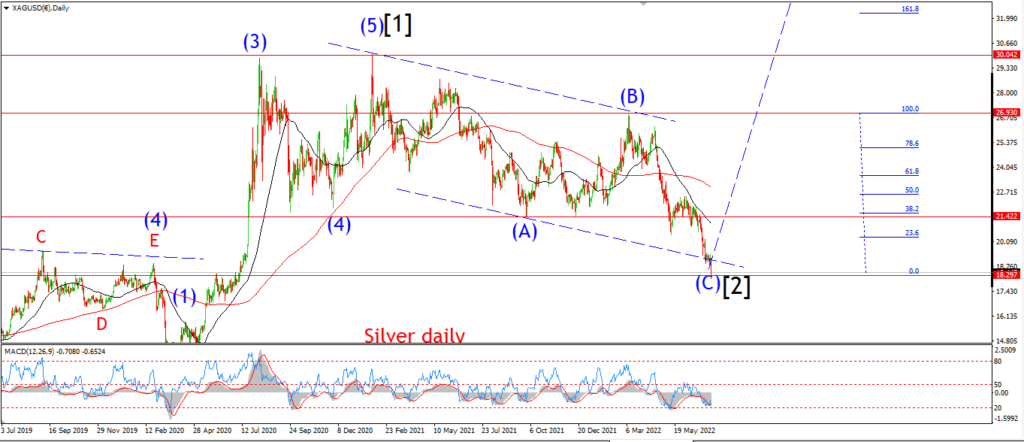
There is a three wave pattern in place off the wave (a) low now,
so this counld be a top for wave (b).
At the moment I am not convinced by the internal pattern of wave (b),
and I want to see a decline into wave (c) this week to confirm the corrective pattern for wave (b).
A break below that wave ‘b’ low at 20.66 again will signal wave ‘i’ of (c) is underway.
Tomorrow;
Watch for wave (b) to hold at 21.29.
Wave (c) should trace out five waves down to break the 20.00 handle again this week.
Watch for wave ‘i’ of (c) to fall in five waves as shown.
BITCOIN
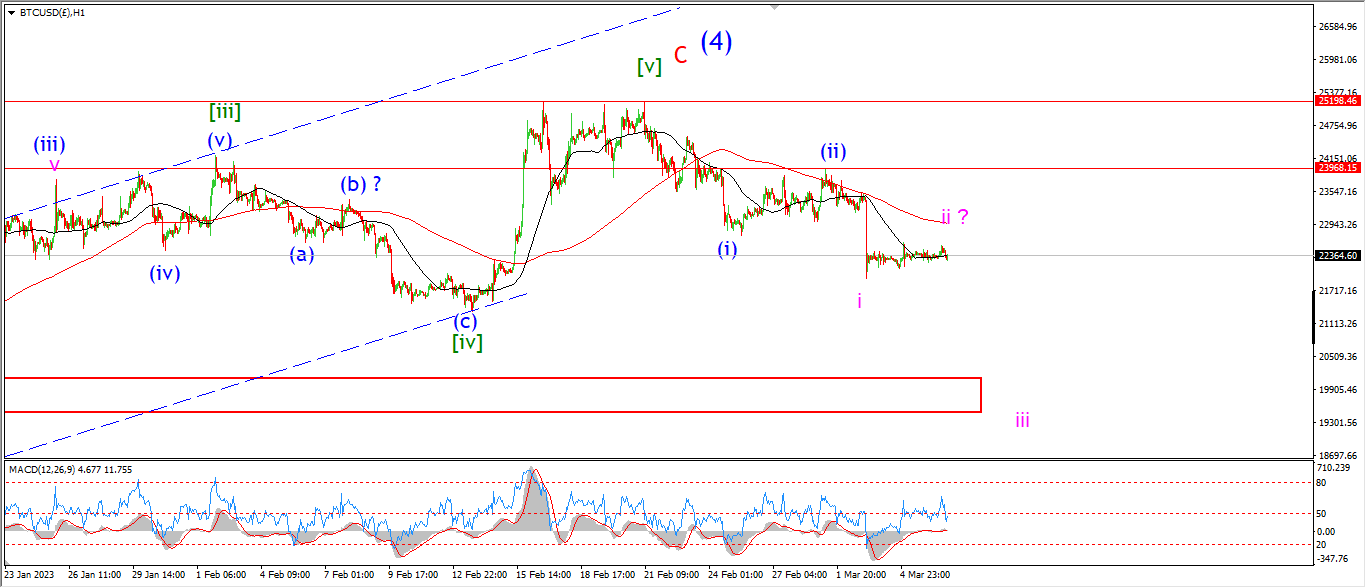
BITCOIN 1hr.

BITCOIN 4hr.
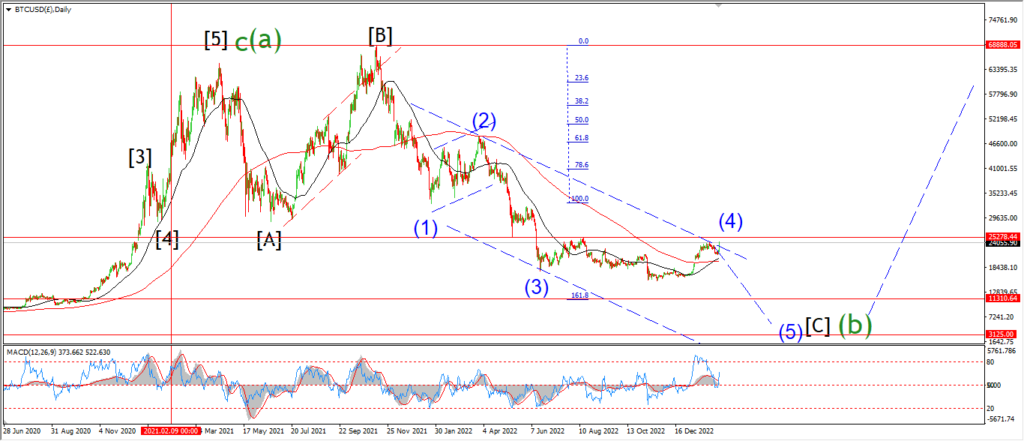
BITCOIN daily.
….
FTSE 100.
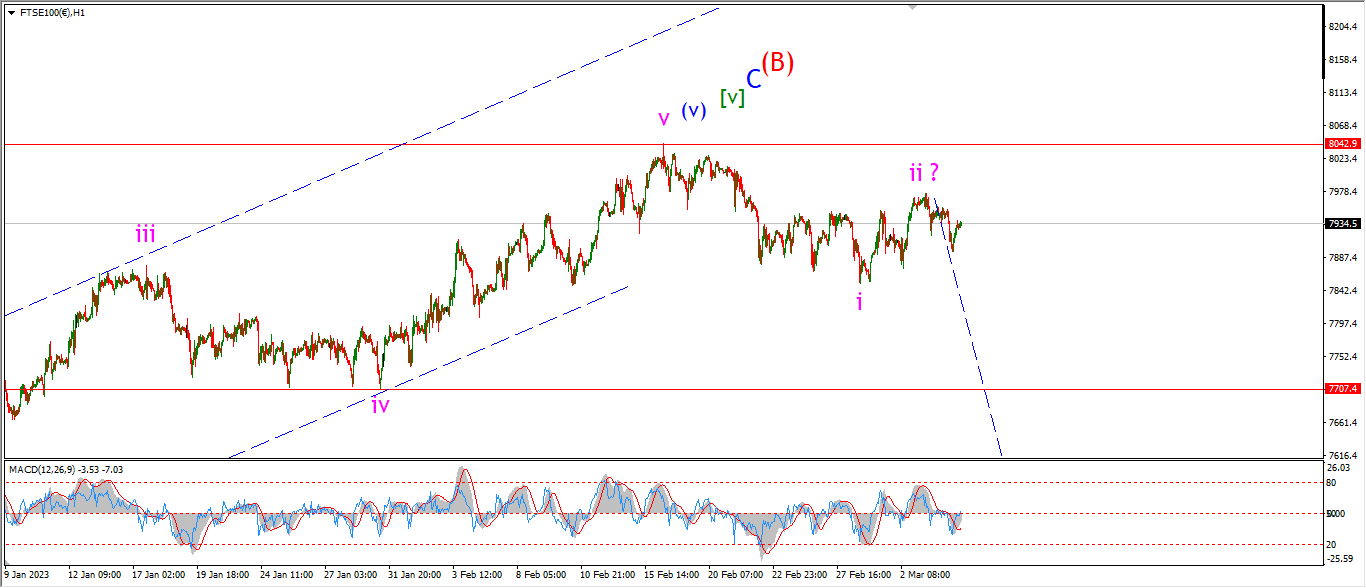
FTSE 100 1hr.
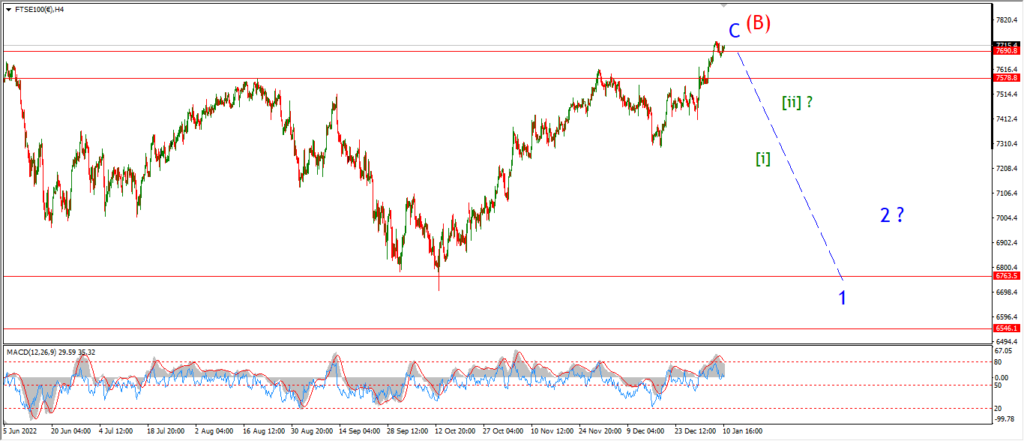
FTSE 100 4hr.

FTSE 100 daily.
….
DAX.
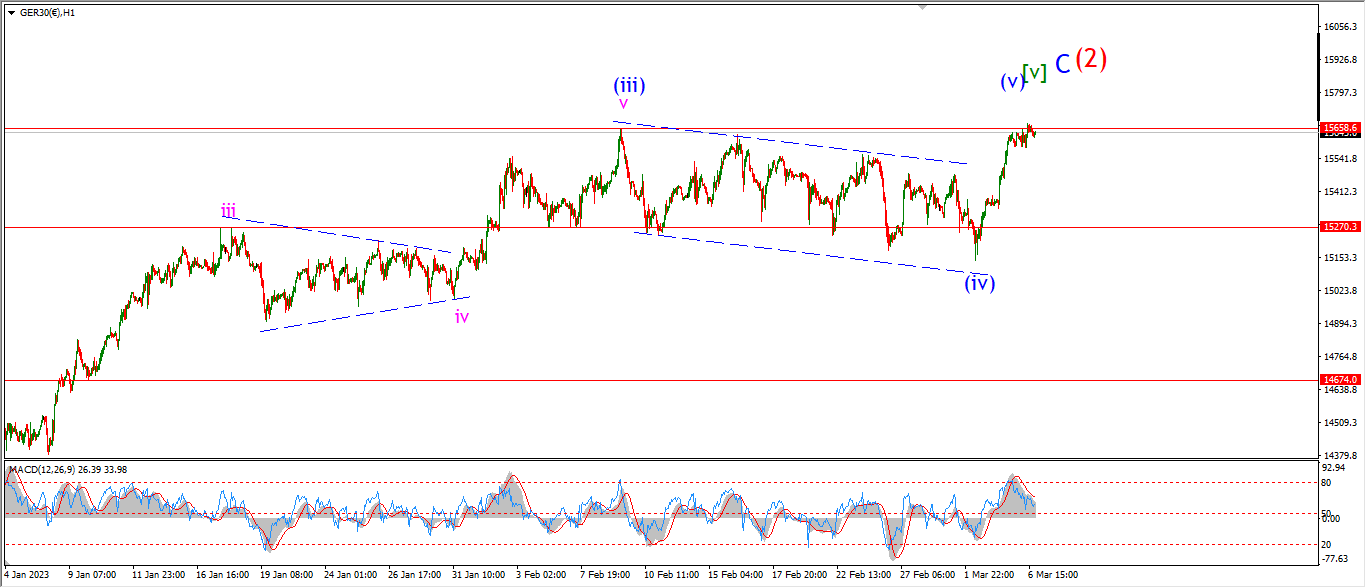
DAX 1hr
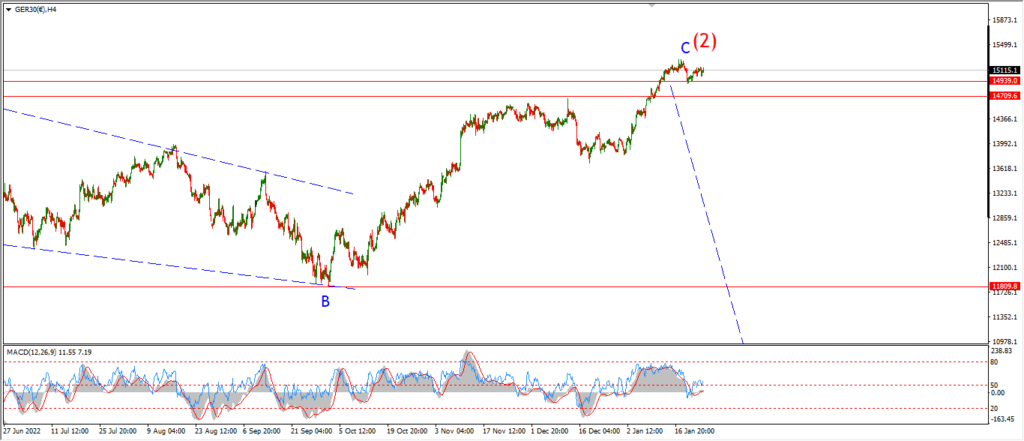
DAX 4hr

DAX daily.
….
NASDAQ 100.
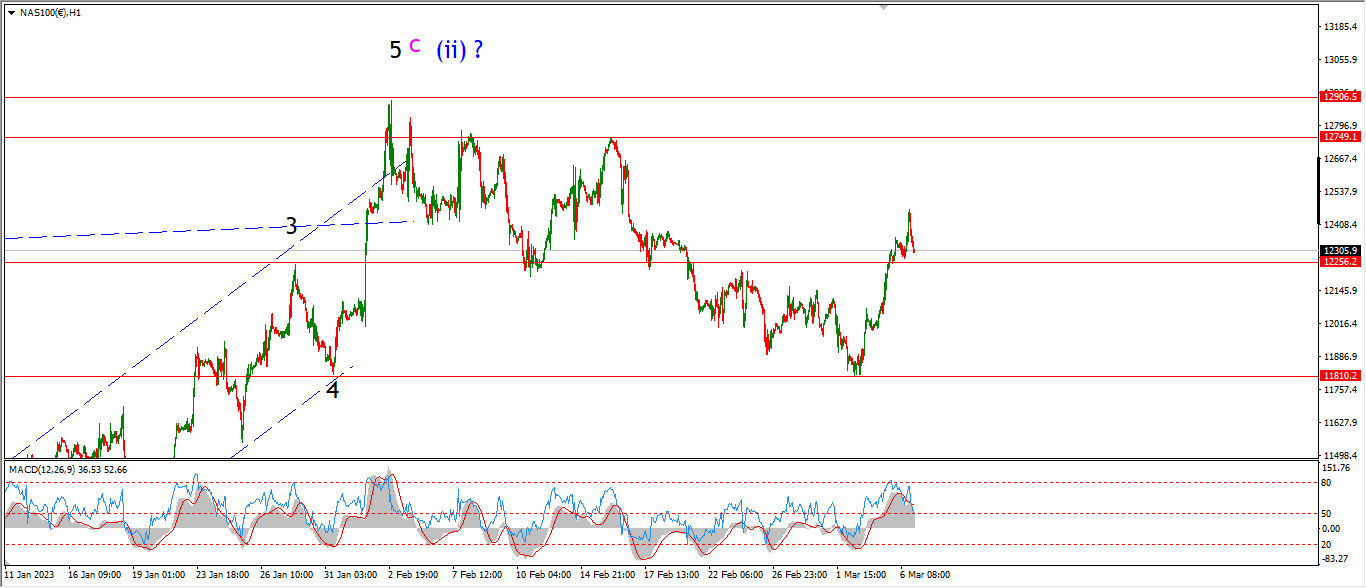
NASDAQ 1hr
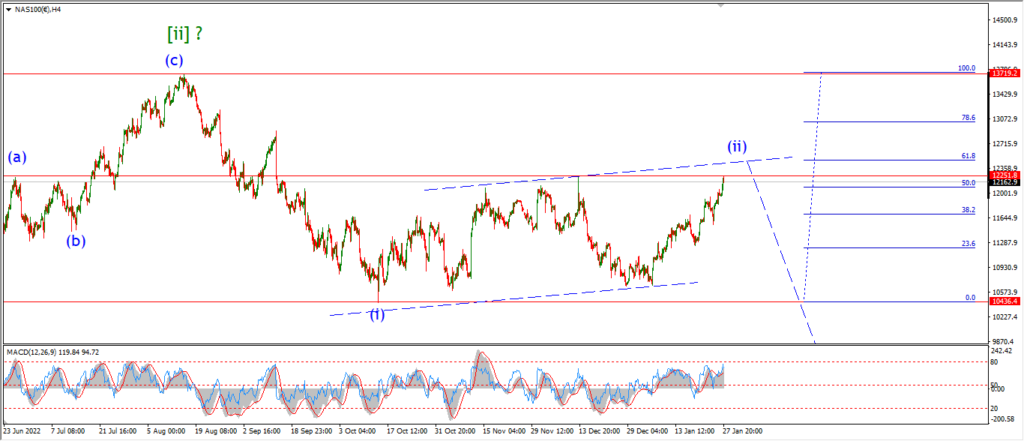
NASDAQ 4hr.

NASDAQ daily.
….