
[vc_row][vc_column][vc_separator border_width=”5″][/vc_column][/vc_row]
[vc_row][vc_column][vc_column_text]
Hi everyone.
Heres a chart I came across on the bull and bear % from the AAII.
The bearish sentiment level has dropped to near JAN 2018 lows now.
while the bull % is back to mid range again after the drop late last year.
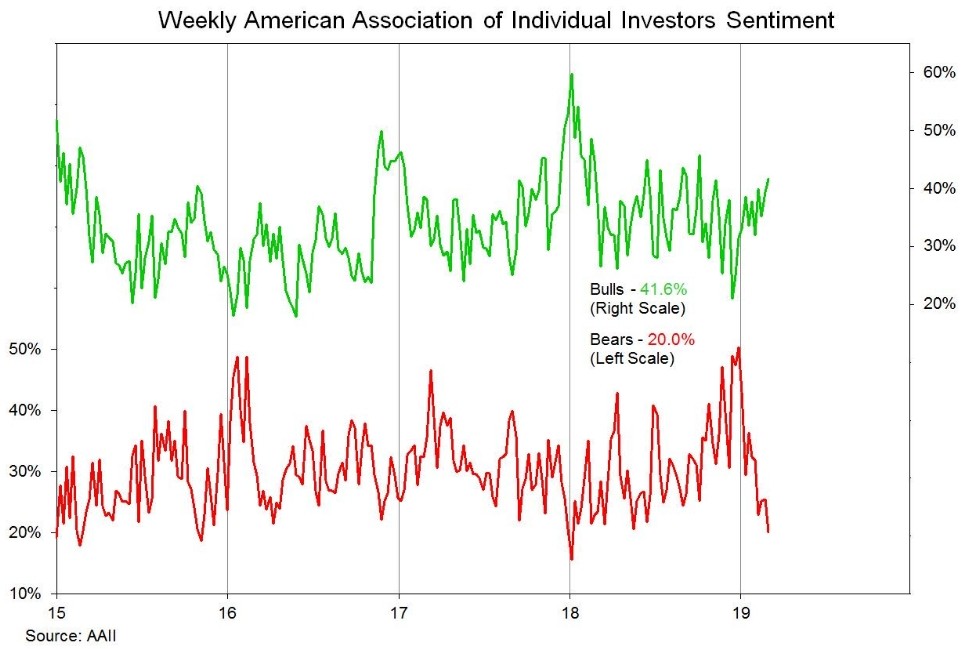
Individuals may not have totally jumped back into the market after getting creamed last quarter,
but they sure have let their guard down again!
My intuition tells me there is another right hook about to connect with the individuals investors open jaw !
[/vc_column_text][/vc_column][/vc_row]
[_s2If current_user_can(access_s2member_ccap_eurusd)]
[vc_row][vc_column][vc_separator border_width=”5″][/vc_column][/vc_row]
[vc_row][vc_column][vc_column_text]
EURUSD
[/vc_column_text][/vc_column][/vc_row]
[vc_row][vc_column][vc_separator border_width=”5″][/vc_column][/vc_row][vc_row][vc_column width=”2/3″][vc_custom_heading text=”1 hr” use_theme_fonts=”yes”][vc_column_text]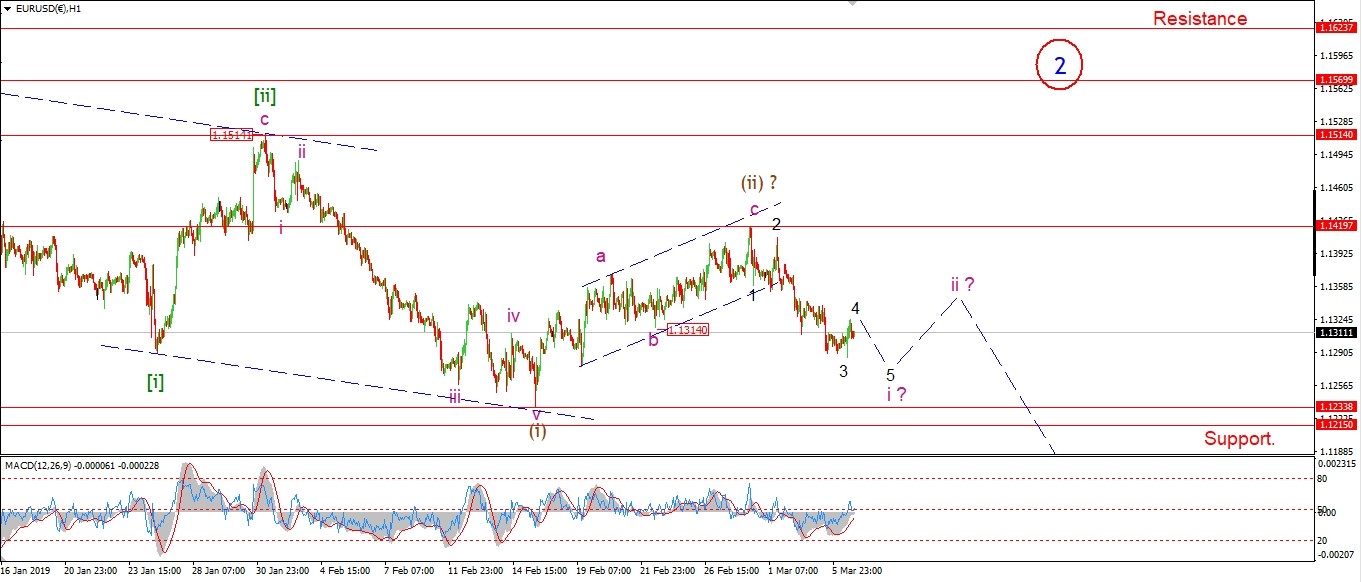 [/vc_column_text][/vc_column][vc_column width=”1/3″][vc_custom_heading text=”4 Hours” use_theme_fonts=”yes”][vc_column_text]
 [/vc_column_text][vc_custom_heading text=”Daily” use_theme_fonts=”yes”][vc_column_text]
 [/vc_column_text][/vc_column][/vc_row]
[vc_row][vc_column][vc_column_text]
Wave ‘i’ down has been a very uneventful affair so far.
The price seems unwilling to yield the trading range we have been stuck in for weeks now.
In saying that,
The drop off the wave (ii) high is still easily viewed as an ongoing five wave decline.
The recent low has completed an extended wave ‘3’.
Todays action has been correcting in wave ‘4’ of ‘i’.
Wave ‘5’ is left to drop into support over the next few sessions.
Tomorrow;
Watch for wave ‘4’ of ‘i’ to complete below 1.1350.
Wave ‘5’ should then turn lower again.
[/vc_column_text][/vc_column][/vc_row]
[/_s2If]
[_s2If current_user_can(access_s2member_ccap_gbpusd)]
[vc_row][vc_column][vc_separator border_width=”5″][/vc_column][/vc_row][vc_row][vc_column][vc_column_text]
GBPUSD
[/vc_column_text][/vc_column][/vc_row][vc_row][vc_column][vc_separator border_width=”5″][/vc_column][/vc_row][vc_row][vc_column width=”2/3″][vc_custom_heading text=”1 hr” use_theme_fonts=”yes”][vc_column_text]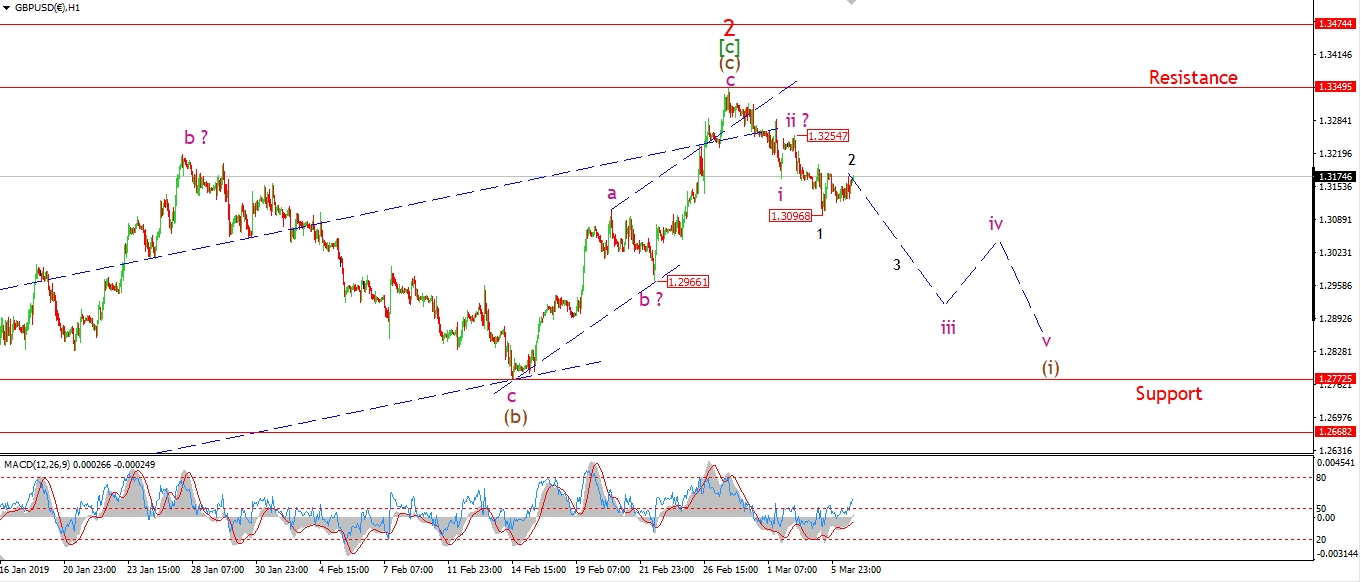 [/vc_column_text][/vc_column][vc_column width=”1/3″][vc_custom_heading text=”4 Hours” use_theme_fonts=”yes”][vc_column_text]
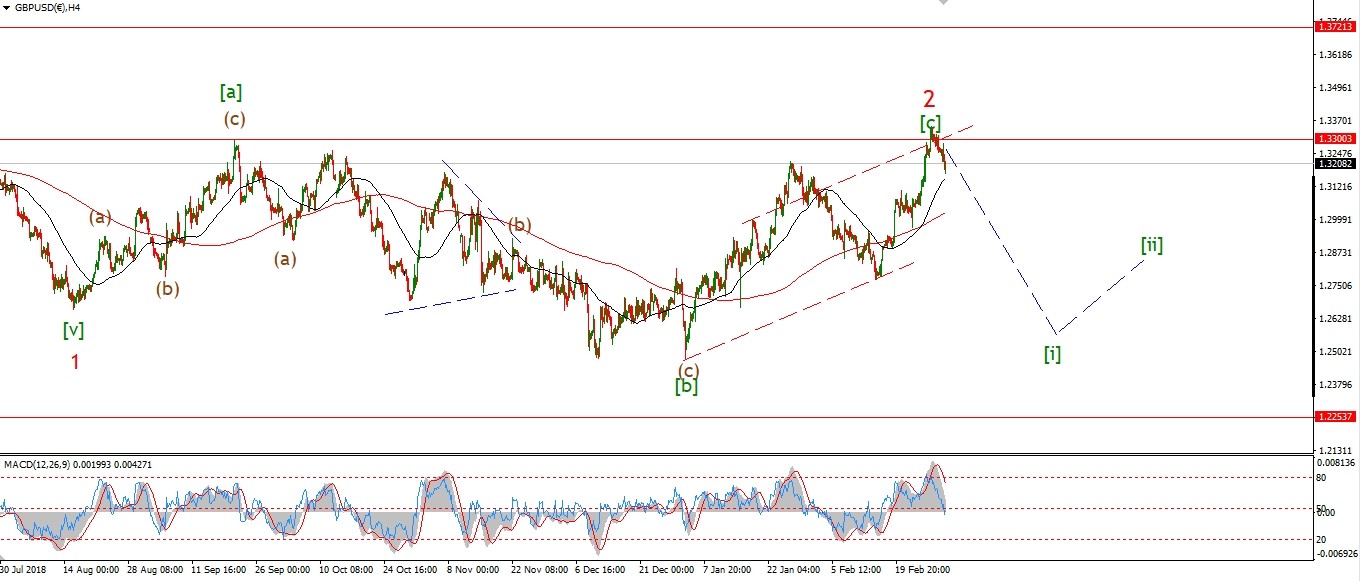 [/vc_column_text][vc_custom_heading text=”Daily” use_theme_fonts=”yes”][vc_column_text]
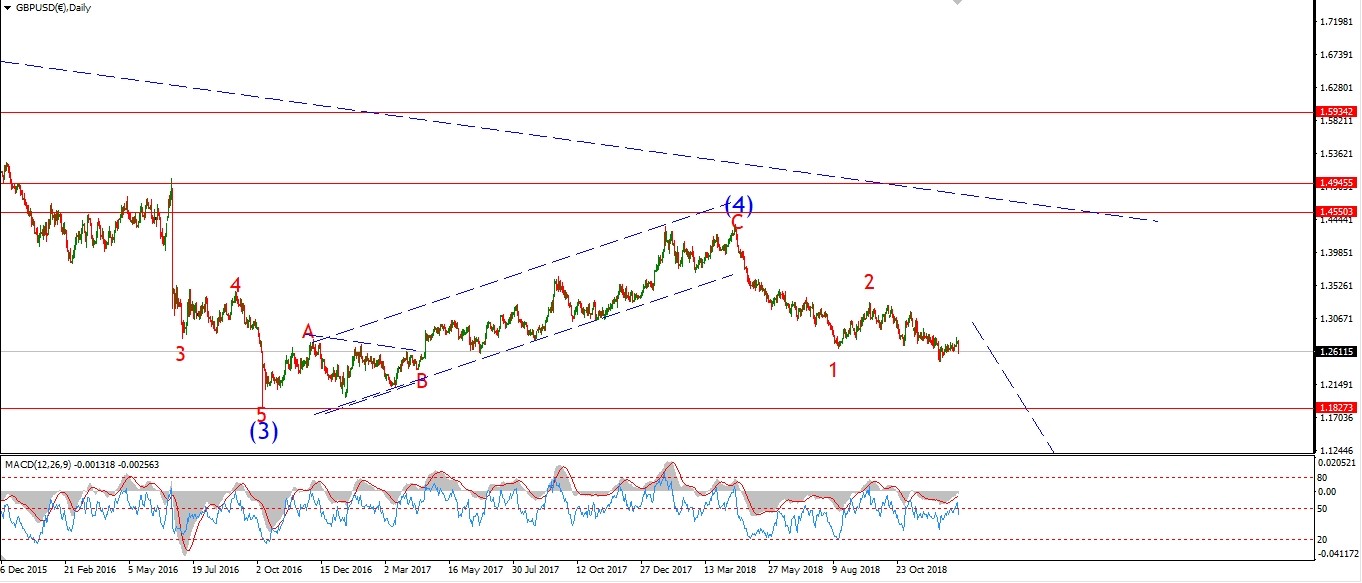 [/vc_column_text][/vc_column][/vc_row]
[vc_row][vc_column][vc_column_text]
Cable is moving higher in a corrective wave ‘2’ today.
I have shown the recent action as a series of impulse waves lower within wave (i) down.
The price is now moving lower in wave ‘iii’ of (i),
so we must see a sharp drop below 1.3090 tomorrow to confirm this bearish pattern.
Tomorrow;
Watch for wave ‘2’ to complete in three waves and then an acceleration lower in wave ‘3’ of ‘iii’.
[/vc_column_text][/vc_column][/vc_row]
[/_s2If]
[_s2If current_user_can(access_s2member_ccap_usdjpy)]
[vc_row][vc_column][vc_separator border_width=”5″][/vc_column][/vc_row][vc_row][vc_column][vc_column_text]
USDJPY
[/vc_column_text][/vc_column][/vc_row][vc_row][vc_column][vc_separator border_width=”5″][/vc_column][/vc_row][vc_row][vc_column width=”2/3″][vc_custom_heading text=”1 hr” use_theme_fonts=”yes”][vc_column_text]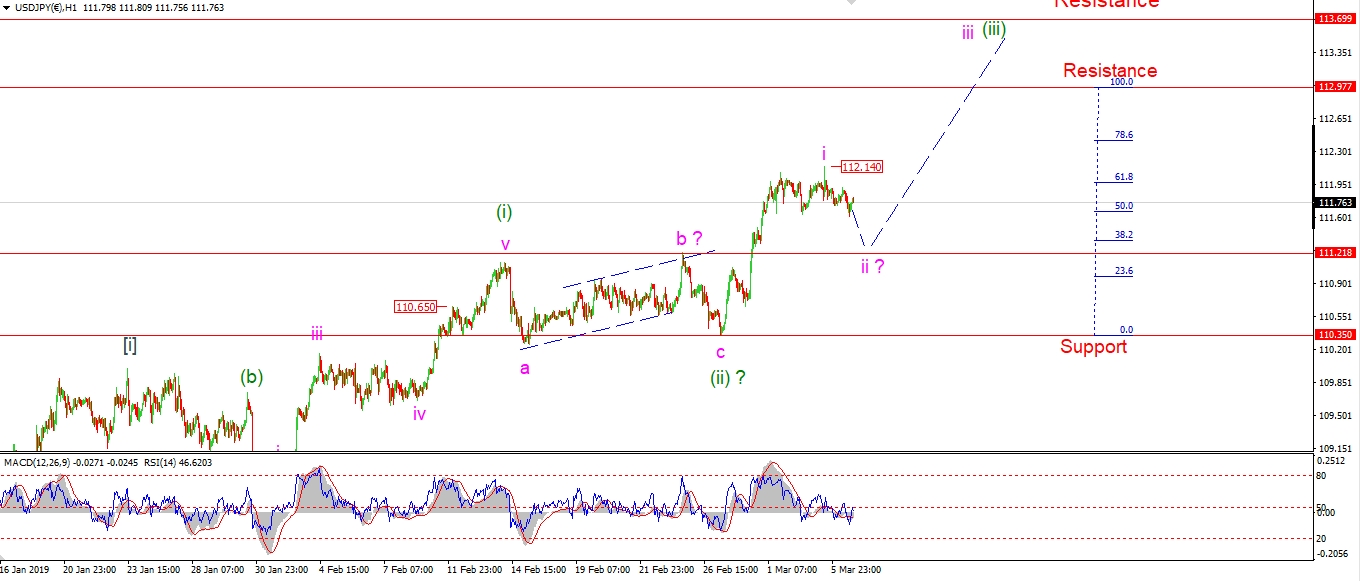 [/vc_column_text][/vc_column][vc_column width=”1/3″][vc_custom_heading text=”4 Hours” use_theme_fonts=”yes”][vc_column_text]
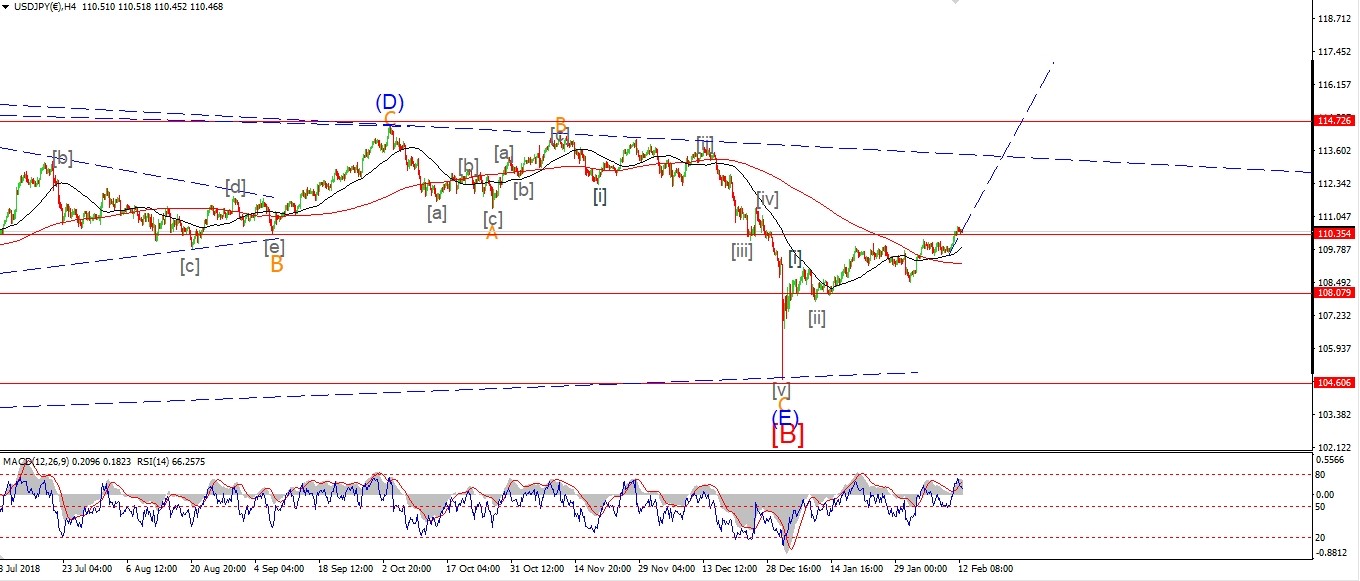 [/vc_column_text][vc_custom_heading text=”Daily” use_theme_fonts=”yes”][vc_column_text]
 [/vc_column_text][/vc_column][/vc_row]
[vc_row][vc_column][vc_column_text]
USDJPY is dropping today in wave ‘ii’ of (iii).
The price has fallen in three waves off the high,
but the correction is quite shallow so far.
I expect wave ‘ii’ should find support at about 111.20 before completing.
Tomorrow;
Watch for wave ‘ii’ to continue correcting lower to support.
An spike higher off the wave ‘ii’ low will signal wave ‘iii’ has begun.
[/vc_column_text][/vc_column][/vc_row]
[/_s2If]
[_s2If current_user_can(access_s2member_ccap_dow_jones)]
[vc_row][vc_column][vc_separator border_width=”5″][/vc_column][/vc_row][vc_row][vc_column][vc_column_text]
DOW JONES INDUSTRIALS
[/vc_column_text][/vc_column][/vc_row][vc_row][vc_column][vc_separator border_width=”5″][/vc_column][/vc_row][vc_row][vc_column width=”2/3″][vc_custom_heading text=”1 hr” use_theme_fonts=”yes”][vc_column_text]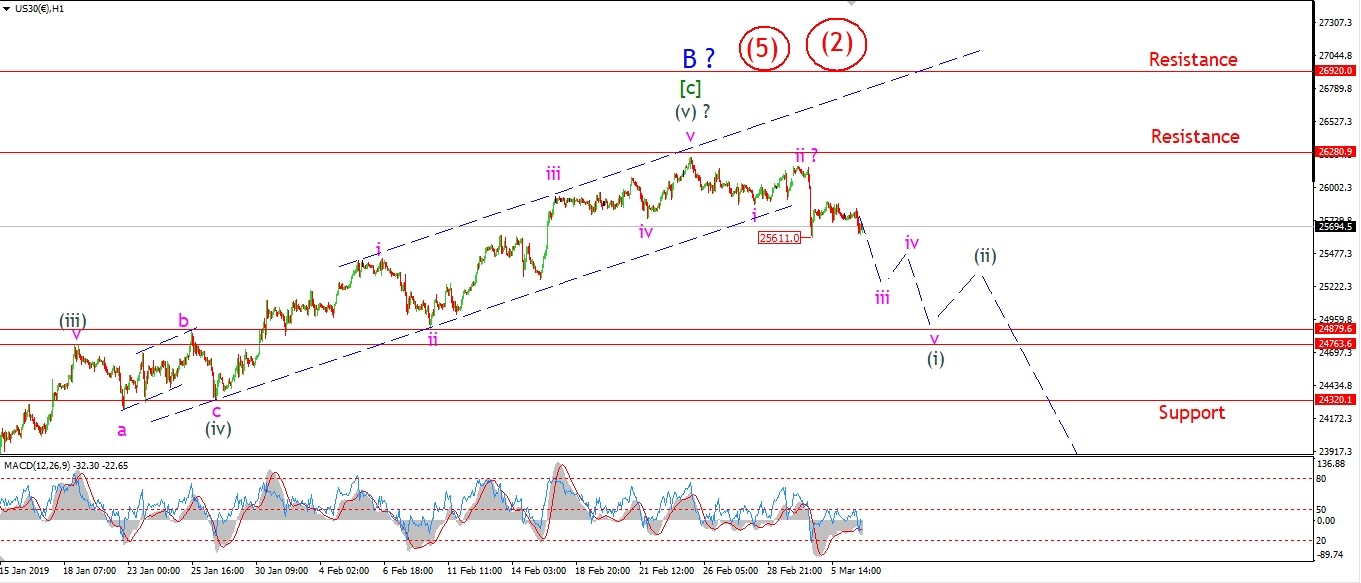 [/vc_column_text][/vc_column][vc_column width=”1/3″][vc_custom_heading text=”4 Hours” use_theme_fonts=”yes”][vc_column_text]
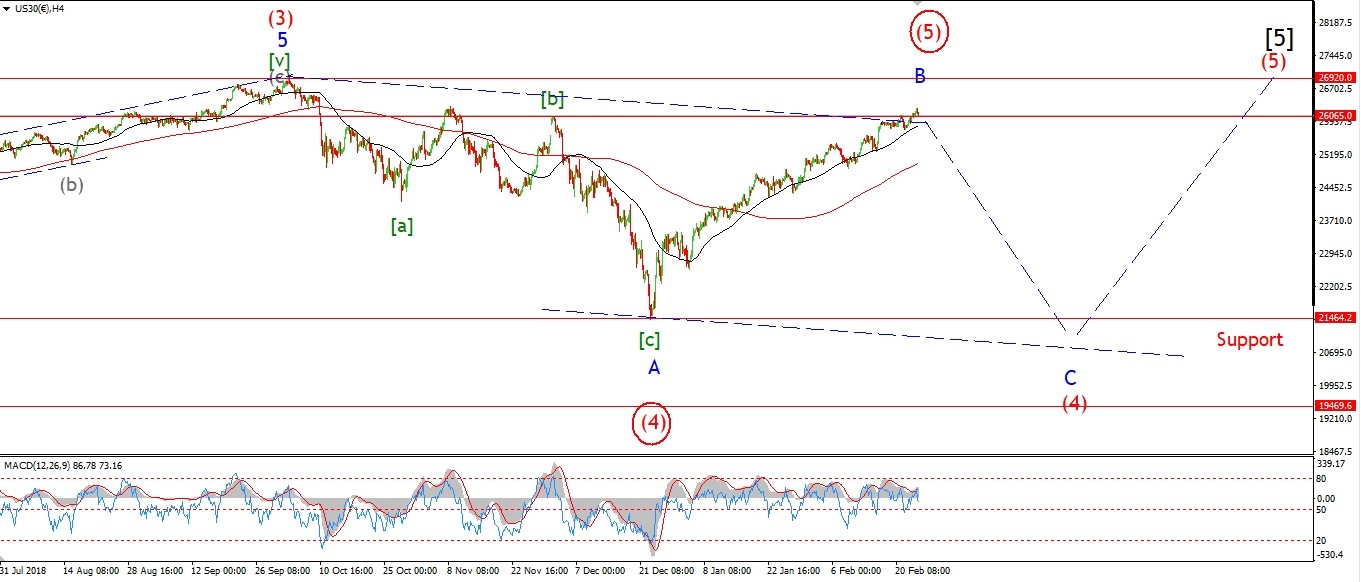 [/vc_column_text][vc_custom_heading text=”Daily” use_theme_fonts=”yes”][vc_column_text]
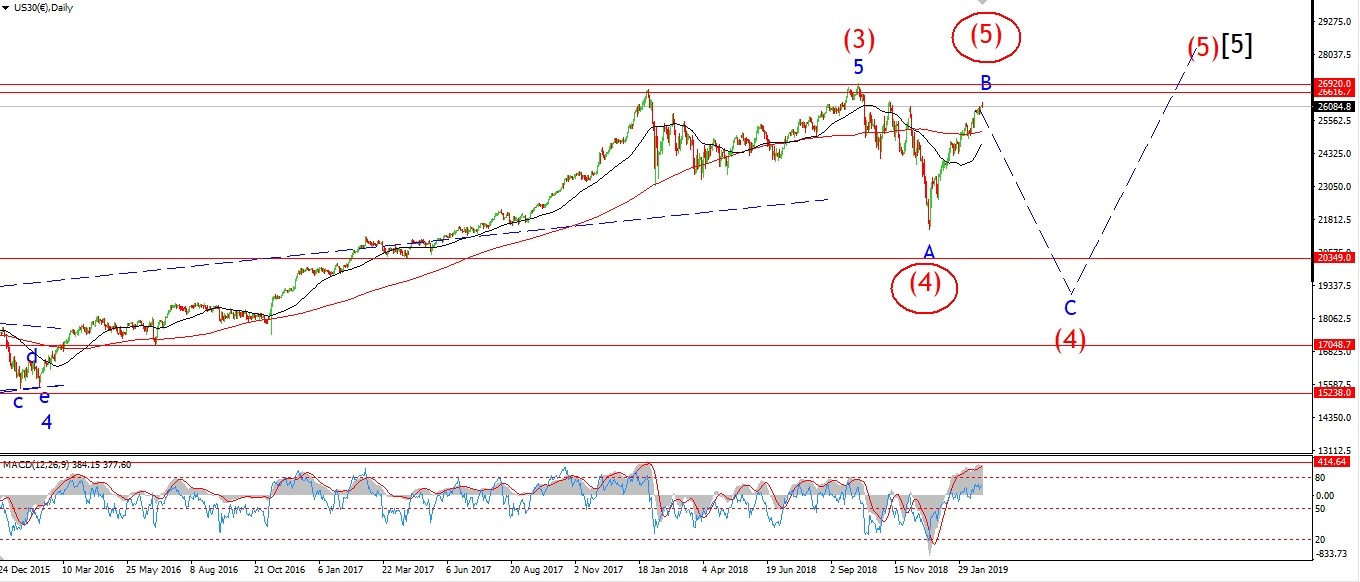 [/vc_column_text][/vc_column][/vc_row]
[vc_row][vc_column][vc_column_text]
The DOW is down today but the decline is unconvincing as a third wave just yet.
The price is approaching the lows again,
but so far we have not seen a break of 25611.
If this level breaks tomorrow it will signal that wave ‘iii’ is extending
If we see the rang continuing to contract,
that will suggest wave ‘iv’ is forming a triangle.
Either way,
we should expect to see a further drop to about 25250 again before the end of the week.
this will strengthen the bearish case that the top is in for wave ‘B’.
I have shown two alternate counts circled in red for the recent high.
Wave (5) would be counted as a failed fifth top.
Or wave (2) would be a large running flat off the late October lows.
Again all of these interpretations call for a significant drop over the next few months.
And all of those scenarios suggest a five wave decline will occur next.
With the target for wave ‘c’ at least in the 21000 area.
Tomorrow;
Watch for a break of 25611 to confirm wave ‘iii’ is extending.
[/vc_column_text][/vc_column][/vc_row]
[/_s2If]
[_s2If current_user_can(access_s2member_ccap_gold)]
[vc_row][vc_column][vc_separator border_width=”5″][/vc_column][/vc_row][vc_row][vc_column][vc_column_text]
GOLD
[/vc_column_text][/vc_column][/vc_row][vc_row][vc_column][vc_separator border_width=”5″][/vc_column][/vc_row][vc_row][vc_column width=”2/3″][vc_custom_heading text=”1 hr” use_theme_fonts=”yes”][vc_column_text]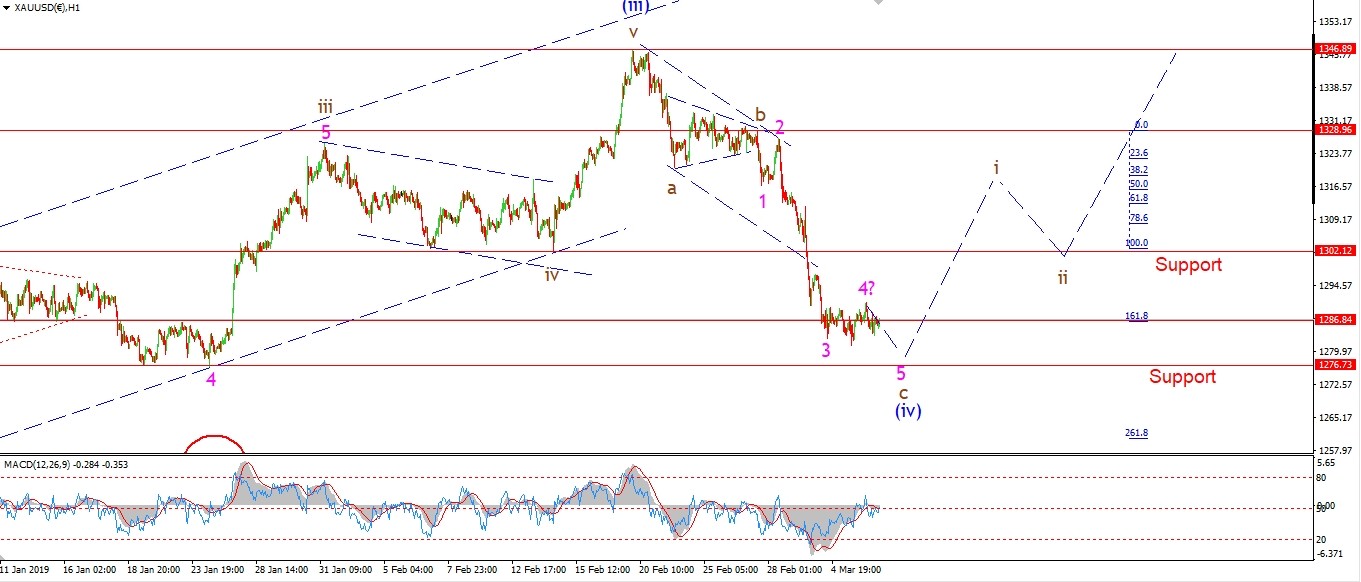 [/vc_column_text][/vc_column][vc_column width=”1/3″][vc_custom_heading text=”4 Hours” use_theme_fonts=”yes”][vc_column_text]
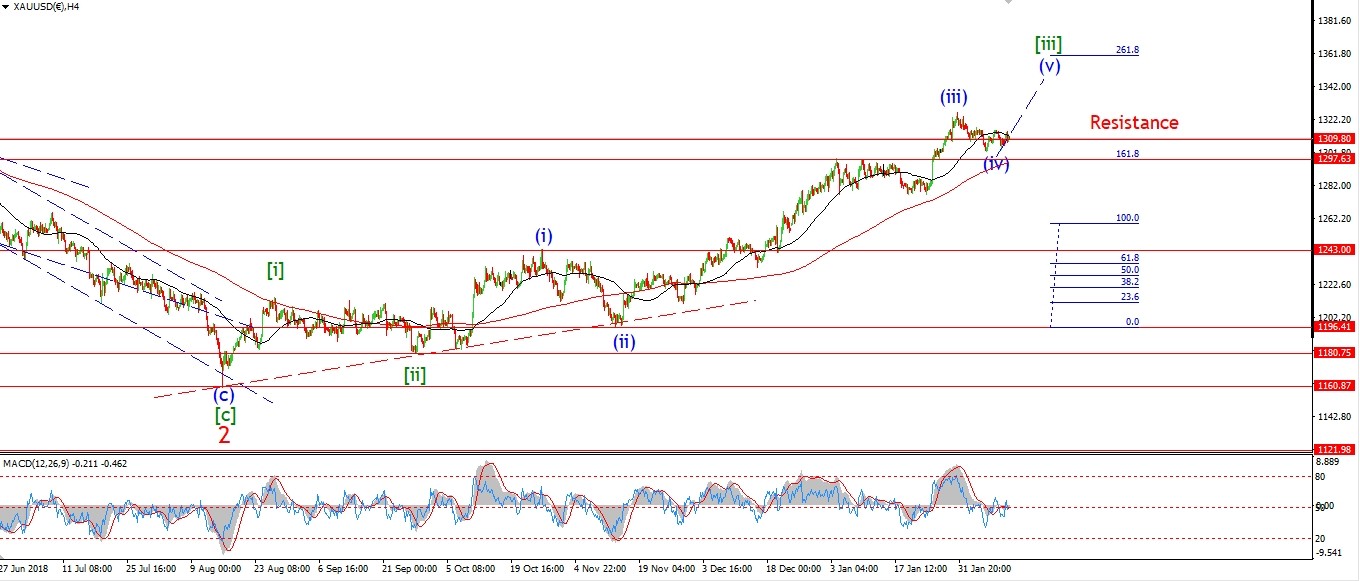 [/vc_column_text][vc_custom_heading text=”Daily” use_theme_fonts=”yes”][vc_column_text]
 [/vc_column_text][/vc_column][/vc_row]
[vc_row][vc_column][vc_column_text]
Wave ‘4’ may have completed at todays highs in an expanded flat pattern off the wave ‘3’ low.
This sideways action is corrective,
and we should see another low at about 1276 to close out the correction in wave ‘c’ and (iv) tomorrow.
This decline in wave (iv) must not break 1243 at the wave (i) high shown on the 4hr chart.
If that happens,
I will have to reassess the whole structure.
On the opposite side,
if we see a turn higher into wave (v) over the coming days,
and then wave (v) breaks 1375,
that will pretty much confirm the long term bullish outlook shown on the daily chart.
Tomorrow;
Watch for wave (iv) to complete at 1276 and turn higher again into wave ‘i’ of (v).
[/vc_column_text][/vc_column][/vc_row]
[/_s2If]
[_s2If current_user_can(access_s2member_ccap_crude)]
[vc_row][vc_column][vc_separator border_width=”5″][/vc_column][/vc_row][vc_row][vc_column][vc_column_text]
U.S CRUDE OIL
[/vc_column_text][/vc_column][/vc_row][vc_row][vc_column][vc_separator border_width=”5″][/vc_column][/vc_row][vc_row][vc_column width=”2/3″][vc_custom_heading text=”1 hr” use_theme_fonts=”yes”][vc_column_text]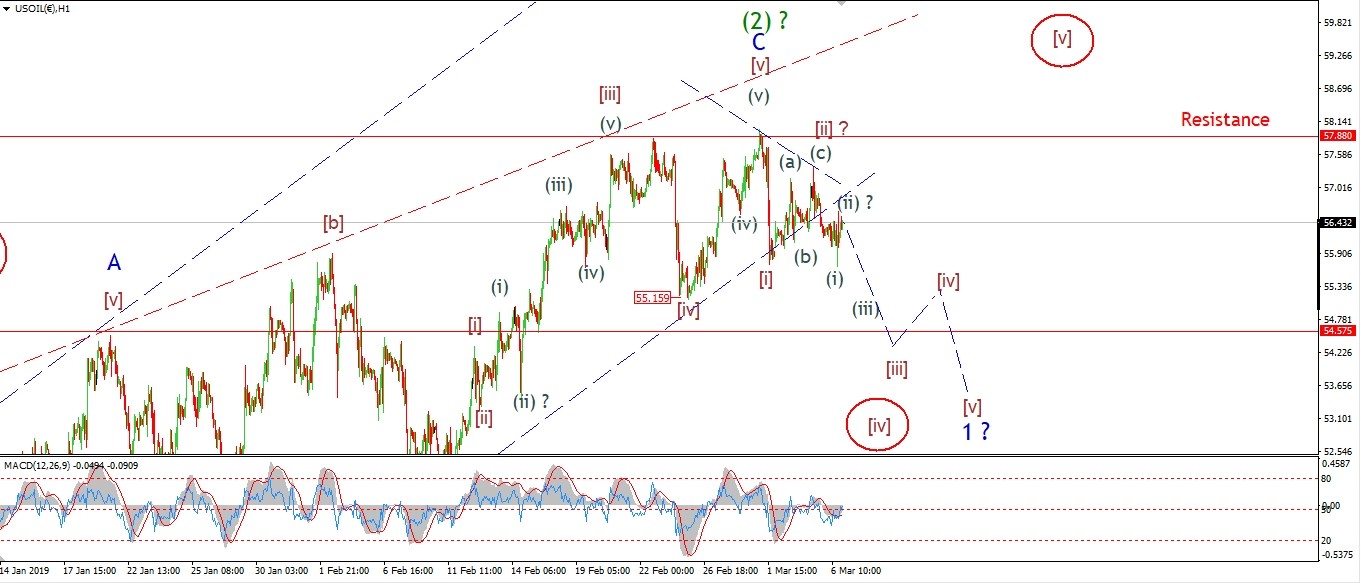 [/vc_column_text][/vc_column][vc_column width=”1/3″][vc_custom_heading text=”4 Hours” use_theme_fonts=”yes”][vc_column_text]
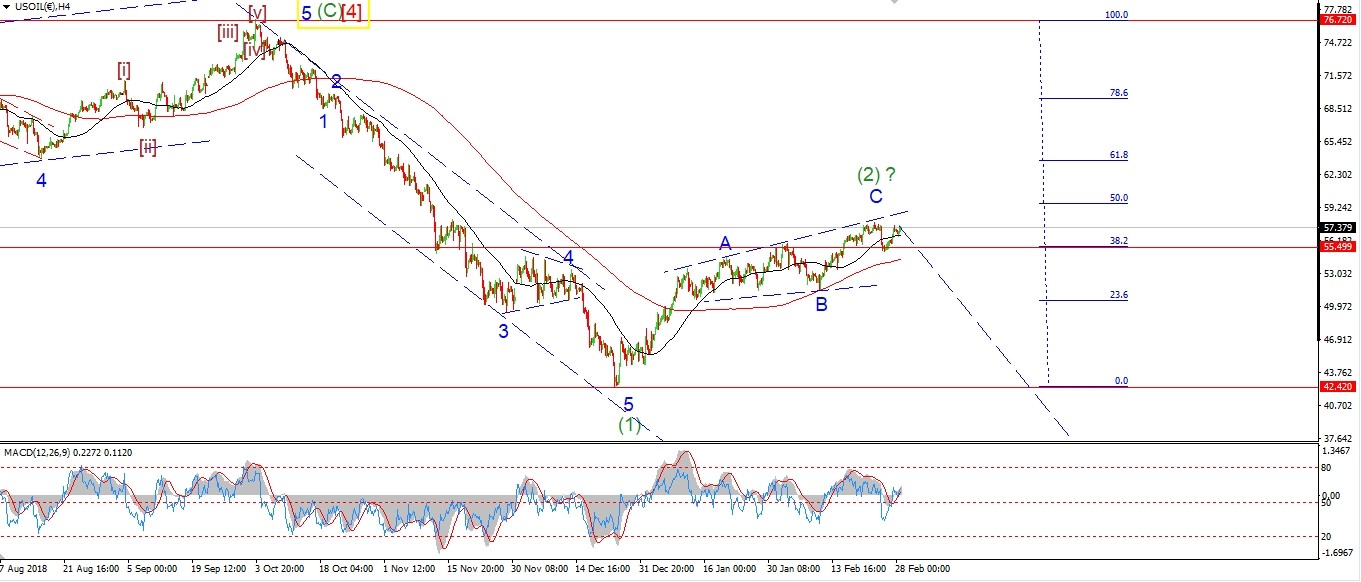 [/vc_column_text][vc_custom_heading text=”Daily” use_theme_fonts=”yes”][vc_column_text]
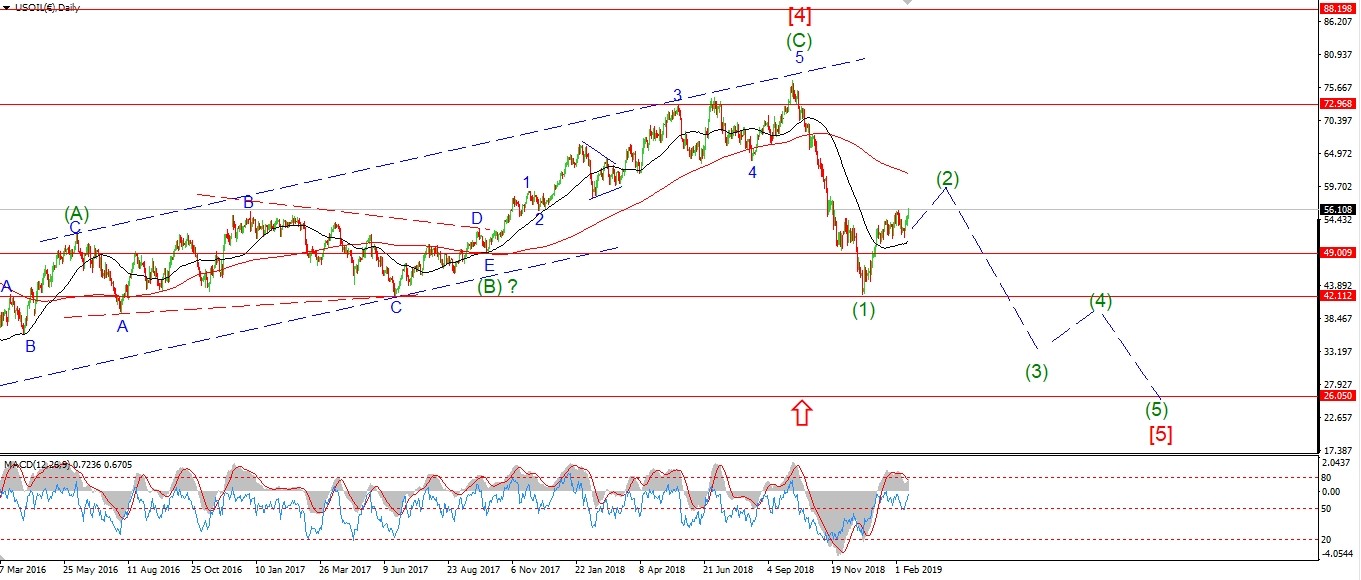 [/vc_column_text][/vc_column][/vc_row]
[vc_row][vc_column][vc_column_text]
The drop off the wave [ii] high is in five waves.
And the price has broken the previous wave [i] low.
I have labelled the decline as wave (i) of [iii],
wave (ii) is now correcting higher this evening.
This setup is very bearish at the moment,
and it suggests a sharp drop before Friday into wave (iii) of [iii].
And wave [iii] should break below the 54.00 handle again.
Also a break below 55.00 would rule out the alternate count.
Tomorrow;
Watch for wave [ii] to hold at 57.19 cash.
Wave (iii) of [iii] down should begin tomorrow.
[/vc_column_text][/vc_column][/vc_row]
[/_s2If]
[_s2If current_user_can(access_s2member_ccap_us10yr)]
[vc_row][vc_column][vc_separator border_width=”5″][/vc_column][/vc_row][vc_row][vc_column][vc_column_text]
US 10 yr Treasuries.
[/vc_column_text][/vc_column][/vc_row][vc_row][vc_column][vc_separator border_width=”5″][/vc_column][/vc_row][vc_row][vc_column width=”2/3″][vc_custom_heading text=”1 hr” use_theme_fonts=”yes”][vc_column_text]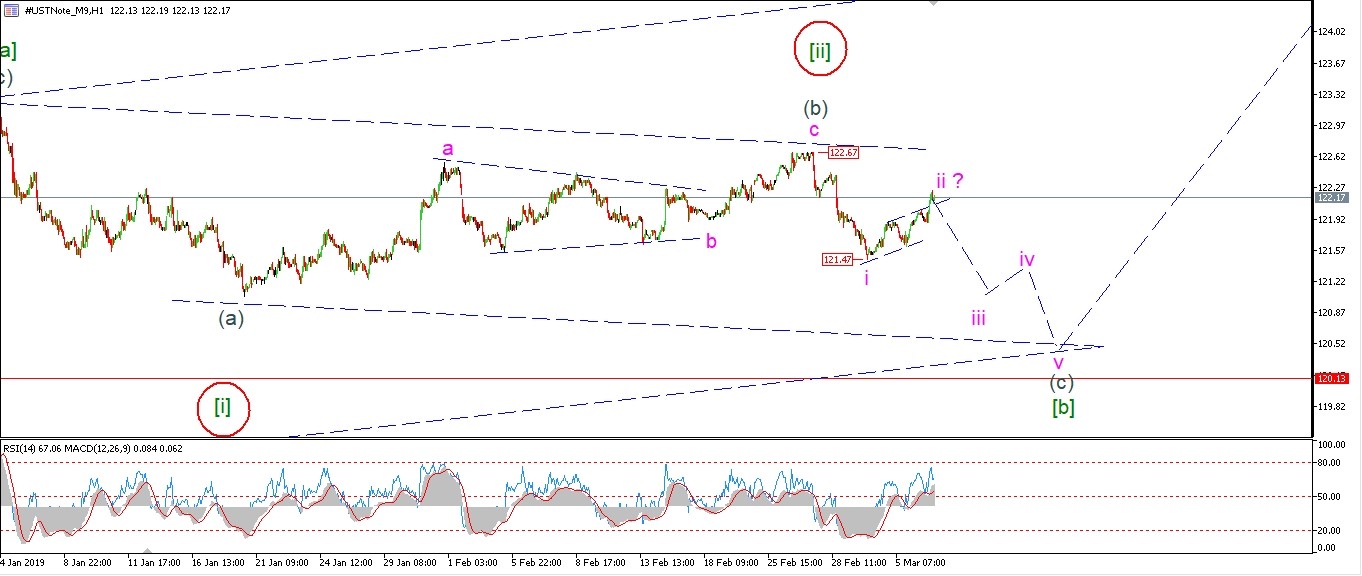 [/vc_column_text][/vc_column][vc_column width=”1/3″][vc_custom_heading text=”4 Hours” use_theme_fonts=”yes”][vc_column_text]
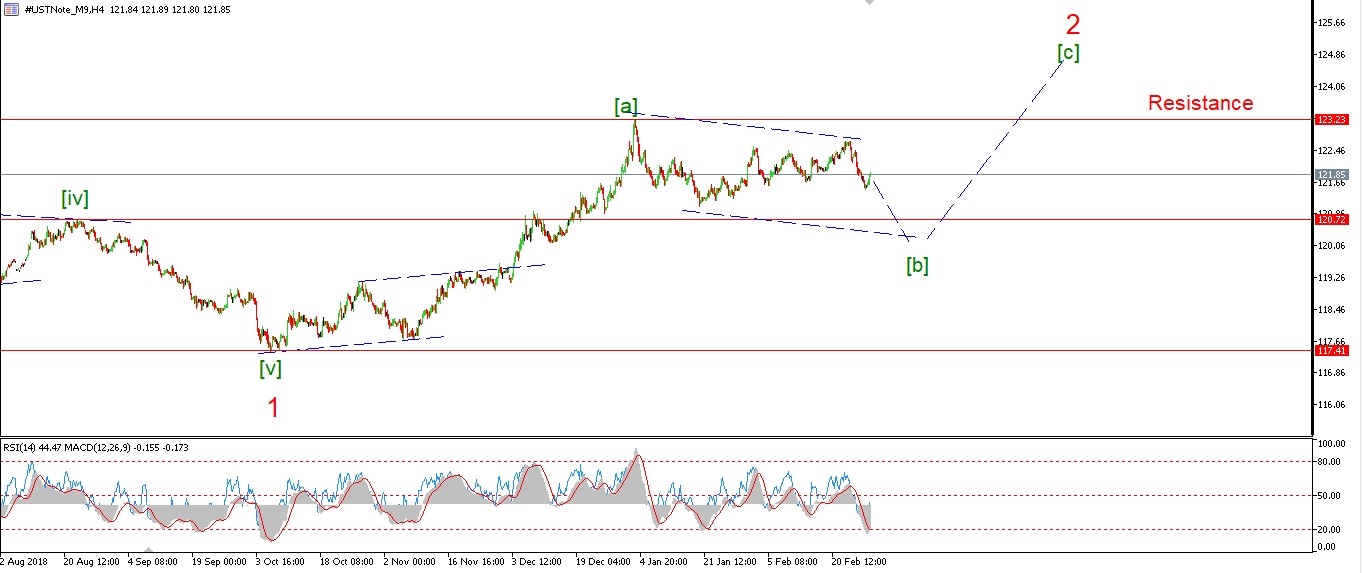 [/vc_column_text][vc_custom_heading text=”Daily” use_theme_fonts=”yes”][vc_column_text]
 [/vc_column_text][/vc_column][/vc_row]
[vc_row][vc_column][vc_column_text]
This [b] wave is dragging its heels deep in these days.
There has been no net movement in price in the 10YR since the beginning of January!
This period of calm should be countered soon enough though.
Price hit 122.23 at todays high.
This should complete wave ‘ii’ of (c),
and wave ‘iii’ down will be confirmed with a break of 121.47.
122.67 must hold at wave (b).
Tomorrow;
Watch for wave ‘iii’ of (c) to turn lower again towards the lower trend channel line.
[/vc_column_text][/vc_column][/vc_row]
[/_s2If]
[_s2If current_user_can(access_s2member_ccap_silver)]
[vc_row][vc_column][vc_separator border_width=”5″][/vc_column][/vc_row][vc_row][vc_column][vc_column_text]
SILVER
[/vc_column_text][/vc_column][/vc_row][vc_row][vc_column][vc_separator border_width=”5″][/vc_column][/vc_row][vc_row][vc_column width=”2/3″][vc_custom_heading text=”1 hr” use_theme_fonts=”yes”][vc_column_text]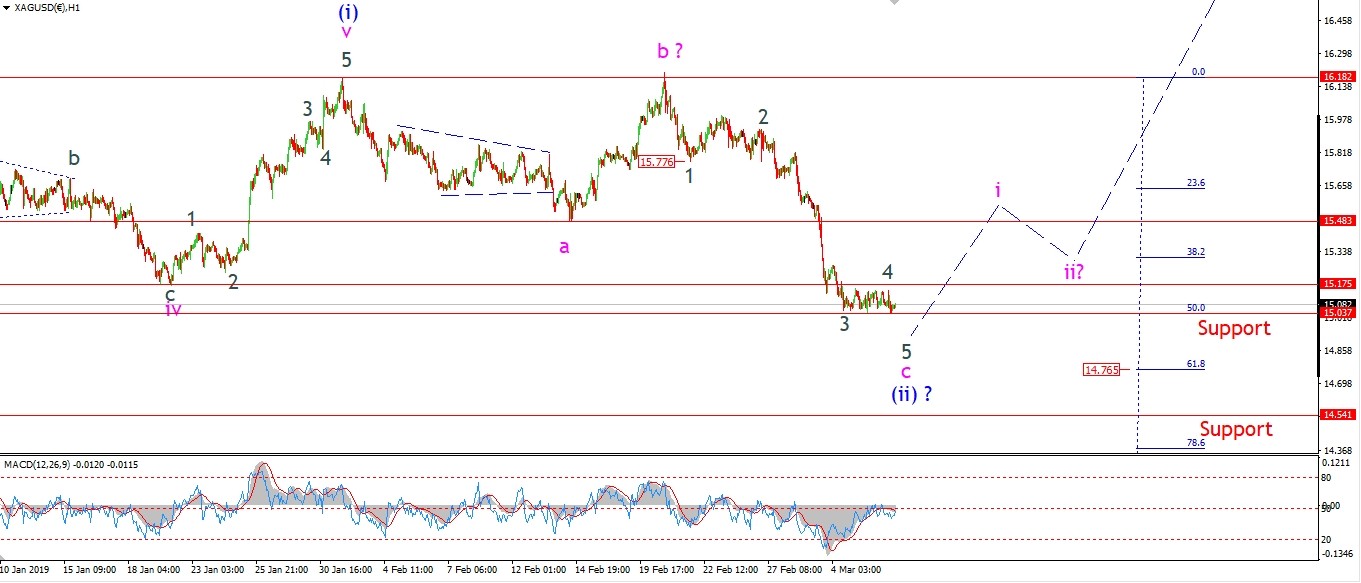 [/vc_column_text][/vc_column][vc_column width=”1/3″][vc_custom_heading text=”4 Hours” use_theme_fonts=”yes”][vc_column_text]
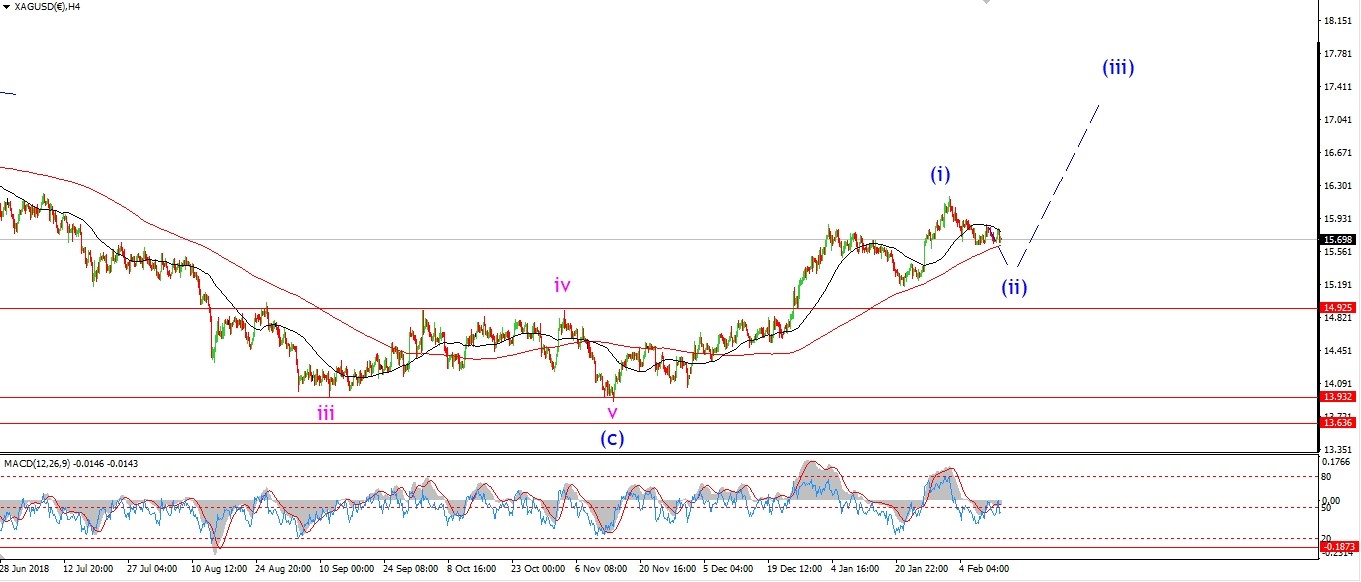 [/vc_column_text][vc_custom_heading text=”Daily” use_theme_fonts=”yes”][vc_column_text]
 [/vc_column_text][/vc_column][/vc_row]
[vc_row][vc_column][vc_column_text]
Silver has an unusually narrow trading range today.
But it looks like wave ‘4’ of ‘c’ is now complete
and wave ‘5’ will continue lower tomorrow to complete the larger wave (ii) blue.
The 62% retracement level now looks likely for wave ‘c’ to finish,
this lies at 14.76.
We should see reaction higher off that low to begin wave ‘i’ of (iii).
[/vc_column_text][/vc_column][/vc_row]
[/_s2If]
[_s2If current_user_can(access_s2member_ccap_sp500)]
[vc_row][vc_column][vc_separator border_width=”5″][/vc_column][/vc_row][vc_row][vc_column][vc_column_text]
S&P 500.
[/vc_column_text][/vc_column][/vc_row][vc_row][vc_column][vc_separator border_width=”5″][/vc_column][/vc_row][vc_row][vc_column width=”2/3″][vc_custom_heading text=”1 hr” use_theme_fonts=”yes”][vc_column_text]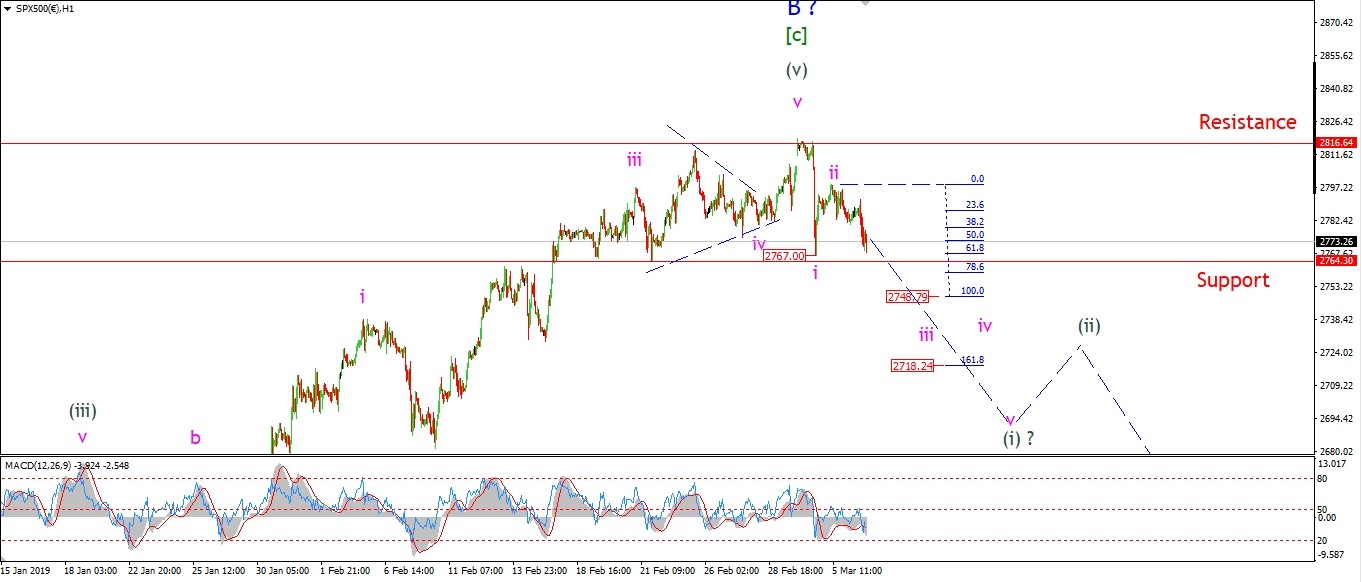 [/vc_column_text][/vc_column][vc_column width=”1/3″][vc_custom_heading text=”4 Hours” use_theme_fonts=”yes”][vc_column_text]
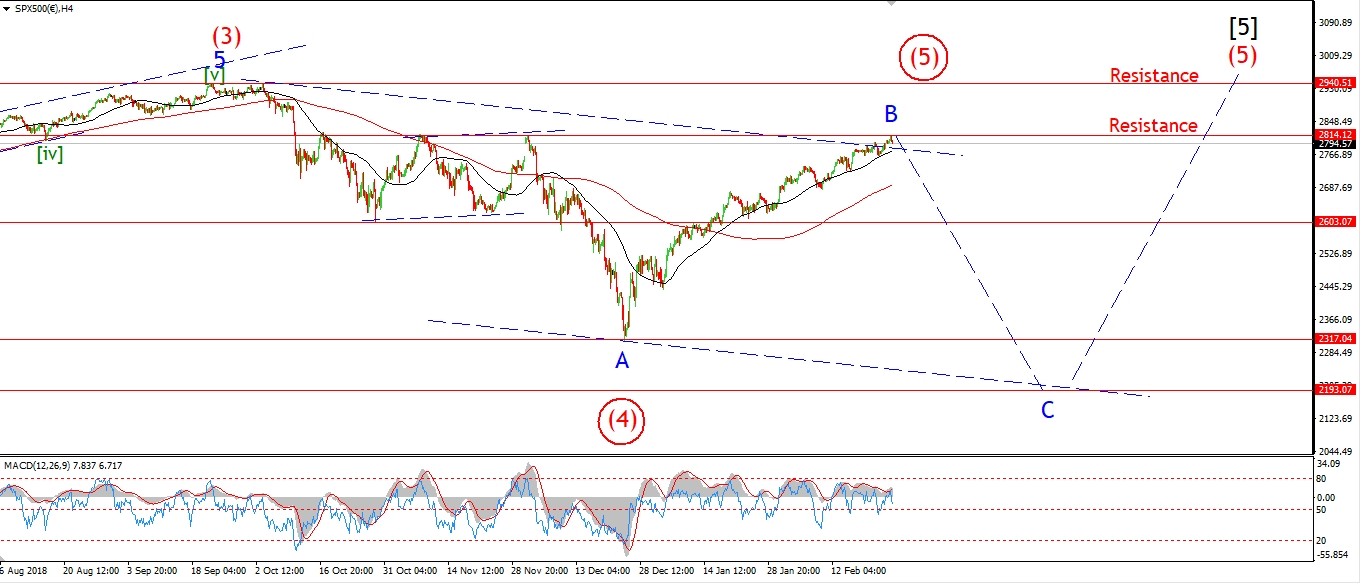 [/vc_column_text][vc_custom_heading text=”Daily” use_theme_fonts=”yes”][vc_column_text]
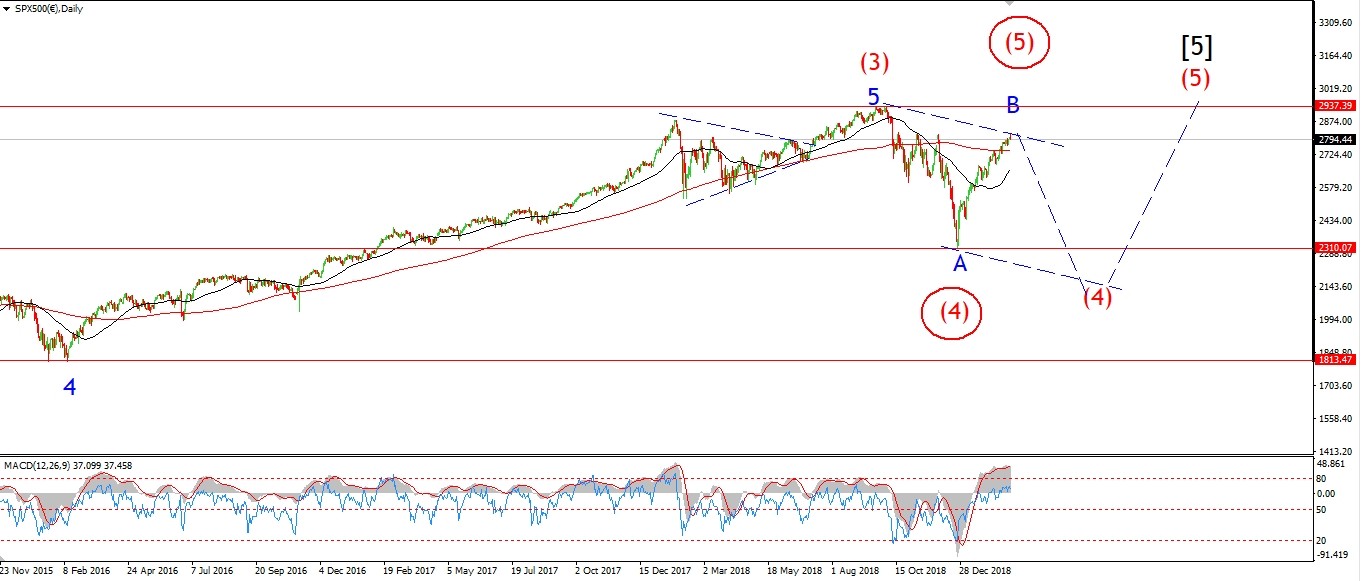 [/vc_column_text][/vc_column][/vc_row]
[vc_row][vc_column][vc_column_text]
Prices are lower coming into the close again this evening.
I am labelling this decline as the beginning of wave ‘iii’ of (i) lower.
We are still looking at a three wave decline off the high.
So wave ‘iii’ needs to drop sharply over the coming sessions
in order to push this wave structure closer to an impulse wave (i).
The wave ‘ii’ high lies at 2796 cash,
if this level breaks again it will invalidate the bearish setup,
so 2796 must hold.
Tomorrow;
Watch for wave ‘iii’ to break 2767 and continue towards 2748 at a minimum.
This is wave wave ‘iii’ reaches equality with wave ‘i’.
[/vc_column_text][/vc_column][/vc_row]
[/_s2If]
[vc_row][vc_column][vc_column_text]
[/vc_column_text][/vc_column][/vc_row]
[vc_row][vc_column][vc_separator border_width=”5″][/vc_column][/vc_row]