
[vc_row][vc_column][vc_separator border_width=”5″][/vc_column][/vc_row]
[vc_row][vc_column][vc_column_text]
Good evening all.
This is a list of the sales of stock held by insiders last week.
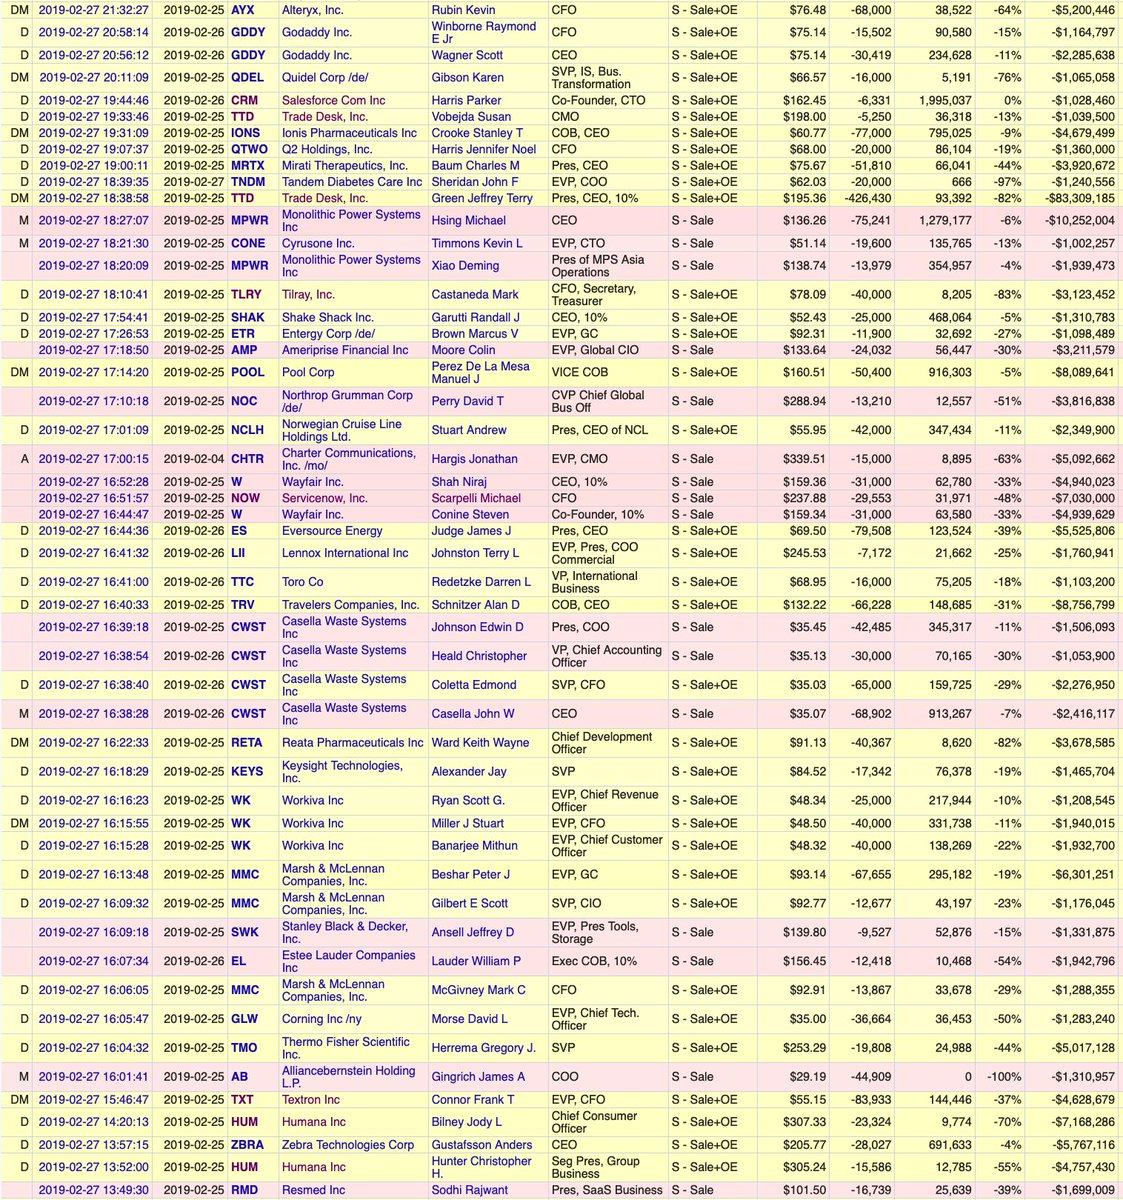
Now why would corporate insiders be selling their holdings if they believed the prospects for the companies were looking good?
I mean this is a bull market right?
So these guys should be holding onto their stock?
Straight down to it tonight.
[/vc_column_text][/vc_column][/vc_row]
[_s2If current_user_can(access_s2member_ccap_eurusd)]
[vc_row][vc_column][vc_separator border_width=”5″][/vc_column][/vc_row]
[vc_row][vc_column][vc_column_text]
EURUSD
[/vc_column_text][/vc_column][/vc_row]
[vc_row][vc_column][vc_separator border_width=”5″][/vc_column][/vc_row][vc_row][vc_column width=”2/3″][vc_custom_heading text=”1 hr” use_theme_fonts=”yes”][vc_column_text] [/vc_column_text][/vc_column][vc_column width=”1/3″][vc_custom_heading text=”4 Hours” use_theme_fonts=”yes”][vc_column_text]
 [/vc_column_text][vc_custom_heading text=”Daily” use_theme_fonts=”yes”][vc_column_text]
 [/vc_column_text][/vc_column][/vc_row]
[vc_row][vc_column][vc_column_text]
After a pretty subdued days trading,
EURUSD has completed wave ‘3’ of ‘i’ lower.
Wave ‘i’ needs one more subdivision to complete a full five wave pattern off the wave (ii) high.
A break of support at 1.1230 would be all the better as we could then confirm wave (iii) down.
Tomorrow;
Wave ‘4’ and ‘5’ should take another step lower towards support to close out wave ‘i’.
The high at 1.1419 must hold.
[/vc_column_text][/vc_column][/vc_row]
[/_s2If]
[_s2If current_user_can(access_s2member_ccap_gbpusd)]
[vc_row][vc_column][vc_separator border_width=”5″][/vc_column][/vc_row][vc_row][vc_column][vc_column_text]
GBPUSD
[/vc_column_text][/vc_column][/vc_row][vc_row][vc_column][vc_separator border_width=”5″][/vc_column][/vc_row][vc_row][vc_column width=”2/3″][vc_custom_heading text=”1 hr” use_theme_fonts=”yes”][vc_column_text]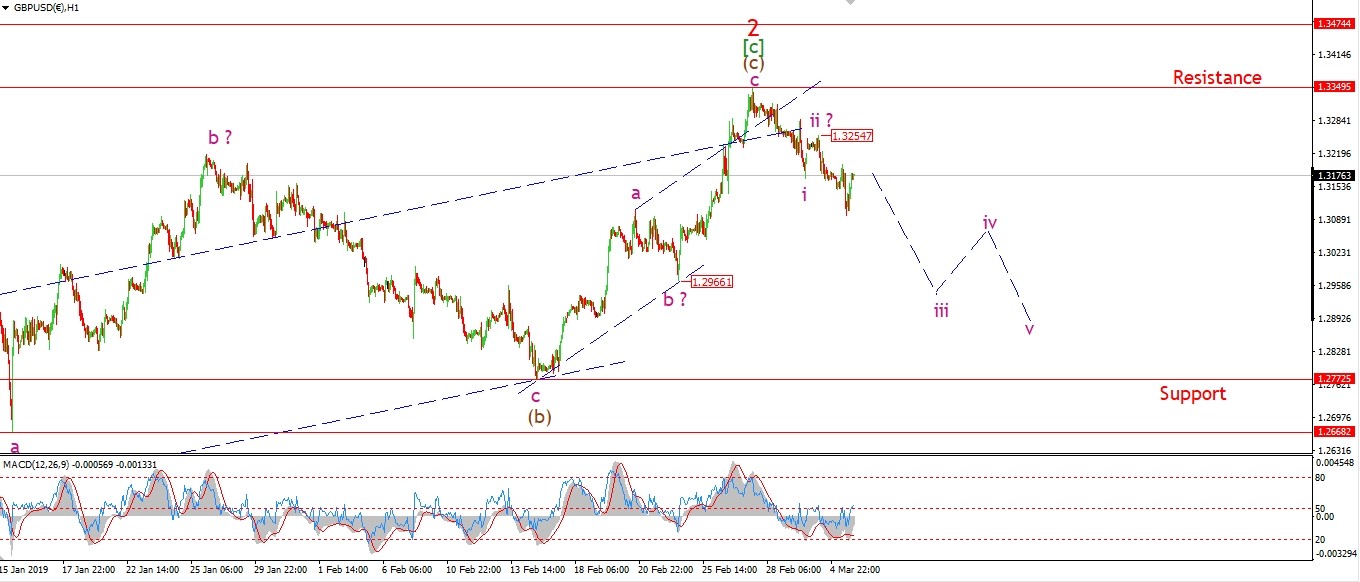 [/vc_column_text][/vc_column][vc_column width=”1/3″][vc_custom_heading text=”4 Hours” use_theme_fonts=”yes”][vc_column_text]
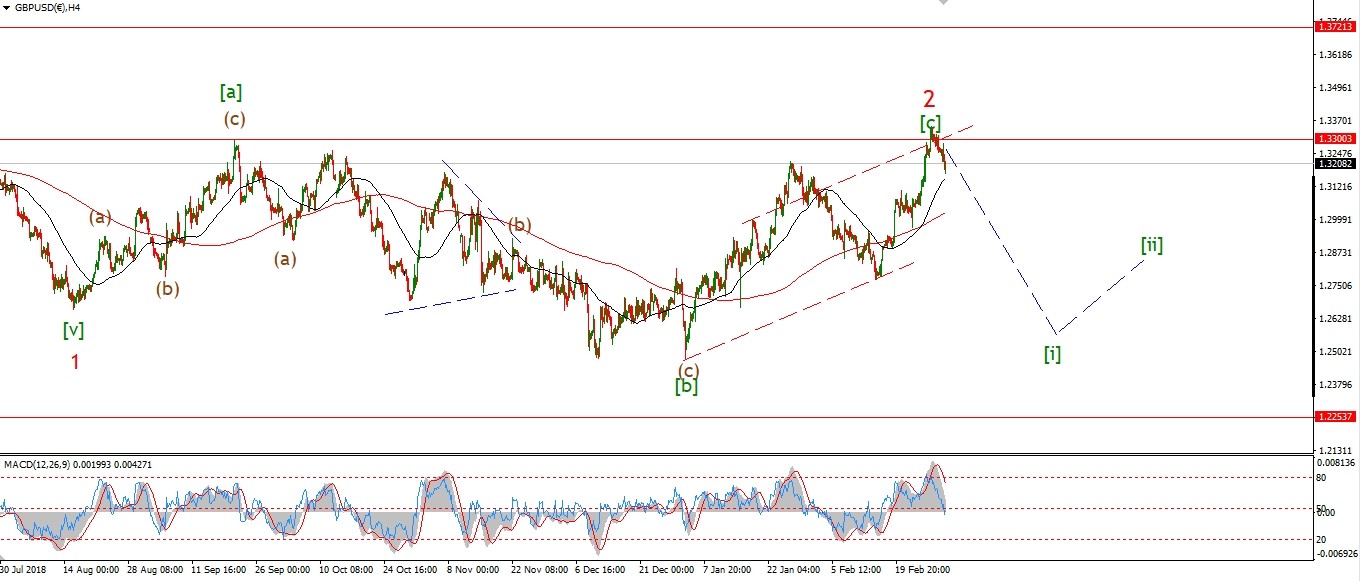 [/vc_column_text][vc_custom_heading text=”Daily” use_theme_fonts=”yes”][vc_column_text]
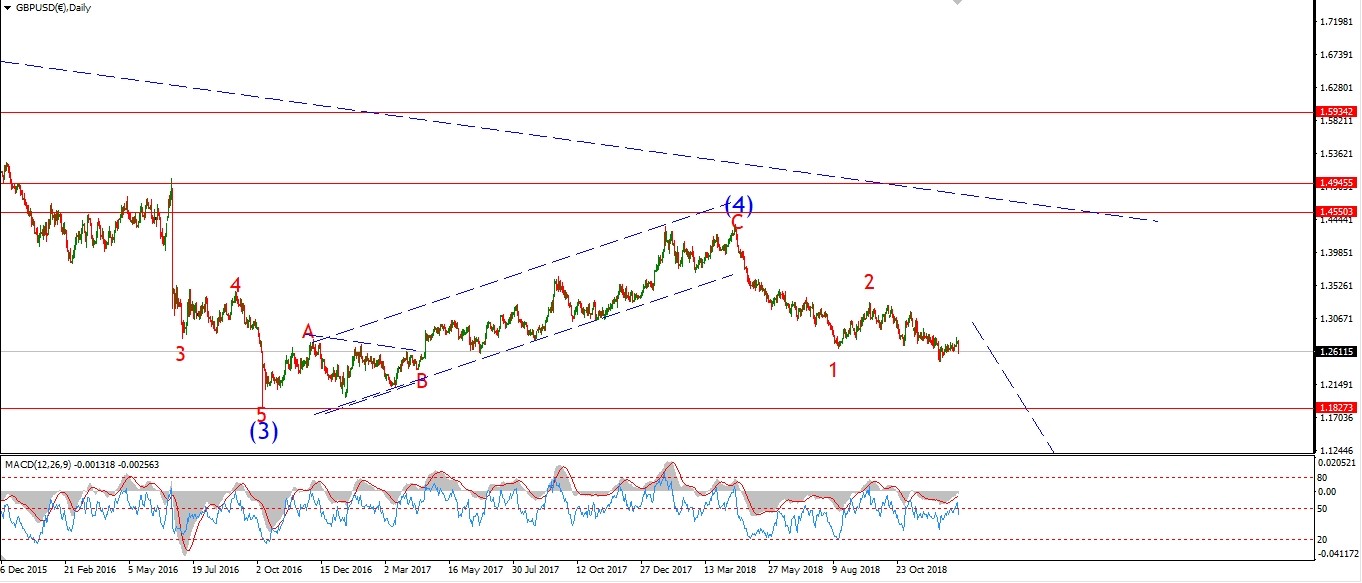 [/vc_column_text][/vc_column][/vc_row]
[vc_row][vc_column][vc_column_text]
The price has fallen again today,
but so far the decline fits a three wave move rather than an impulse pattern.
So cable must continue to fall further from here to create that five wave pattern that I’m looking for.
Tomorrow;
I have labelled Mondays early high as wave ‘ii’ at 1.3254.
Watch for this level to hold as a possible wave ‘iii’ down develops.
A break of 1.2966 will confirm wave ‘iii’.
[/vc_column_text][/vc_column][/vc_row]
[/_s2If]
[_s2If current_user_can(access_s2member_ccap_usdjpy)]
[vc_row][vc_column][vc_separator border_width=”5″][/vc_column][/vc_row][vc_row][vc_column][vc_column_text]
USDJPY
[/vc_column_text][/vc_column][/vc_row][vc_row][vc_column][vc_separator border_width=”5″][/vc_column][/vc_row][vc_row][vc_column width=”2/3″][vc_custom_heading text=”1 hr” use_theme_fonts=”yes”][vc_column_text]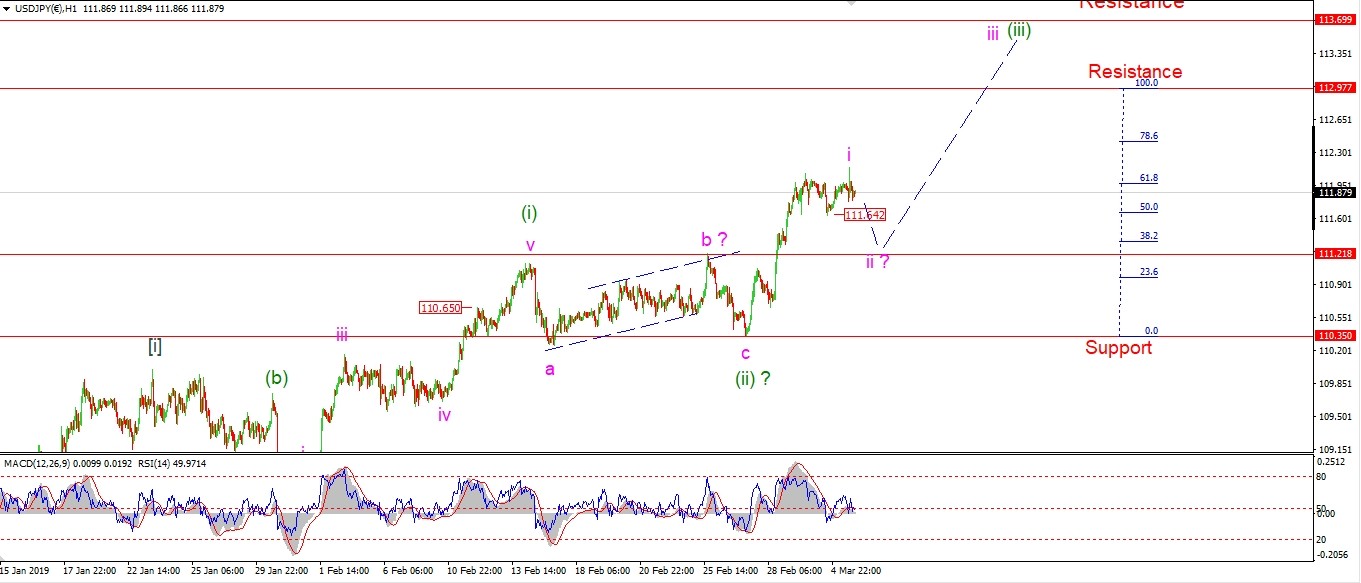 [/vc_column_text][/vc_column][vc_column width=”1/3″][vc_custom_heading text=”4 Hours” use_theme_fonts=”yes”][vc_column_text]
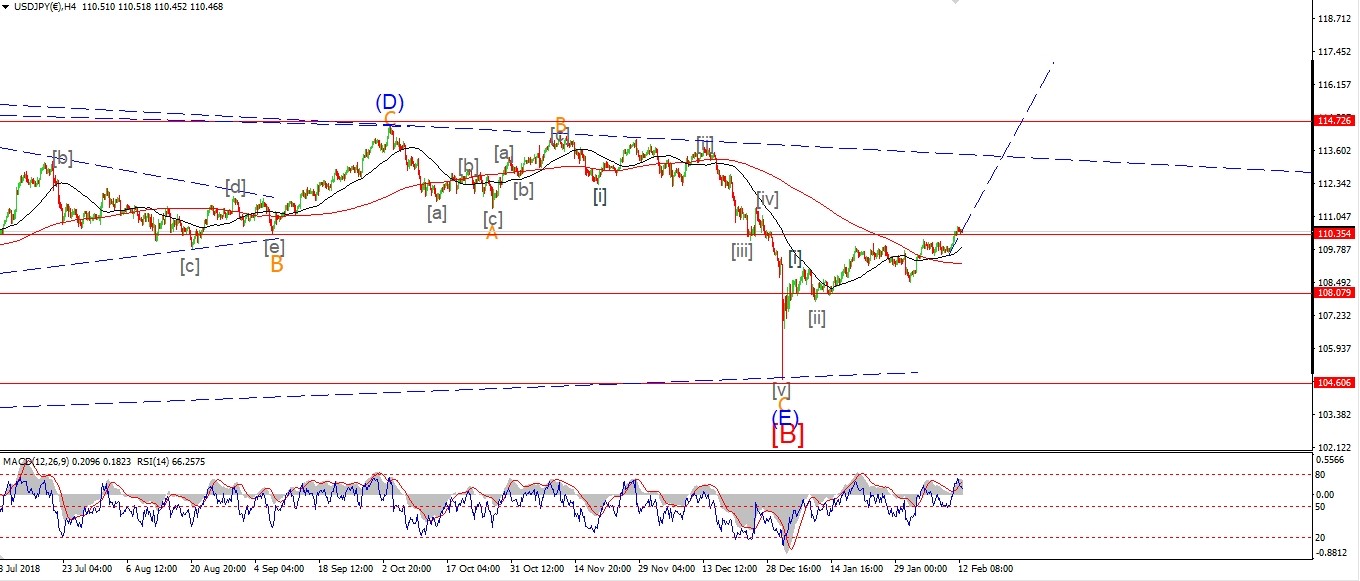 [/vc_column_text][vc_custom_heading text=”Daily” use_theme_fonts=”yes”][vc_column_text]
 [/vc_column_text][/vc_column][/vc_row]
[vc_row][vc_column][vc_column_text]
The price rose to a new high today
which confirms the drop yesterday as a small internal fourth wave within wave ‘i’ pink.
I can see a clear five waves up in wave ‘i’ now,
and the price has again dropped off that high,
so wave ‘ii’ is now likely underway.
Tomorrow;
Wave ‘ii’ should correct to between 111.60 and 111.20.
And support at 110.35 must hold.
[/vc_column_text][/vc_column][/vc_row]
[/_s2If]
[_s2If current_user_can(access_s2member_ccap_dow_jones)]
[vc_row][vc_column][vc_separator border_width=”5″][/vc_column][/vc_row][vc_row][vc_column][vc_column_text]
DOW JONES INDUSTRIALS
[/vc_column_text][/vc_column][/vc_row][vc_row][vc_column][vc_separator border_width=”5″][/vc_column][/vc_row][vc_row][vc_column width=”2/3″][vc_custom_heading text=”1 hr” use_theme_fonts=”yes”][vc_column_text]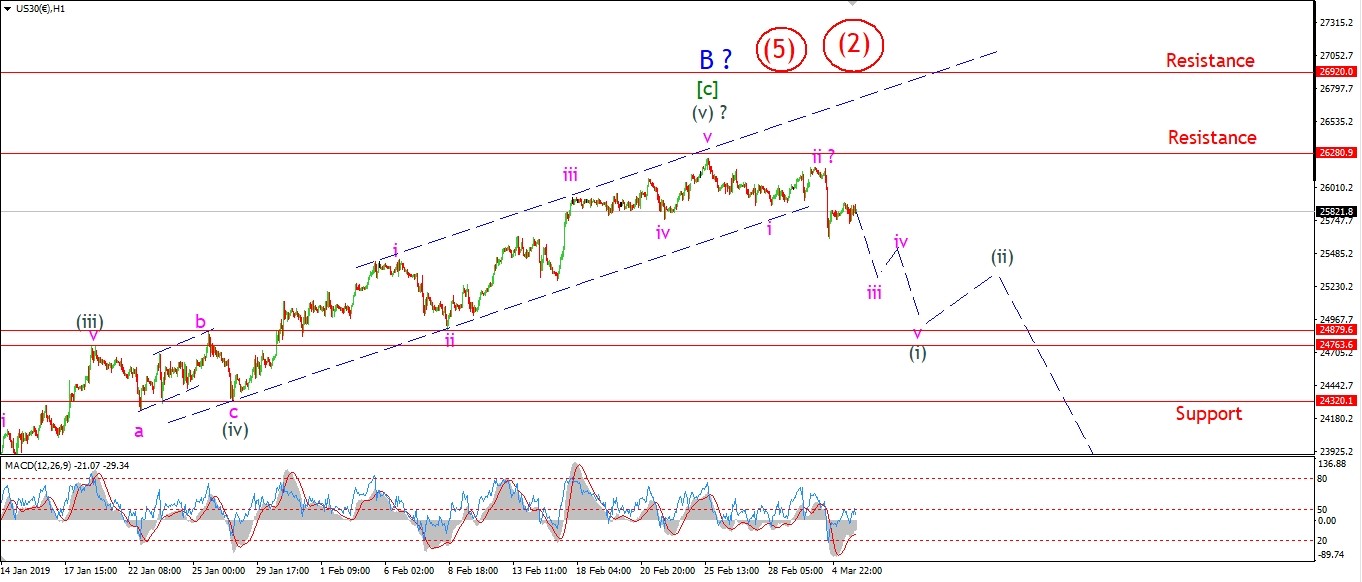 [/vc_column_text][/vc_column][vc_column width=”1/3″][vc_custom_heading text=”4 Hours” use_theme_fonts=”yes”][vc_column_text]
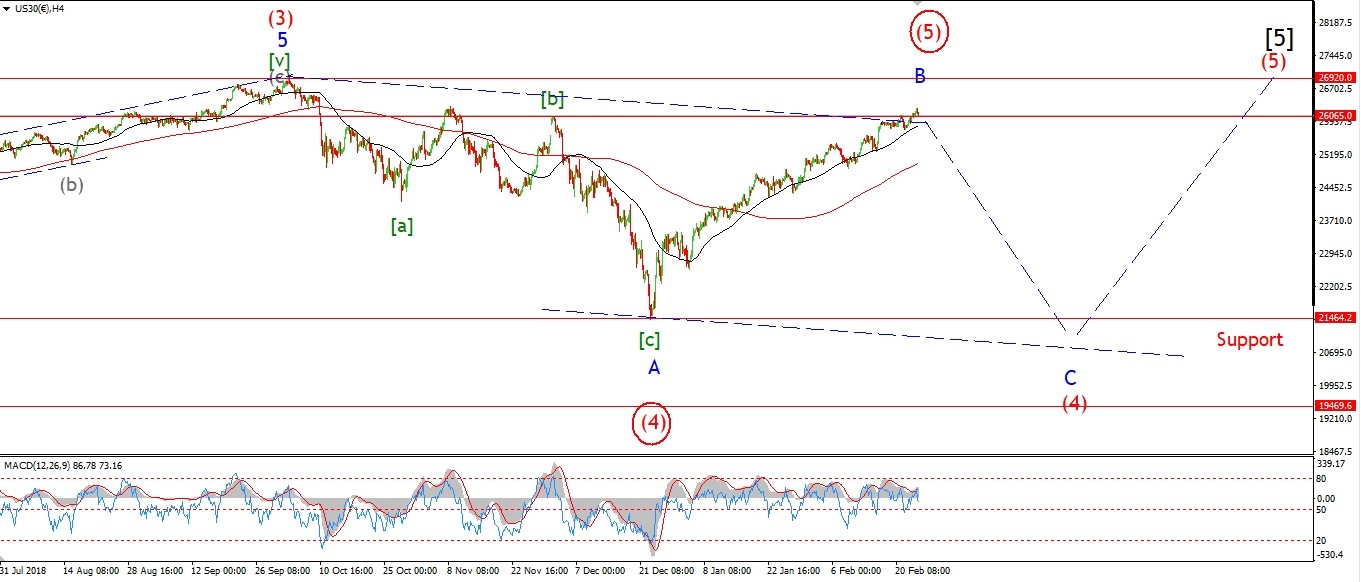 [/vc_column_text][vc_custom_heading text=”Daily” use_theme_fonts=”yes”][vc_column_text]
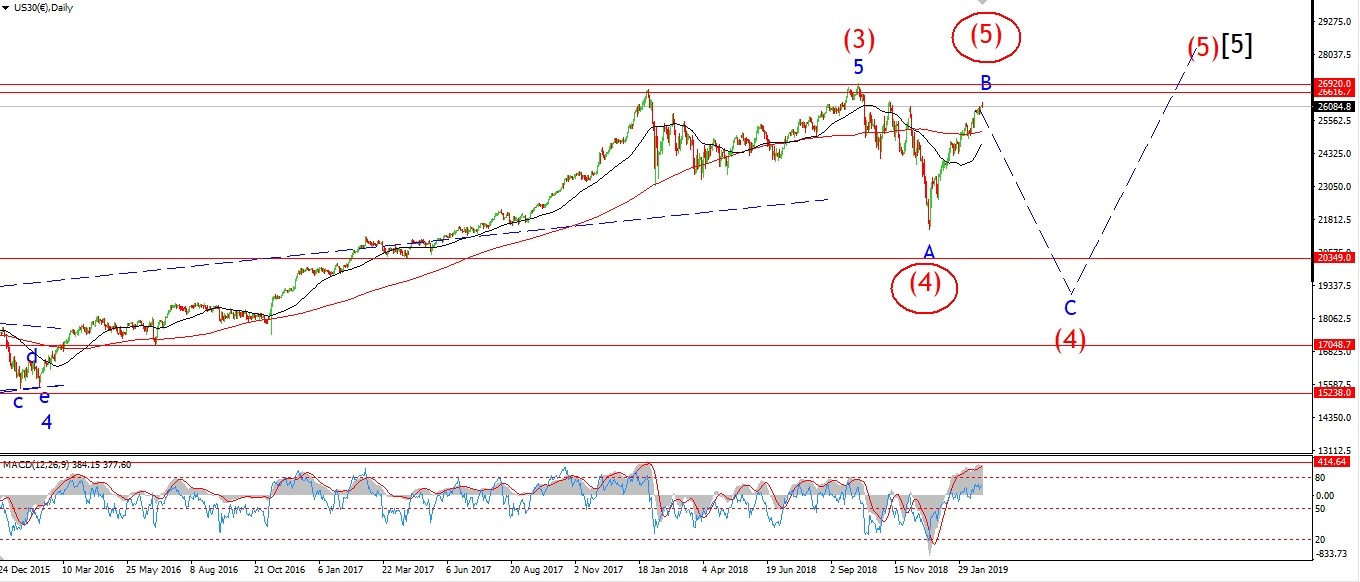 [/vc_column_text][/vc_column][/vc_row]
[vc_row][vc_column][vc_column_text]
The DOW seems to be correcting higher today which is good for the bearish count.
The correction seems to be a small fourth wave higher within wave ‘iii’.
If so,
then we should see a sharp reversal again tomorrow
and this will complete a clear five wave pattern within wave ‘iii’ down.
Tomorrow;
watch for a break of 25600 again to complete wave ‘iii’ down.
wave ‘iv’ should then correct sideways again
before one last drop to support in wave ‘v’ of (i).
This week could prove pivotal for the stock market
if we can build an impulse wave lower to end the rally off the December lows.
Wave ‘C’ or wave (3) beckons us downwards now!
[/vc_column_text][/vc_column][/vc_row]
[/_s2If]
[_s2If current_user_can(access_s2member_ccap_gold)]
[vc_row][vc_column][vc_separator border_width=”5″][/vc_column][/vc_row][vc_row][vc_column][vc_column_text]
GOLD
[/vc_column_text][/vc_column][/vc_row][vc_row][vc_column][vc_separator border_width=”5″][/vc_column][/vc_row][vc_row][vc_column width=”2/3″][vc_custom_heading text=”1 hr” use_theme_fonts=”yes”][vc_column_text]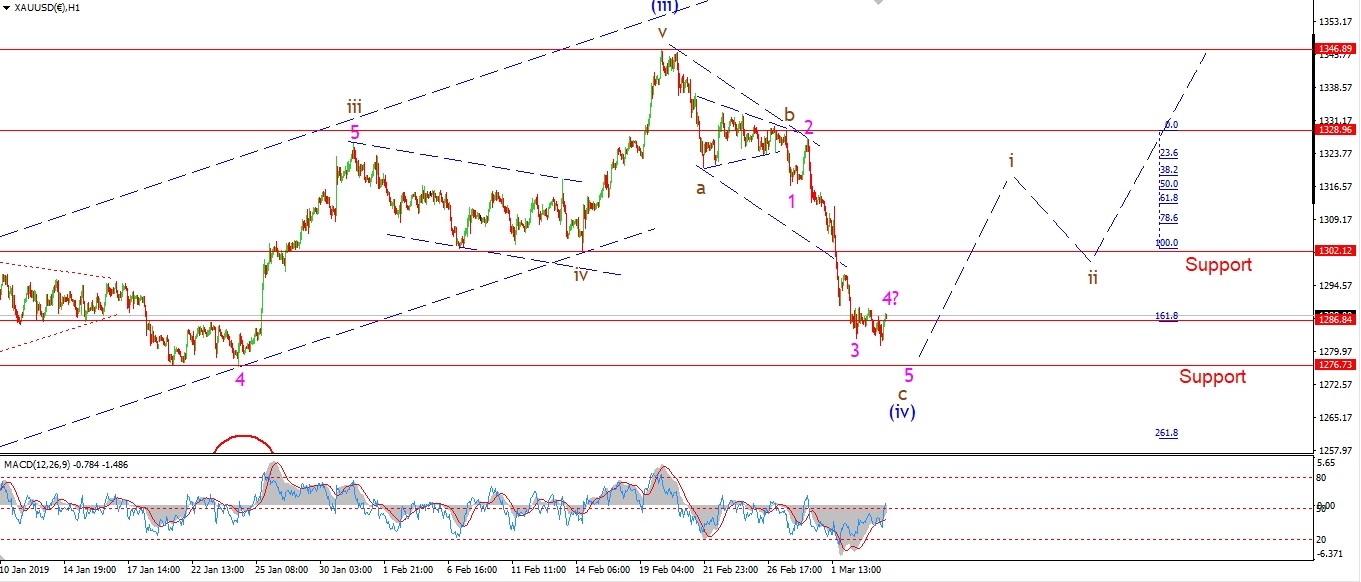 [/vc_column_text][/vc_column][vc_column width=”1/3″][vc_custom_heading text=”4 Hours” use_theme_fonts=”yes”][vc_column_text]
 [/vc_column_text][vc_custom_heading text=”Daily” use_theme_fonts=”yes”][vc_column_text]
 [/vc_column_text][/vc_column][/vc_row]
[vc_row][vc_column][vc_column_text]
GOLD is finding support at the 1286 level today,
but the action off the lows is not in the least bit impulsive to signal wave ‘i’ up yet.
We could be seeing a flat in wave ‘4’ of ‘c’ today,
This accounts for the corrective nature,
and it suggests one more drop into wave ‘5’ of ‘c’ to complete the larger wave (iv).
Tomorrow;
Watch for a drop into 1276 to complete wave ‘c’ and wave (iv).
Once wave (iv) completes,
wave ‘i’ should then turn up for the remainder of the week.
[/vc_column_text][/vc_column][/vc_row]
[/_s2If]
[_s2If current_user_can(access_s2member_ccap_crude)]
[vc_row][vc_column][vc_separator border_width=”5″][/vc_column][/vc_row][vc_row][vc_column][vc_column_text]
U.S CRUDE OIL
[/vc_column_text][/vc_column][/vc_row][vc_row][vc_column][vc_separator border_width=”5″][/vc_column][/vc_row][vc_row][vc_column width=”2/3″][vc_custom_heading text=”1 hr” use_theme_fonts=”yes”][vc_column_text]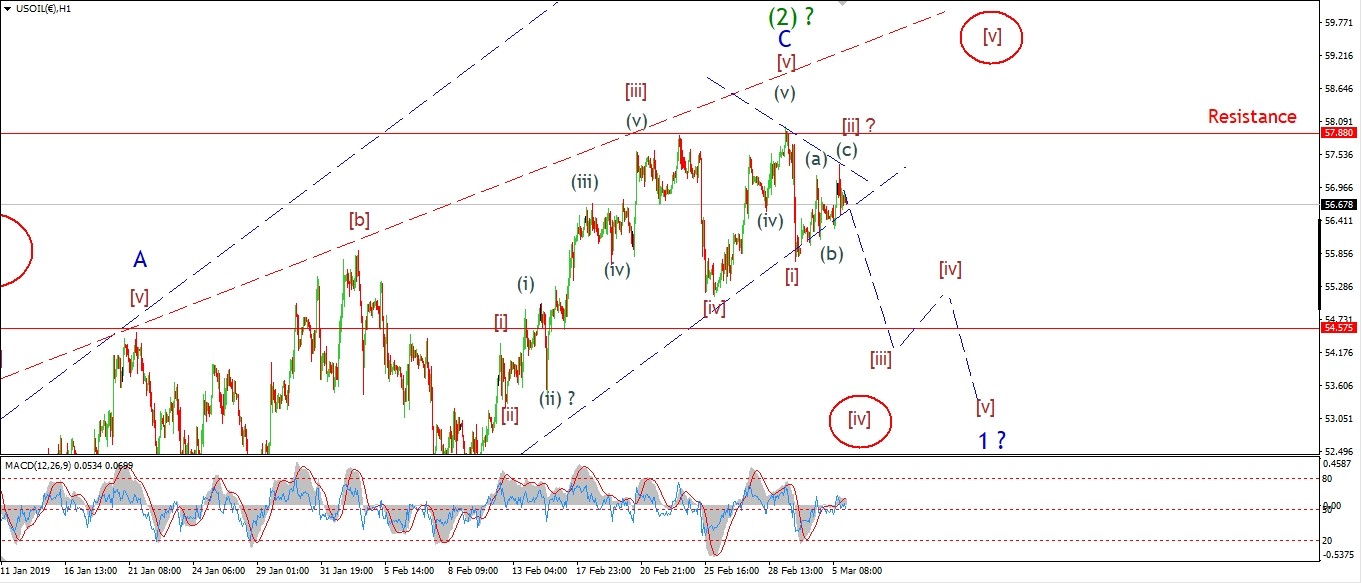 [/vc_column_text][/vc_column][vc_column width=”1/3″][vc_custom_heading text=”4 Hours” use_theme_fonts=”yes”][vc_column_text]
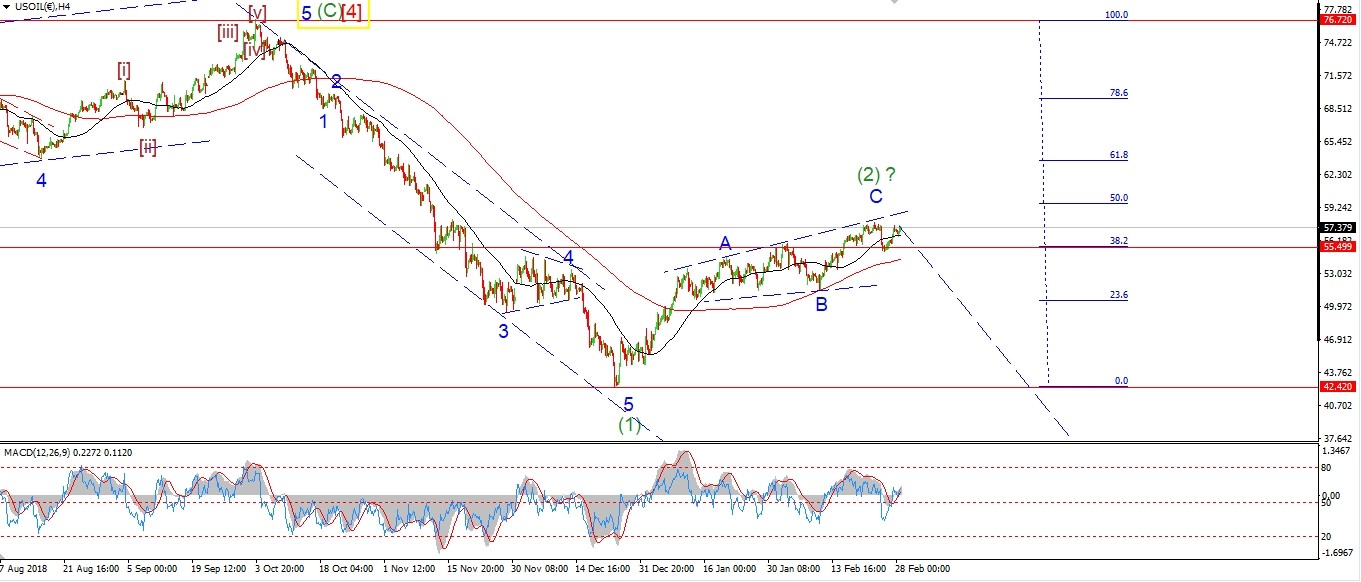 [/vc_column_text][vc_custom_heading text=”Daily” use_theme_fonts=”yes”][vc_column_text]
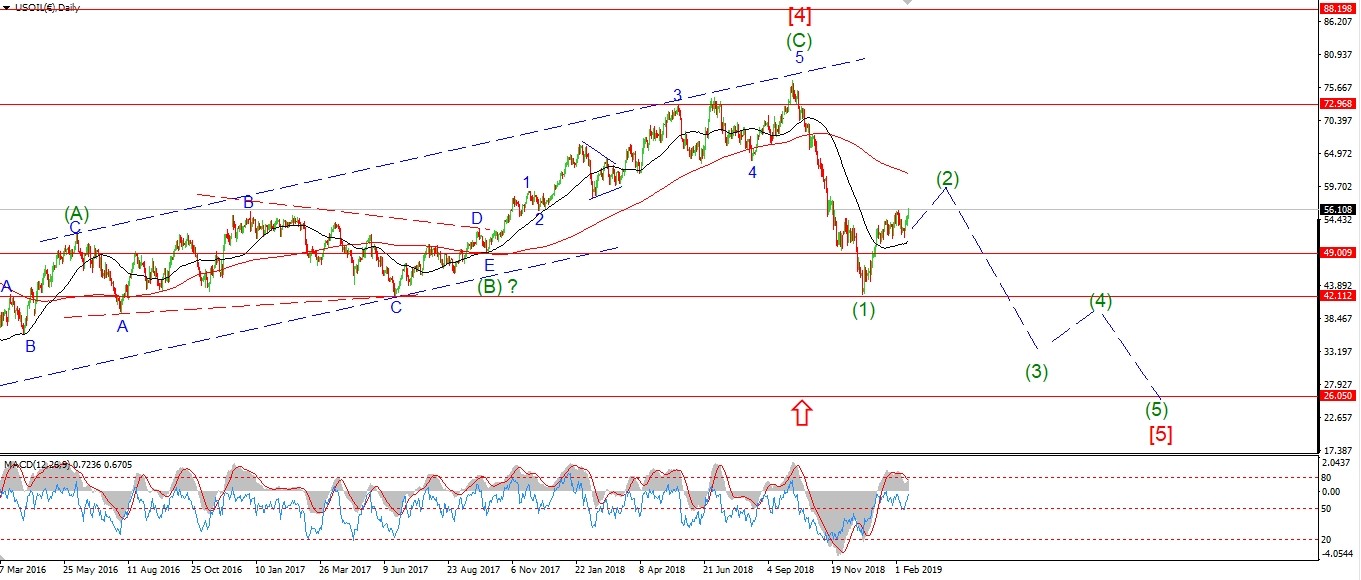 [/vc_column_text][/vc_column][/vc_row]
[vc_row][vc_column][vc_column_text]
Crude oil continued to correct higher today
and then the evening session snapped back lower to end the day more or less flat.
The rise off wave [i] is in three waves,
so it still counts as [ii].
This evenings drop then should begin wave [iii] down.
If so,
we should see a break of 56.00 again tomorrow to signal wave [iii] has begun.
The range contraction over the last week can also be viewed as a contracting triangle.
If that plays out we will see one more high to complete wave [v] of ‘C’ before the next leg down begins.
I have show that alternate circled in red.
Tomorrow;
Todays high in wave [ii] at 57.36 must hold.
Watch for a break of 56.00 again to signal that wave [iii] down has begun.
[/vc_column_text][/vc_column][/vc_row]
[/_s2If]
[_s2If current_user_can(access_s2member_ccap_us10yr)]
[vc_row][vc_column][vc_separator border_width=”5″][/vc_column][/vc_row][vc_row][vc_column][vc_column_text]
US 10 yr Treasuries.
[/vc_column_text][/vc_column][/vc_row][vc_row][vc_column][vc_separator border_width=”5″][/vc_column][/vc_row][vc_row][vc_column width=”2/3″][vc_custom_heading text=”1 hr” use_theme_fonts=”yes”][vc_column_text]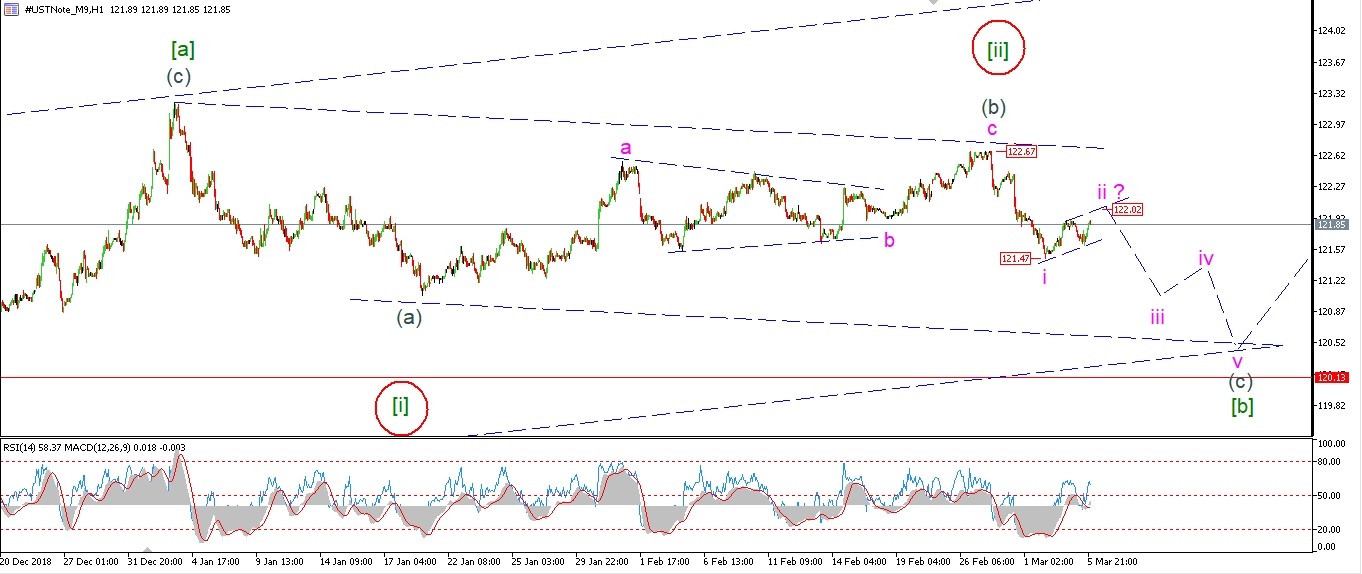 [/vc_column_text][/vc_column][vc_column width=”1/3″][vc_custom_heading text=”4 Hours” use_theme_fonts=”yes”][vc_column_text]
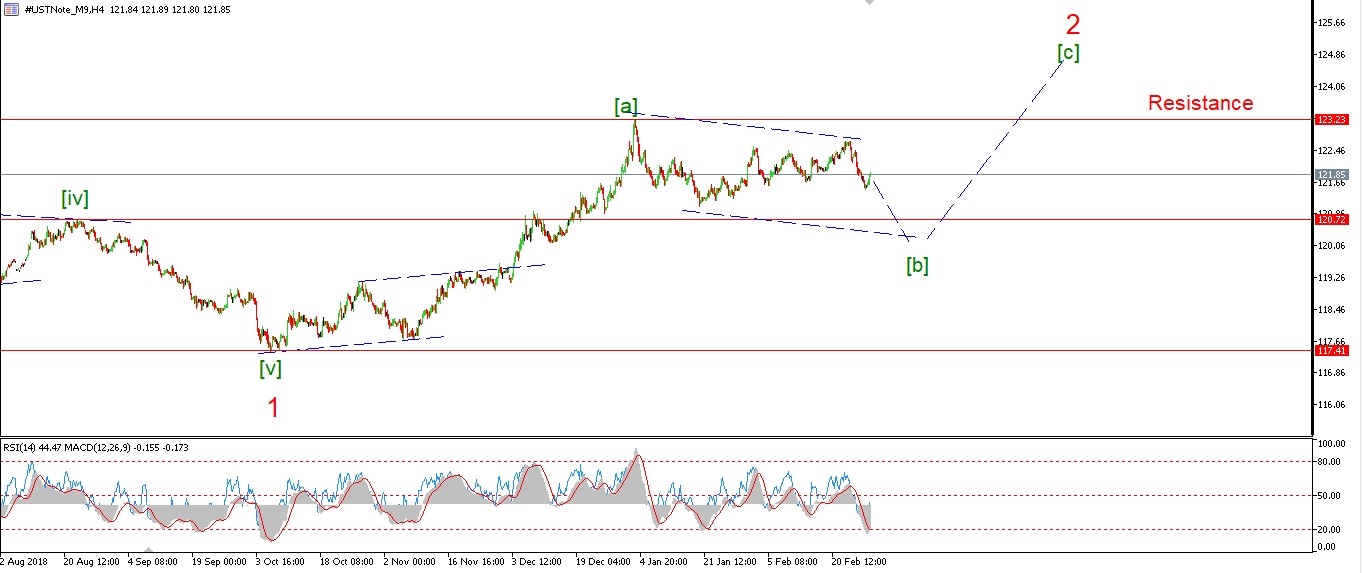 [/vc_column_text][vc_custom_heading text=”Daily” use_theme_fonts=”yes”][vc_column_text]
 [/vc_column_text][/vc_column][/vc_row]
[vc_row][vc_column][vc_column_text]
The 10YR is holding on above 121.00 in wave ‘ii’ again today.
The price is tracing out a three wave pattern off the 121.47 lows and should complete tomorrow.
Wave ‘iii’ down will be confirmed with a break of that wave ‘i’ low again.
Tomorrow;
The small trend channel suggests a high at about 122.00 again before turning lower in wave ‘iii’ of (c).
[/vc_column_text][/vc_column][/vc_row]
[/_s2If]
[_s2If current_user_can(access_s2member_ccap_silver)]
[vc_row][vc_column][vc_separator border_width=”5″][/vc_column][/vc_row][vc_row][vc_column][vc_column_text]
SILVER
[/vc_column_text][/vc_column][/vc_row][vc_row][vc_column][vc_separator border_width=”5″][/vc_column][/vc_row][vc_row][vc_column width=”2/3″][vc_custom_heading text=”1 hr” use_theme_fonts=”yes”][vc_column_text]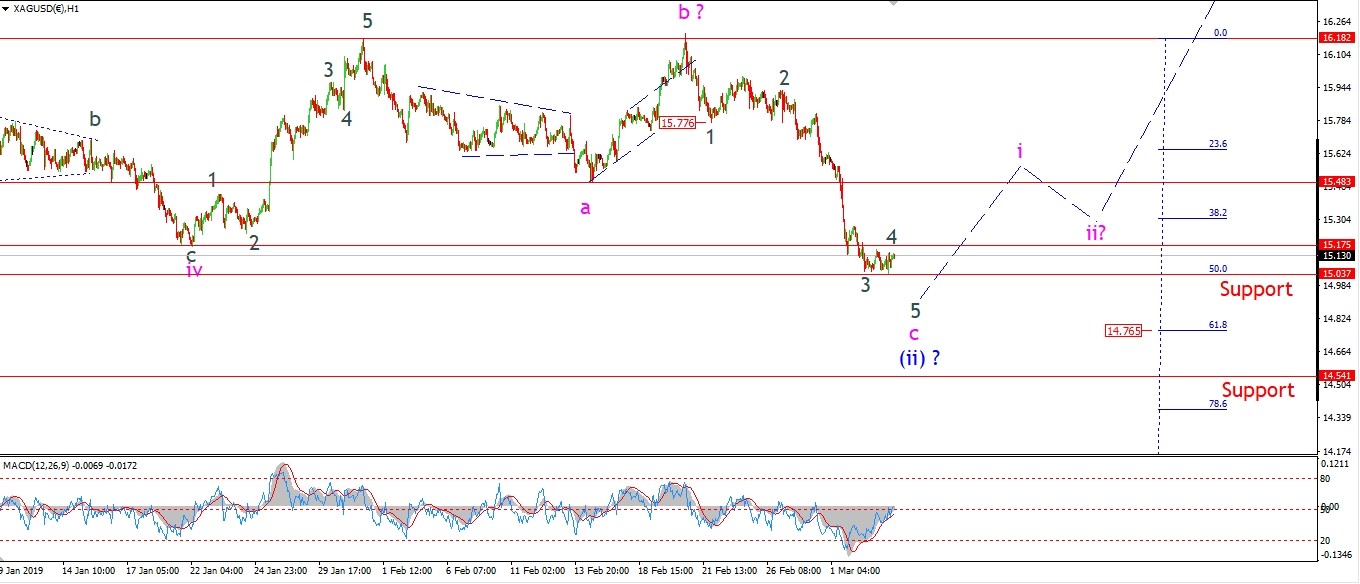 [/vc_column_text][/vc_column][vc_column width=”1/3″][vc_custom_heading text=”4 Hours” use_theme_fonts=”yes”][vc_column_text]
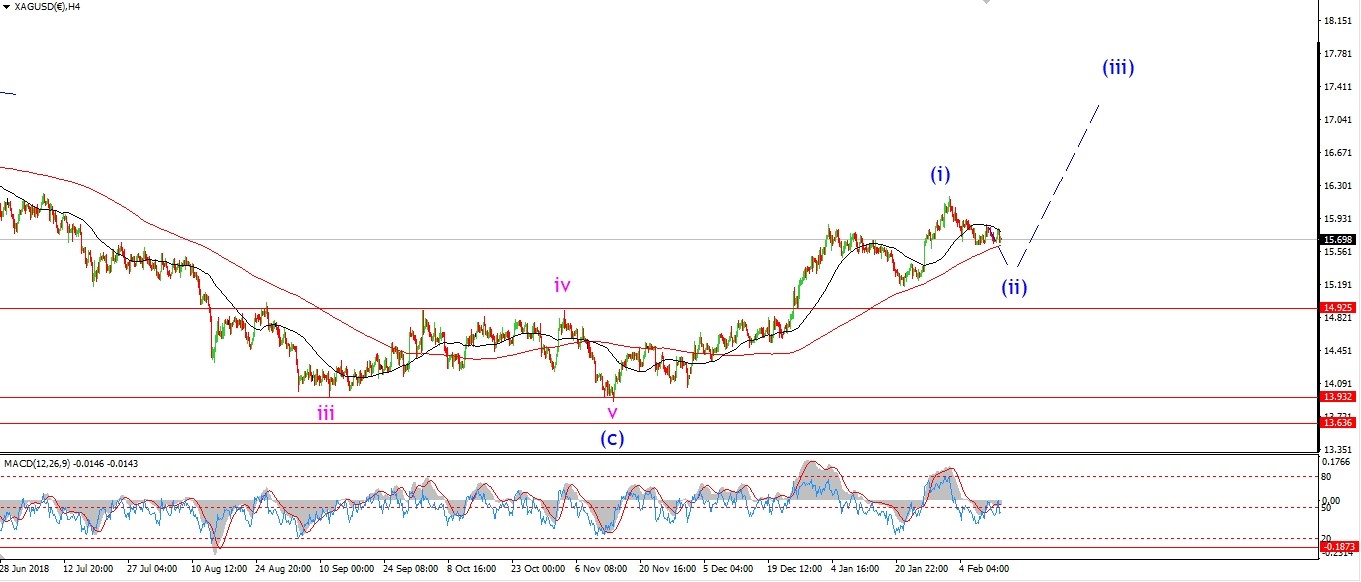 [/vc_column_text][vc_custom_heading text=”Daily” use_theme_fonts=”yes”][vc_column_text]
 [/vc_column_text][/vc_column][/vc_row]
[vc_row][vc_column][vc_column_text]
Silver is contracting in a possible triangle today in wave ‘4’ of ‘c’.
The correction is playing out between the previous wave ‘iv’
and the 50% retracement level.
This suggests that wave ‘5’ of ‘c’ will break 15.00 again to complete the wave (ii) correction.
14.76 market the 62% retracement level,
this marks the lower end of the range for wave (ii).
Tomorrow;
Watch for wave ‘5’ of ‘c’ to complete with a break of 15.00 again.
[/vc_column_text][/vc_column][/vc_row]
[/_s2If]
[_s2If current_user_can(access_s2member_ccap_sp500)]
[vc_row][vc_column][vc_separator border_width=”5″][/vc_column][/vc_row][vc_row][vc_column][vc_column_text]
S&P 500.
[/vc_column_text][/vc_column][/vc_row][vc_row][vc_column][vc_separator border_width=”5″][/vc_column][/vc_row][vc_row][vc_column width=”2/3″][vc_custom_heading text=”1 hr” use_theme_fonts=”yes”][vc_column_text]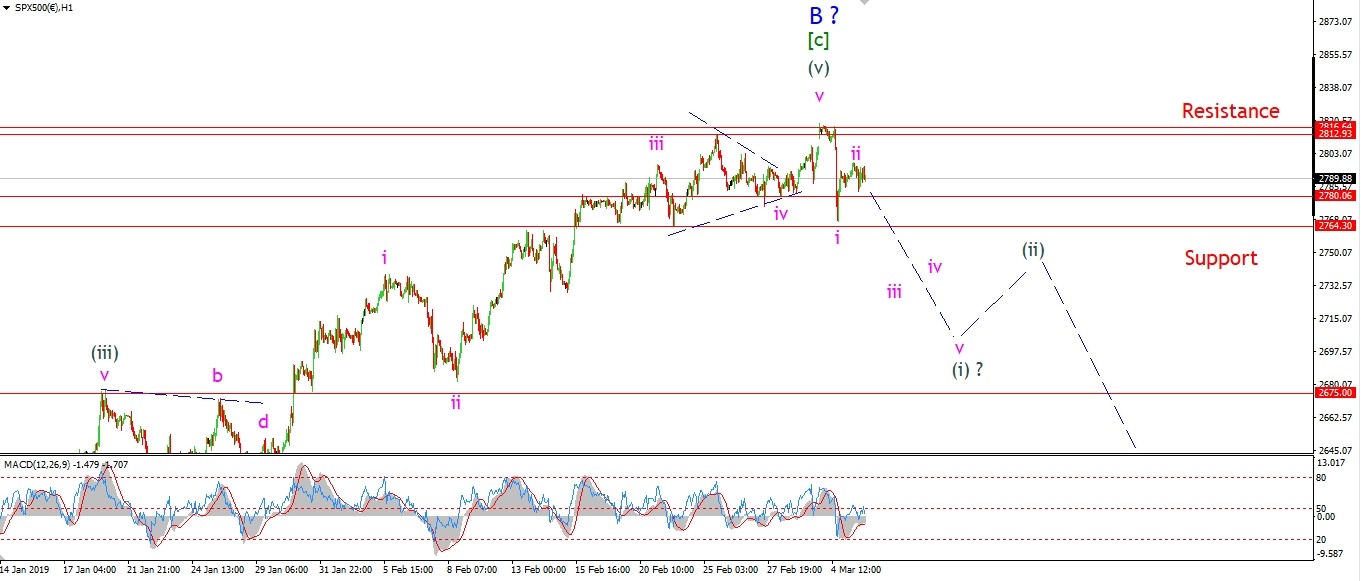 [/vc_column_text][/vc_column][vc_column width=”1/3″][vc_custom_heading text=”4 Hours” use_theme_fonts=”yes”][vc_column_text]
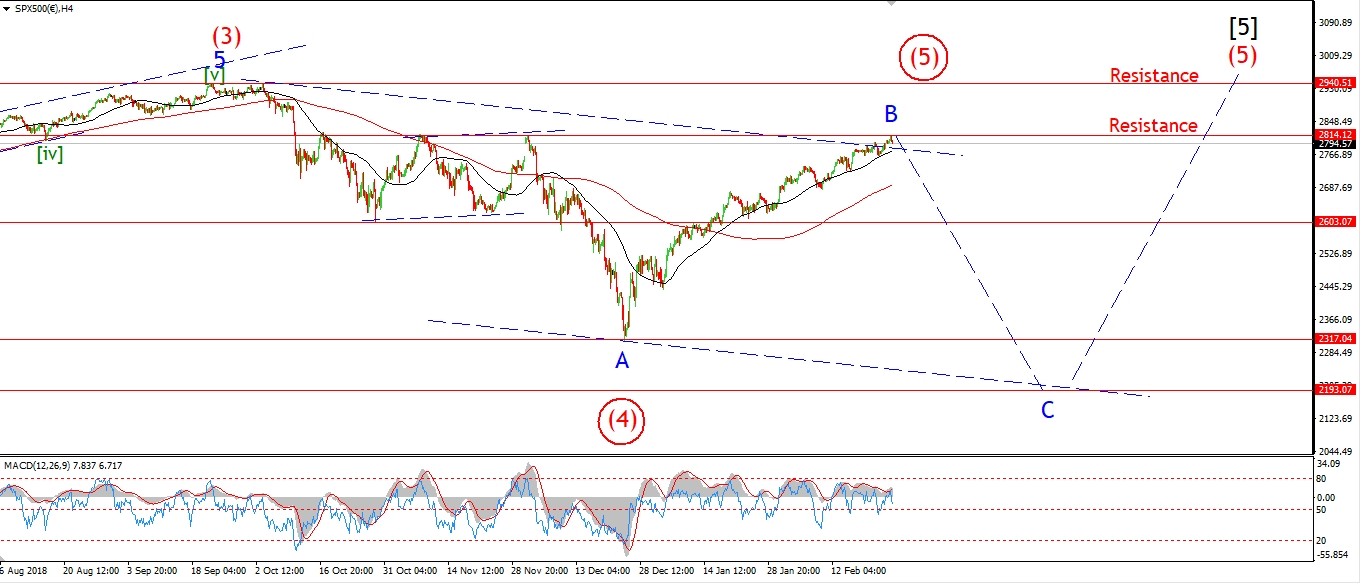 [/vc_column_text][vc_custom_heading text=”Daily” use_theme_fonts=”yes”][vc_column_text]
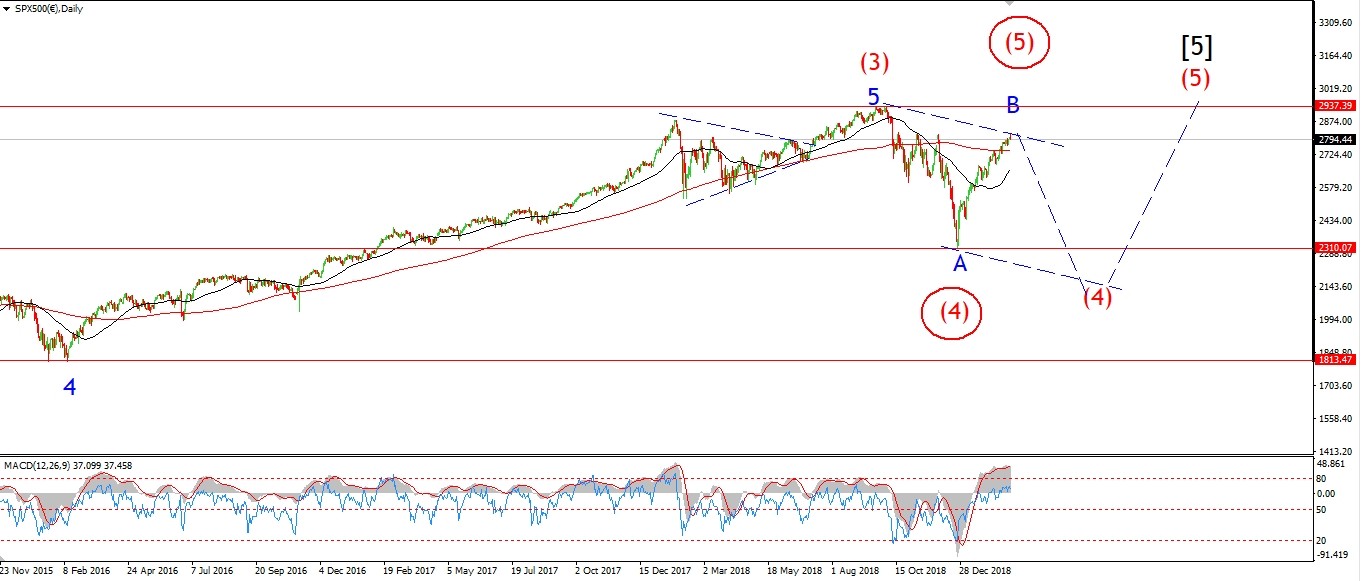 [/vc_column_text][/vc_column][/vc_row]
[vc_row][vc_column][vc_column_text]
The drop off the highs in the S&P is more straight forward than the DOW.
We have a nice impulse wave lower off the high developing now.
Wave ‘ii’ may even be complete at todays highs.
If this is the case,
Wave ‘iii’ down will take over tomorrow and break support at 2764.
All going well,
the market will continue lower for the rest of the week to complete a five wave pattern lower off the high.
Then things will get very interesting for the near future as wave ‘C’ will be in-charge of proceedings.
Tomorrow;
Watch for 2800 to resist any further rise in wave ‘ii’,
wave ‘iii’ should begin and break 2764.
[/vc_column_text][/vc_column][/vc_row]
[/_s2If]
[vc_row][vc_column][vc_column_text]
[/vc_column_text][/vc_column][/vc_row]
[vc_row][vc_column][vc_separator border_width=”5″][/vc_column][/vc_row]