
Good evening folks, the Lord’s Blessings to you all.

https://twitter.com/bullwavesreal
EURUSD.
EURUSD 1hr.
EURUSD 4hr.
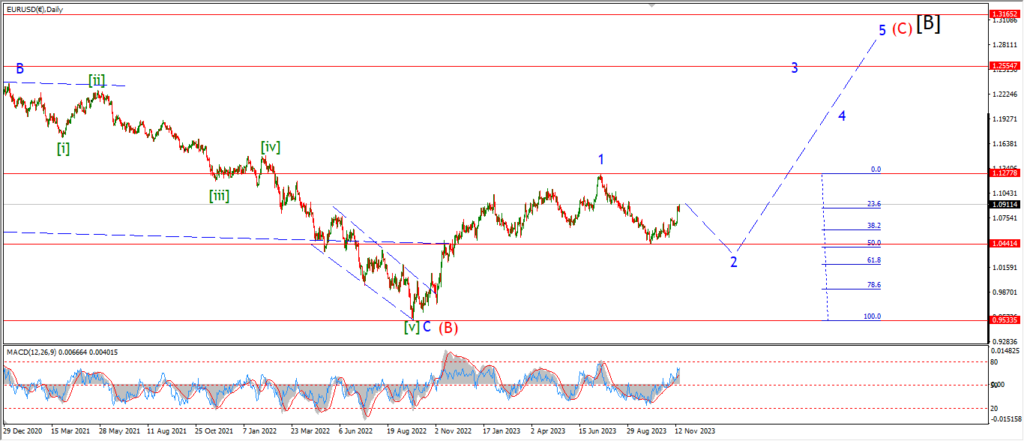
EURUSD daily.
I am taking a different approach on the short term count,
after the failure to launch into a third wave today.
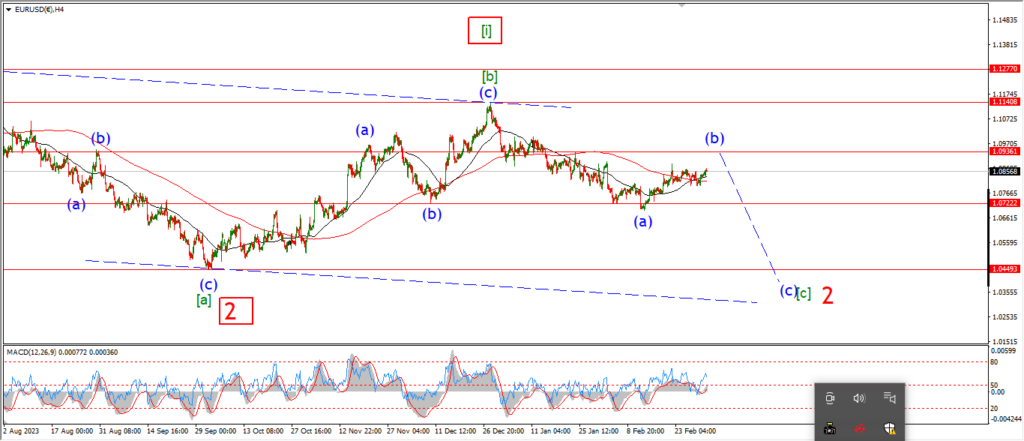
Lets start on the 4hr chart.
I was trying to chart a five wave pattern lower into wave [c] of ‘2’ lately.
This has not worked out.
And now this evening I am looking at wave [c] as a three wave decline rather than a five wave decline.
The overall pattern in wave [c] of ‘2’ should drop towards the same target.
but wave [c] will drop in three waves to complete a combination wave.
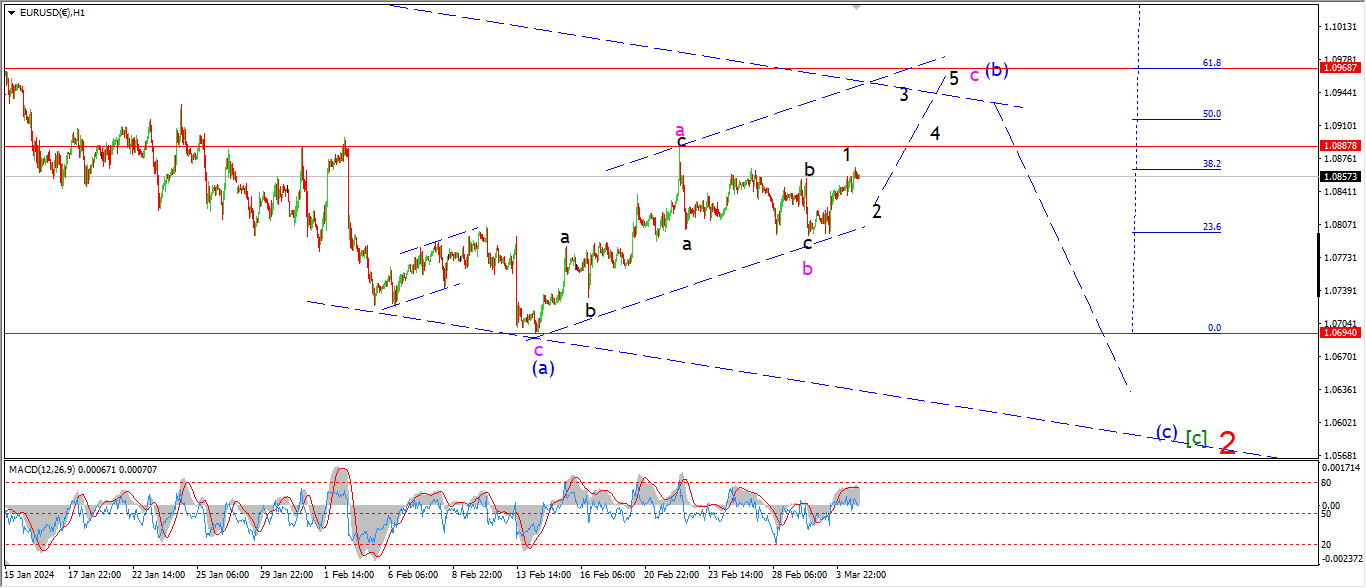
The hourly chart shows the correction in wave (b) of [c].
I have labelled a flat correction with an internal 3,3,5 pattern for wave (b).
This pattern will allow for a rise into the 1.0970 area to complete three waves up at the 62% retracement level.
Tomorrow;
Watch for wave ‘c’ of (b) to track higher in five waves and complete near that 1.0970 area.
GBPUSD
GBPUSD 1hr.
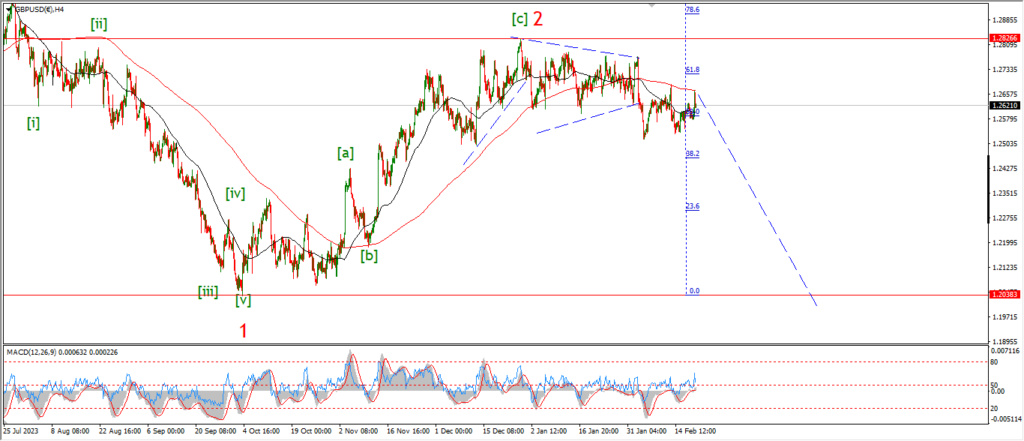
GBPUSD 4hr.
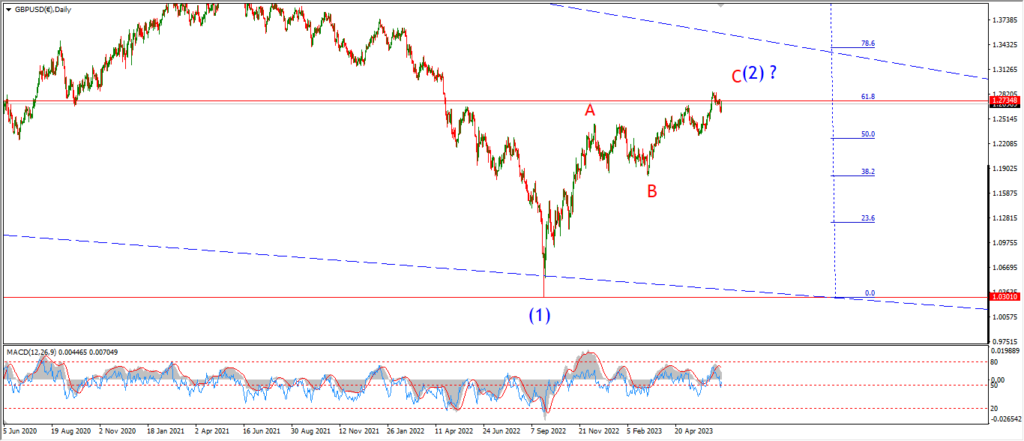
GBPUSD daily.
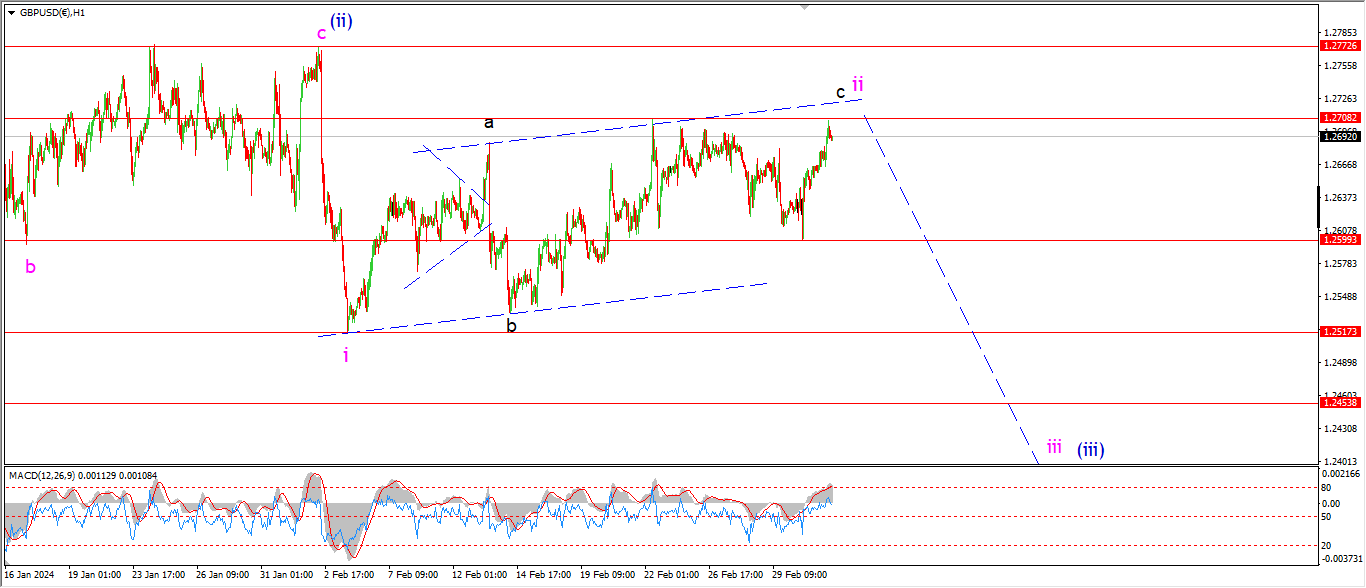
I have not altered the overall pattern here in cable even though the price managed to pip to a new high in wave ‘c’ of ‘ii’.
Another complex correction higher seems to be the case here in wave ‘ii’.
and I am still expecting reversal into wave ‘iii’ this week as the base case scenario.
Tomorrow;
Watch for wave ‘ii’ to complete below 1.2772 at the very upper limit.
A break below 1.2600 again will signal wave ‘iii’ has begun.
USDJPY.
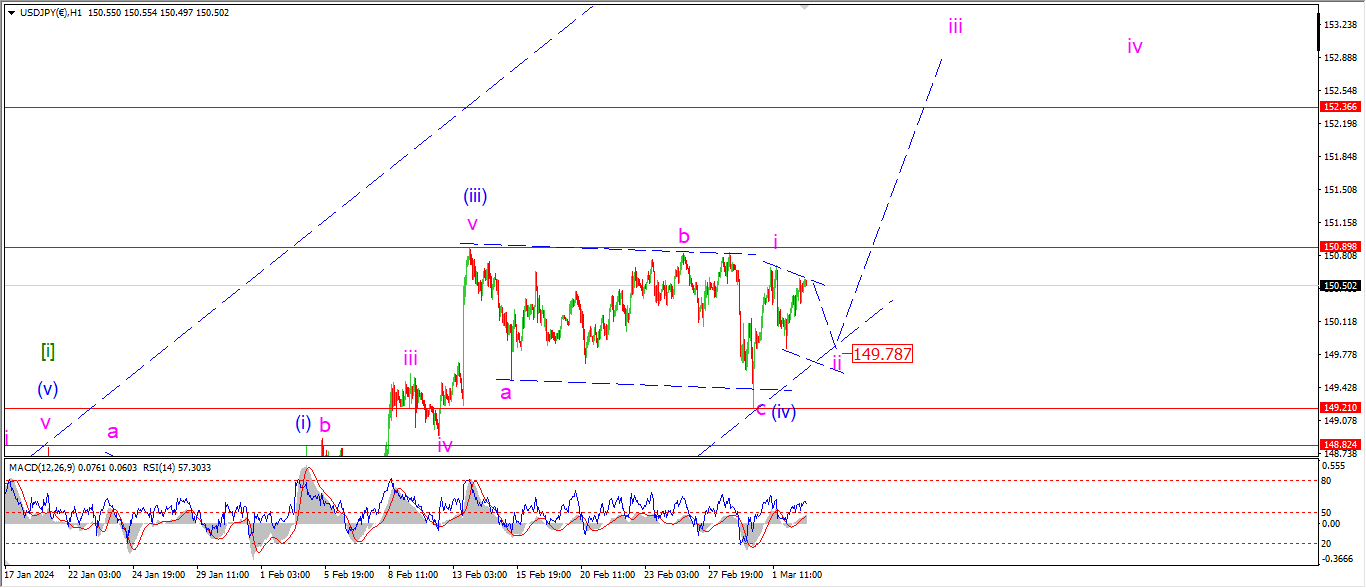
USDJPY 1hr.
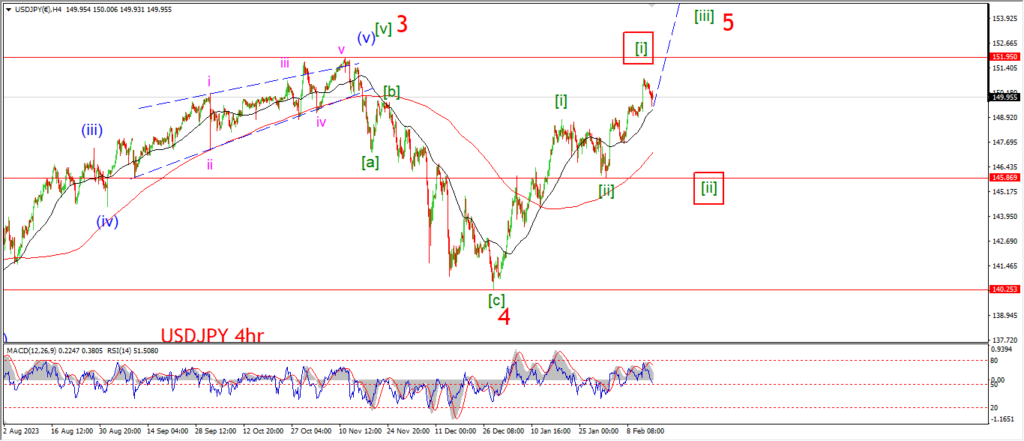
USDJPY 4hr.
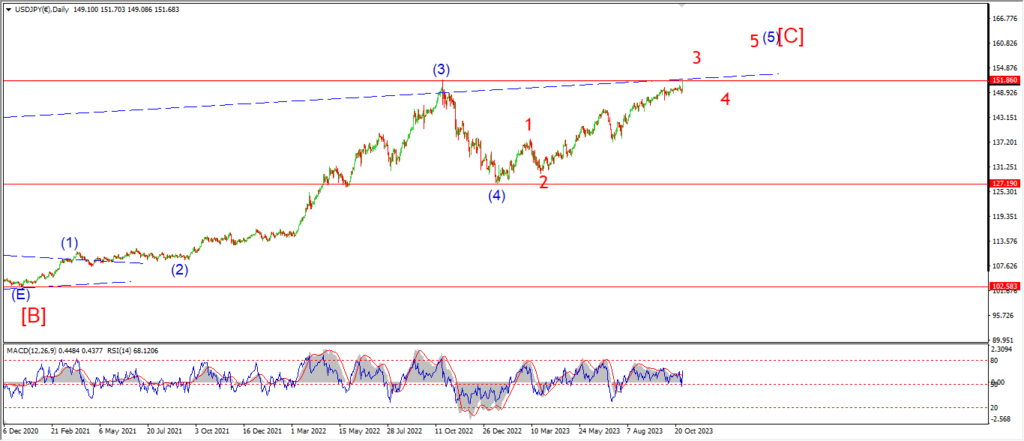
USDJPY daily.
USDJPY is rumbling along in wave ‘ii’ again today and the price is tracing out three waves down as shown.
Wave ‘ii’ of (V) must complete above 149.21 at the previous wave (iv) low.
and I will continue to look for a five wave rally into wave (v) this week as long as that wave (iv) low holds.
Tomorrow;
Watch for wave (iv) to hold at 149.21.
If that level breaks I will be forced to rethink the main count.
Wave ‘iii’ of (v) will be confirmed with a break of 150.89.
DOW JONES.
DOW 1hr.
DOW 4hr
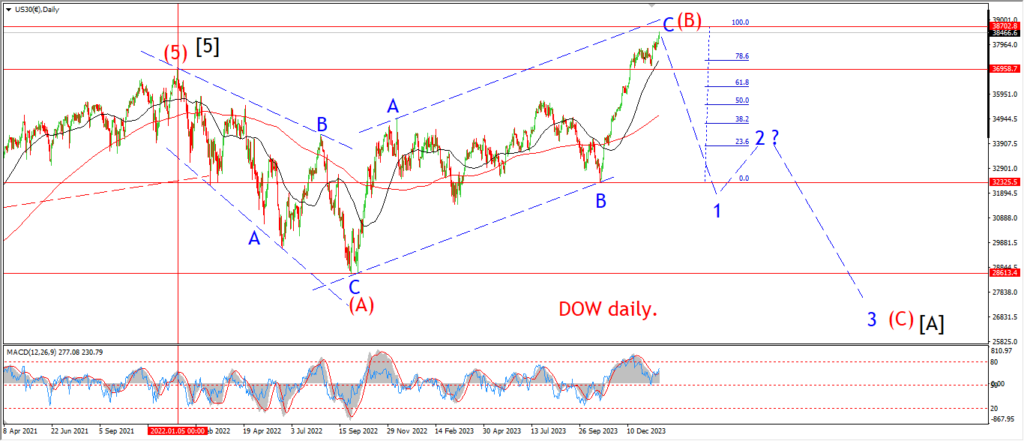
DOW daily.
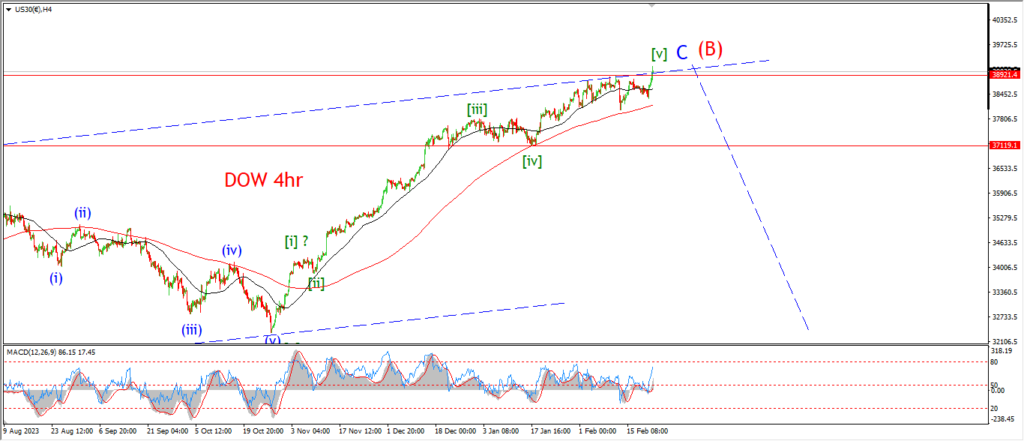
I am going to run through another possible count for wave [v] of ‘C’ tonight.
It can be considered the sister pattern of the previous expanding wedge pattern from last week.
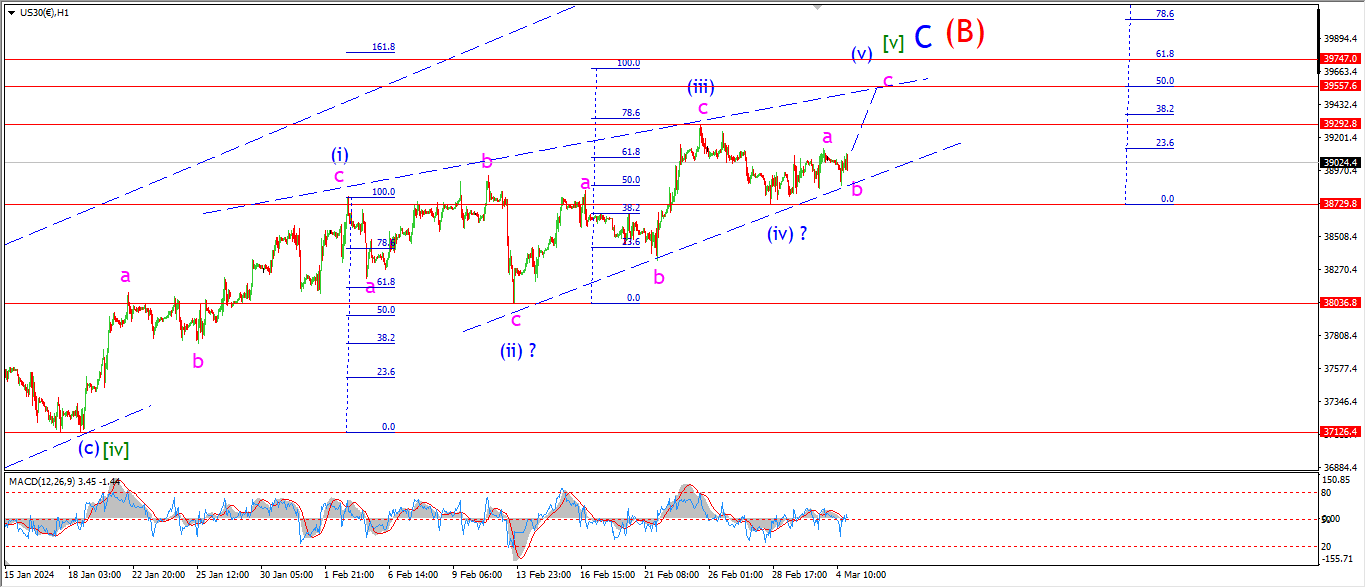
The hourly chart shows wave [v] as a contracting wedge,
or also known as the ending diagonal pattern.
Given the action over the last few days it seems we are moving now within a fourth and fifth waves to complete this pattern.
the internal wave counts are all correct up to the top of wave (iii) of [v].
And the internal pattern of wave (iv) can vary a little from here.
but that will be revealed soon.
I have taken the Fibonacci grid of wave (i) as 100%.
And then placed it over the length of wave (iii).
You cen see that wave (iii) topped out just below the 78.6% length of wave (i).
Now If I take the same Fib grid and place it on wave (iv),
it gives us a target range between the 50% and 62% levels at 39557 and 39747 to complete the pattern.
That lines up with the upper trend line of the wedge also.
So this is a reasonable level to watch this week.
Tomorrow;
watch for wave (iv) to hold at the current low.
Wave (v) will trace out three waves up as shown and top out in that target range.
GOLD
GOLD 1hr.
GOLD 4hr.

GOLD daily.
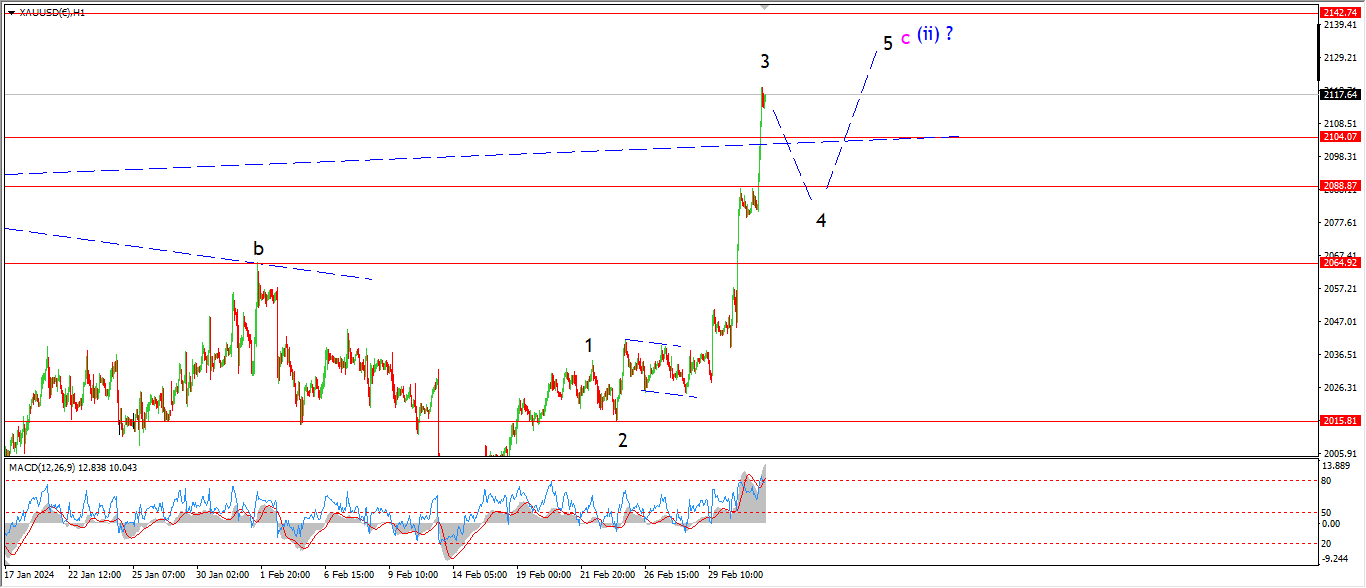
Another spike higher today has done enough to complete wave ‘3’ of ‘c’ of (ii) I think.
the pattern as already created a throw-over above the upper trend channel line.
And now I can begin to look for wave ‘4’ of ‘c’ to turn back lower in a corrective manner over the next few days.
Tomorrow;
Watch for wave ‘3’ to top out and reverse in a corrective manner.
Wave ‘4’ should fall back into the wave ‘a’ top at 2088.
and then wave ‘5’ will be ready to carry us out to a new high to complete the larger wave (ii) pattern.
CRUDE OIL.
CRUDE OIL 1hr.
CRUDE OIL 4hr.
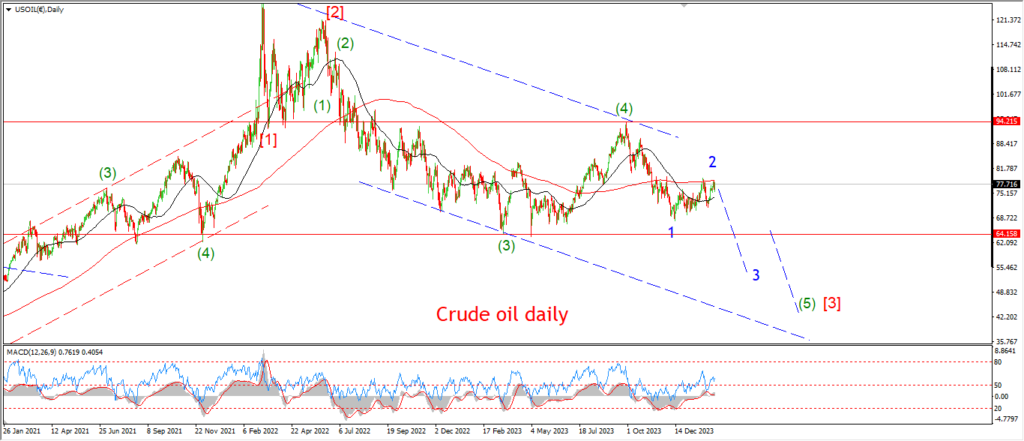
CRUDE OIL daily.
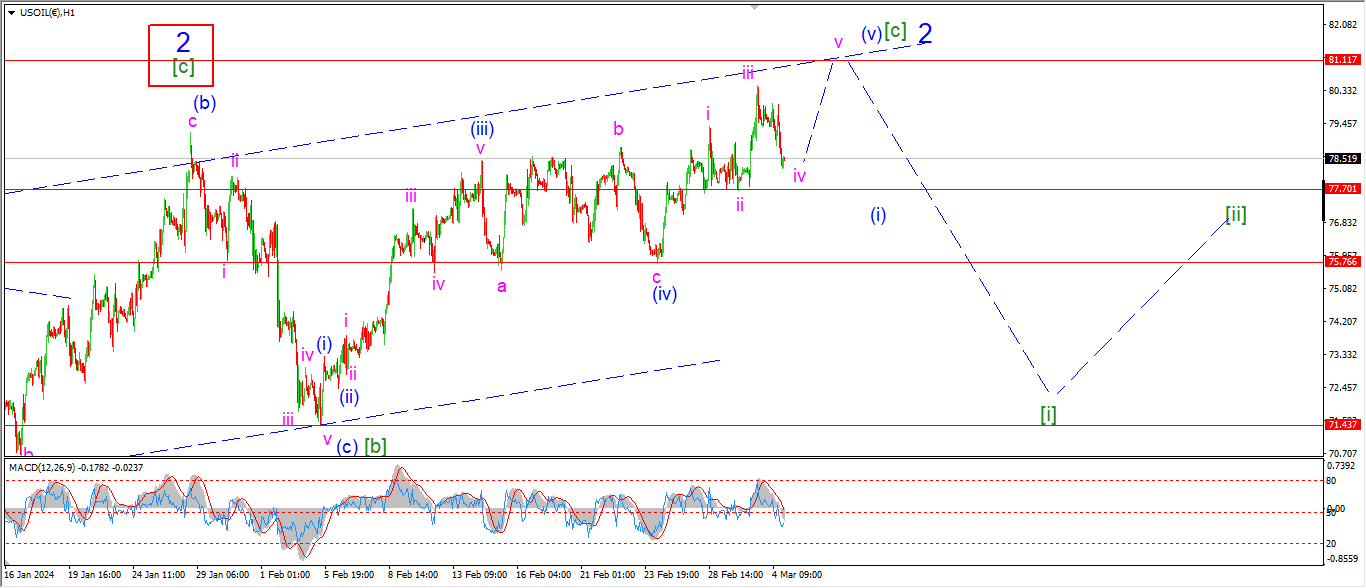
Crude has fallen back today a little further than expected in wave ‘iv’ of (v) of [c].
But the pattern in wave (v) can still work as an ending diagonal.
And in this scenario,
we will see an end to wave (v) this week either way.
so the pattern for wave [c] holds today.
I will keep one eye on the wave ‘ii’ low at 77.70.
If that level breaks,
then the ending diagonal pattern fails and it is back to the drawing board for wave (v)!
Tomorrow;
Lets see if wave ‘v’ of (v) can turn higher as expected and then run higher into the upper trend line at 81.10 again.
A break below the wave (iv) low at 75.76 again will signal wave ‘2’ is already complete,
and wave (i) of [i] of ‘3’ has begun.
S&P 500.
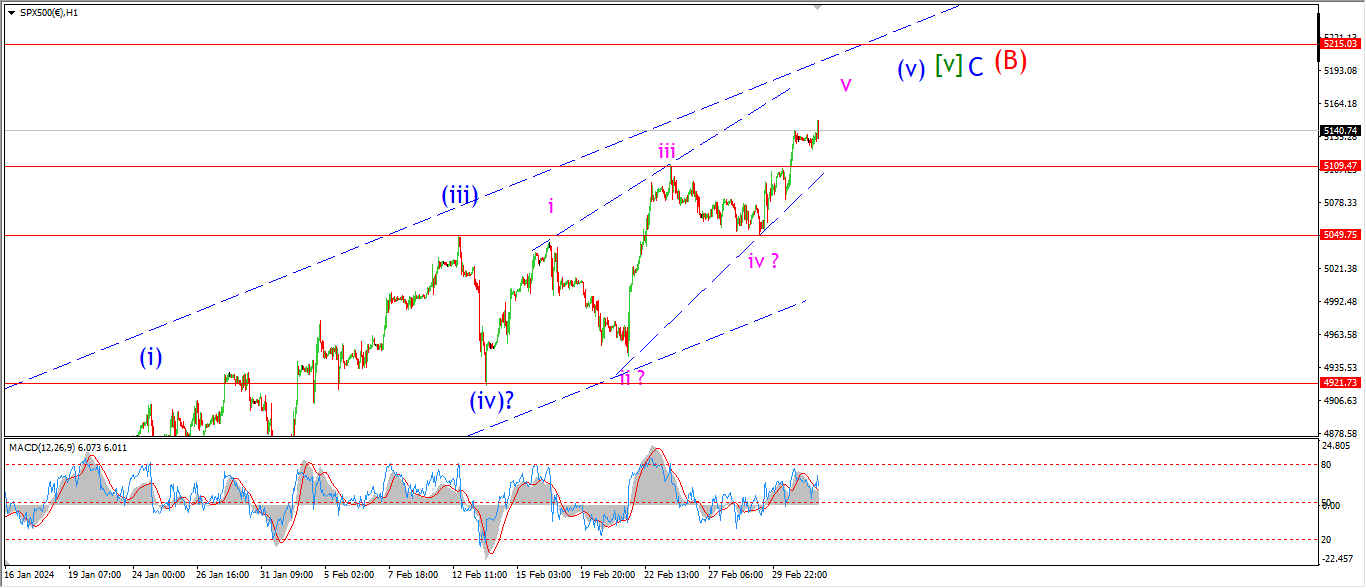
S&P 500 1hr
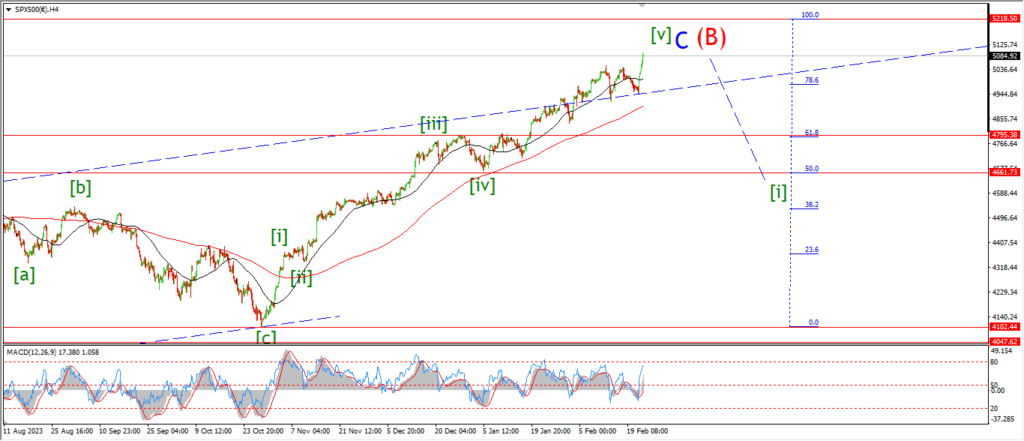
S&P 500 4hr
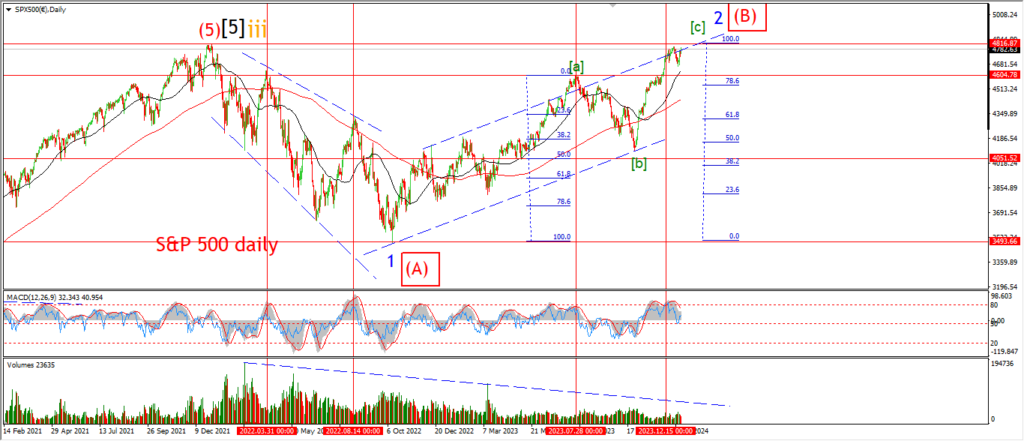
S&P 500 daily.
Well,
the S&P is now back at a new all time high as we close tonight.
and this is drawing the current pattern to a close again.
The internal pattern of wave (v) blue now has a five wave form.
and then at one degree lower,
wave ‘v’ of (v) has a five wave pattern also.
The upper target level at 5215 is within reach now,
but we don’t have to hit that level to complete a satisfactory pattern in wave [v] of ‘C’ of (B).
This week is more than enough to close out the current pattern,
so it should be an interesting week for sure.
Tomorrow;
Watch for wave ‘v’ of (v) to show signs of a top over the next few days.
Maybe we will see that reversal pattern into wave (i) down before Fridays close.
SILVER.
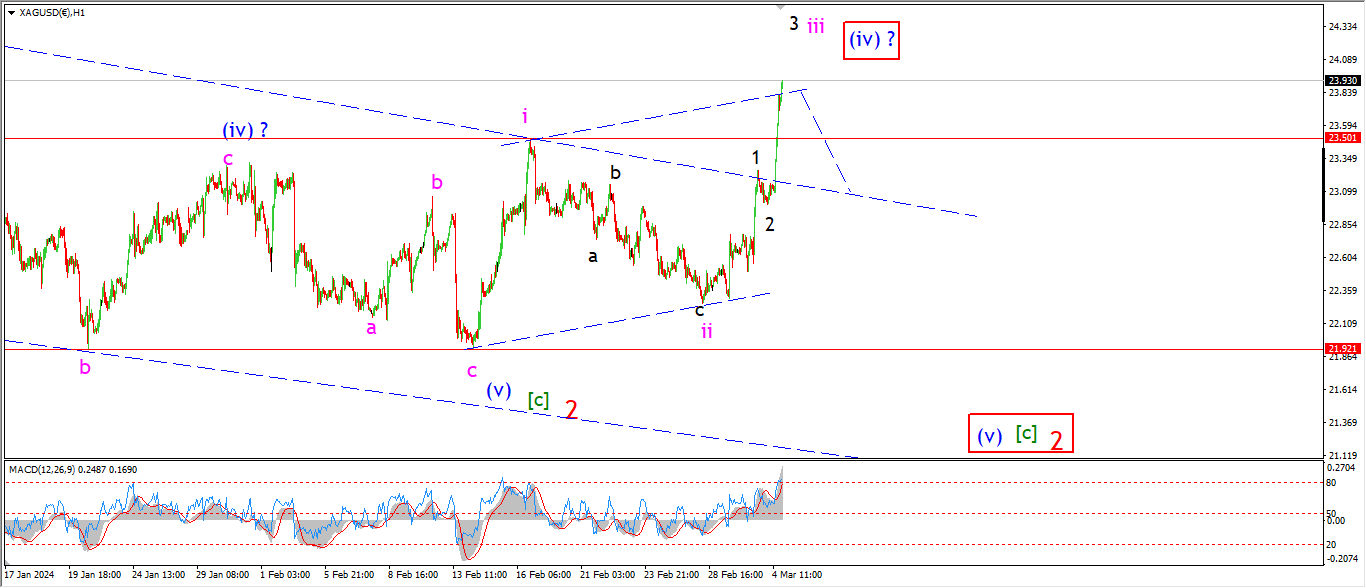
SILVER 1hr
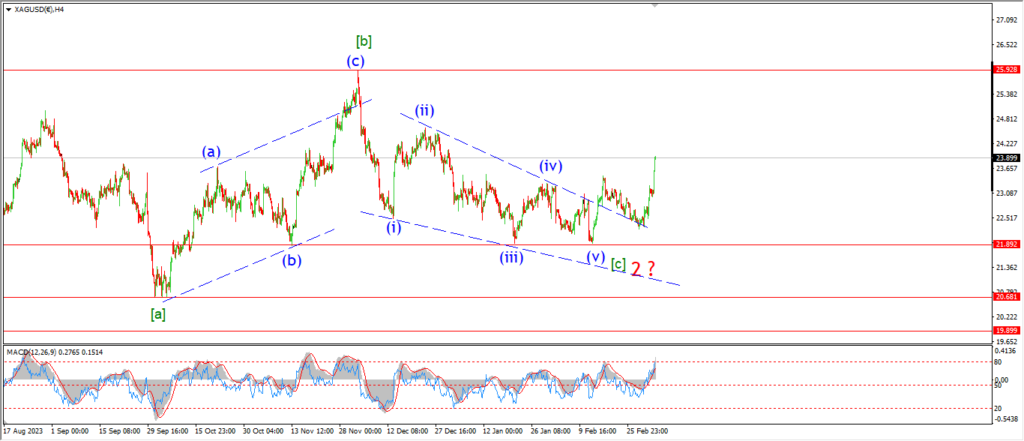
SILVER 4hr.
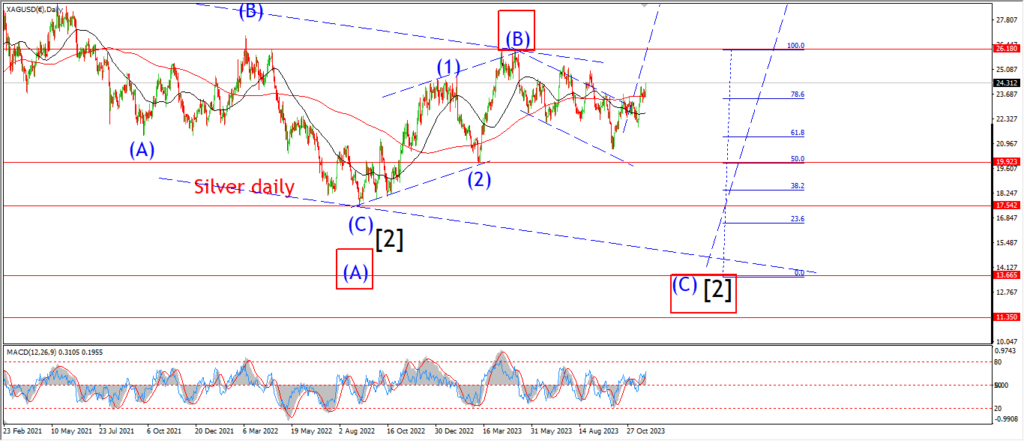
SILVER daily.
Silver has done enough to at least look closely at the bullish count now.
The rally today has broken above resistance at 23.50.
and that opens up the idea of a series of bullish impulse waves off the lows as shown.
Wave ‘1’ and ‘2’ of ‘iii’ are already complete at last weeks close,
and now wave ‘3’ of ‘iii’ has turned higher with todays rally.
This count suggests wave ‘iii’ pink will complete five waves up this week.
And that could bring the market back above 25.00 again.
This count will remain valid if the top at wave ‘i’ holds at 23.50.
Now;
there is also a very viable alternate count that explains this action.
The price has traced out three waves up into todays highs.
and this can also be viewed as a larger wave (iv) blue correction.
This count is a variation on last Fridays count.
So I do think it is worth tracking this also.
Tomorrow;
Watch for wave ‘ii’ pink to hold above the wave ‘i’ highs at 23.50.
As long as that holds,
then we can stick on the bullish side.
BITCOIN
BITCOIN 1hr.
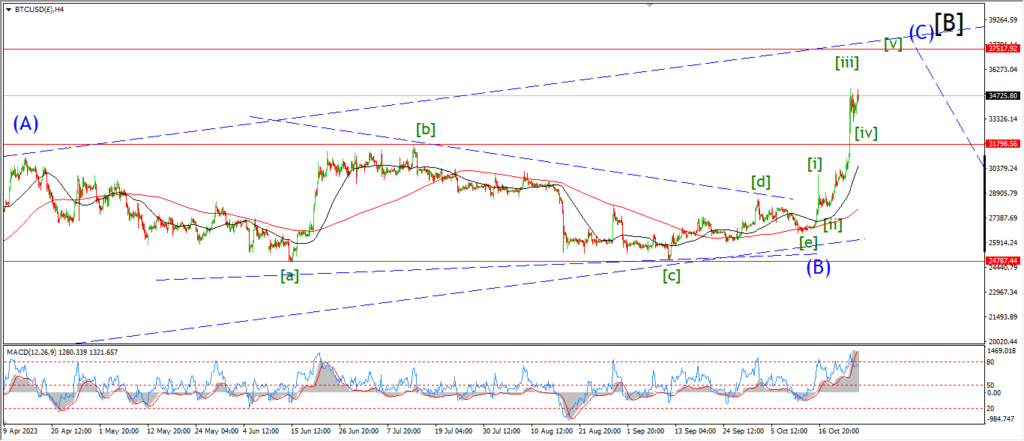
BITCOIN 4hr.
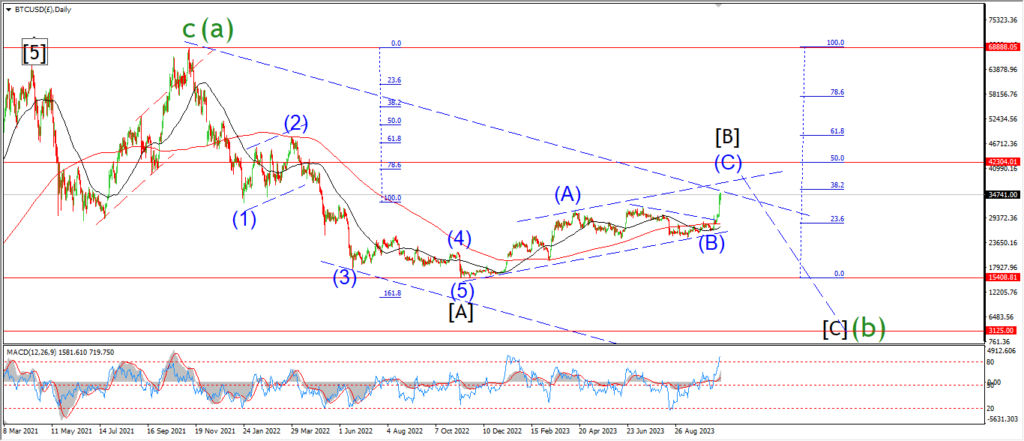
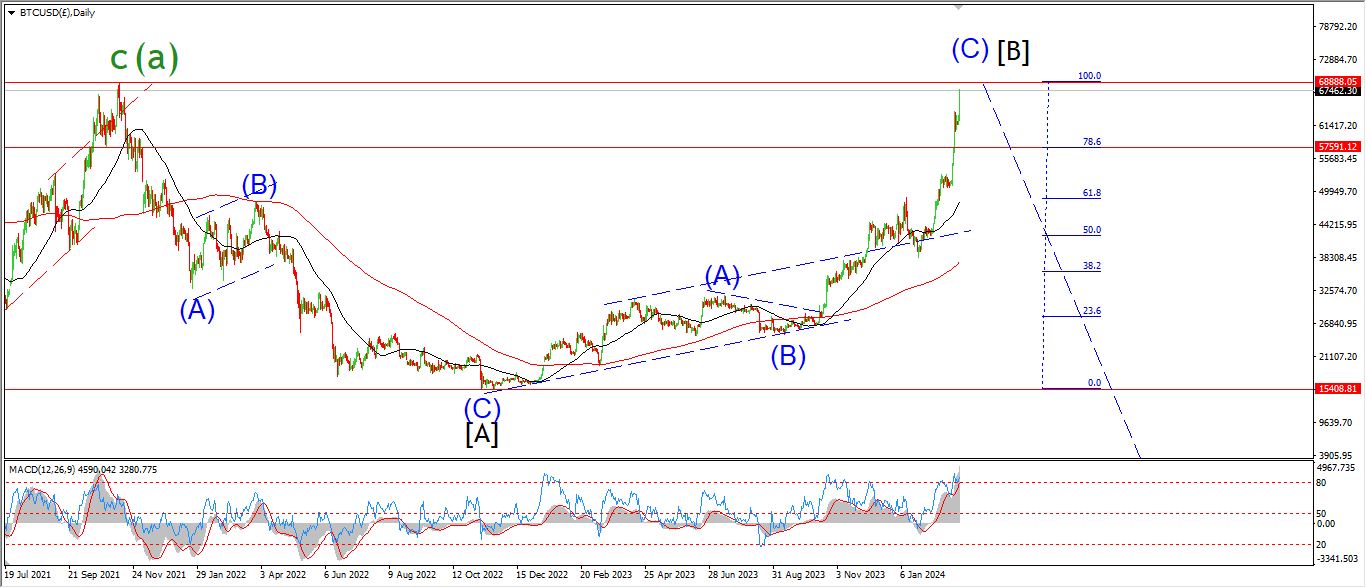
BITCOIN daily.
….
FTSE 100.
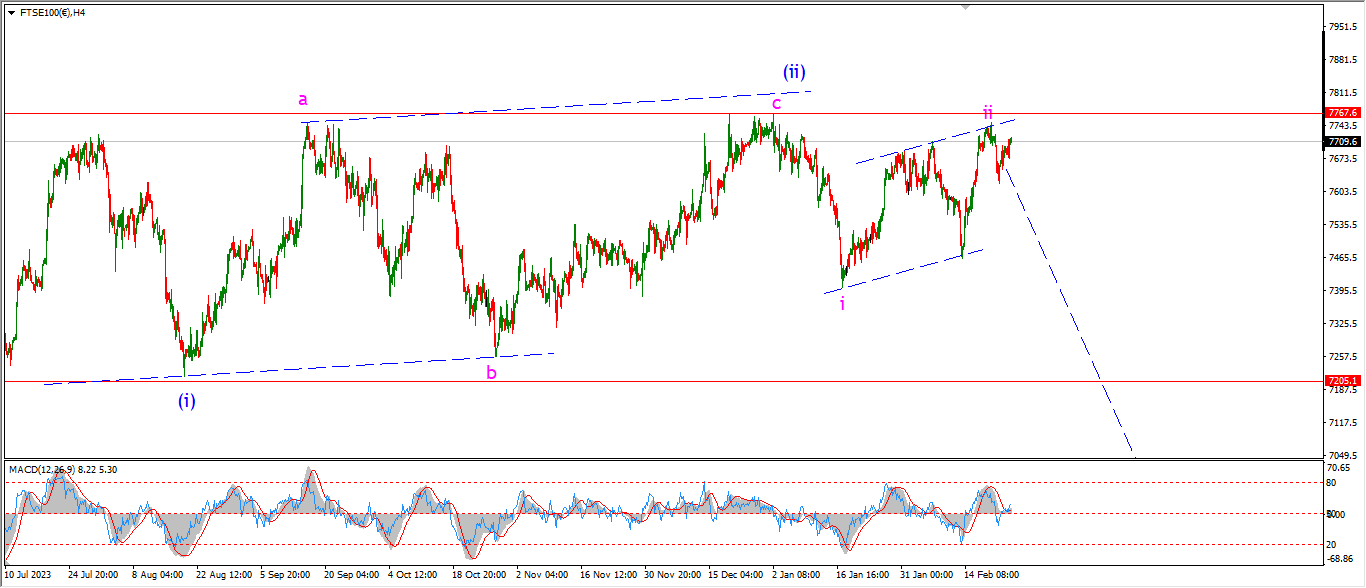
FTSE 100 1hr.

FTSE 100 4hr.

FTSE 100 daily.
….
DAX.
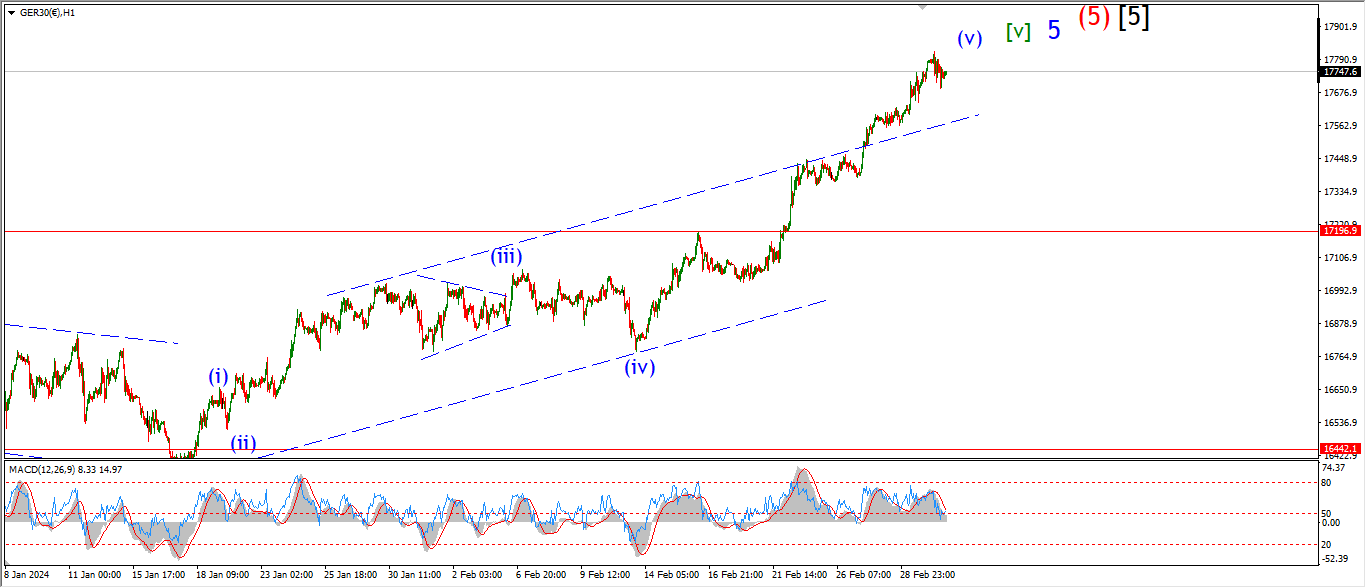
DAX 1hr
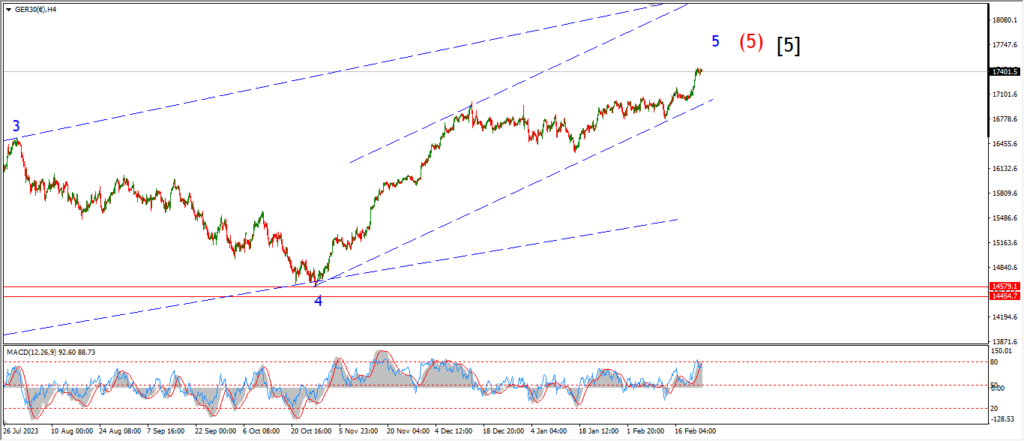
DAX 4hr

DAX daily.
….
NASDAQ 100.
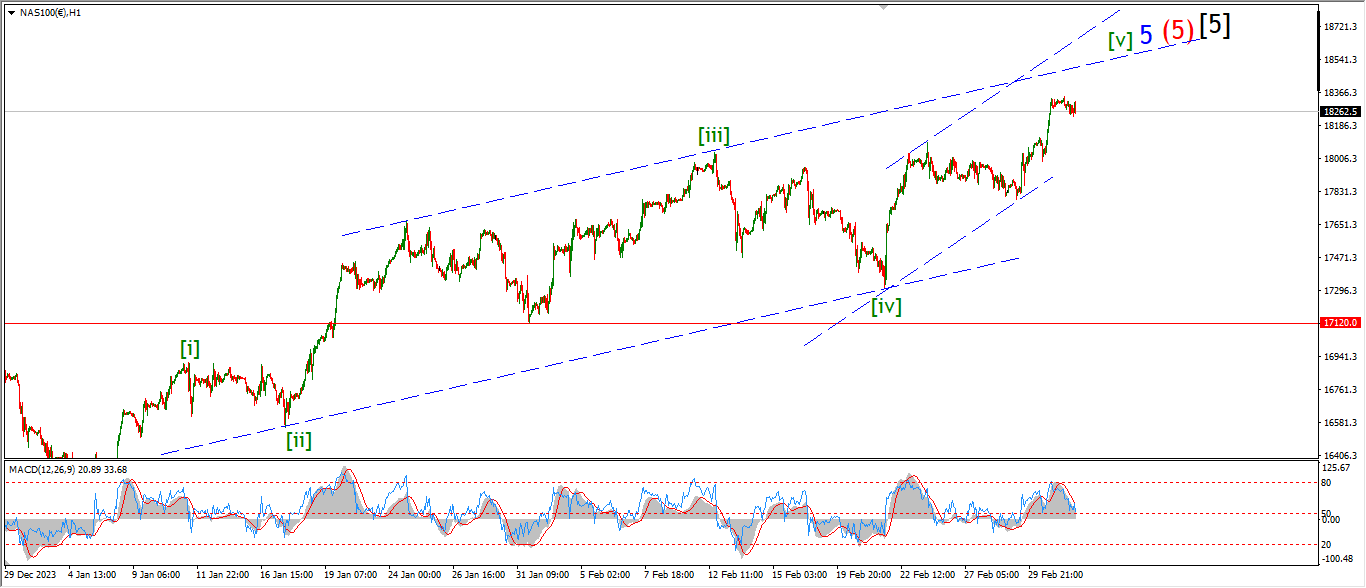
NASDAQ 1hr
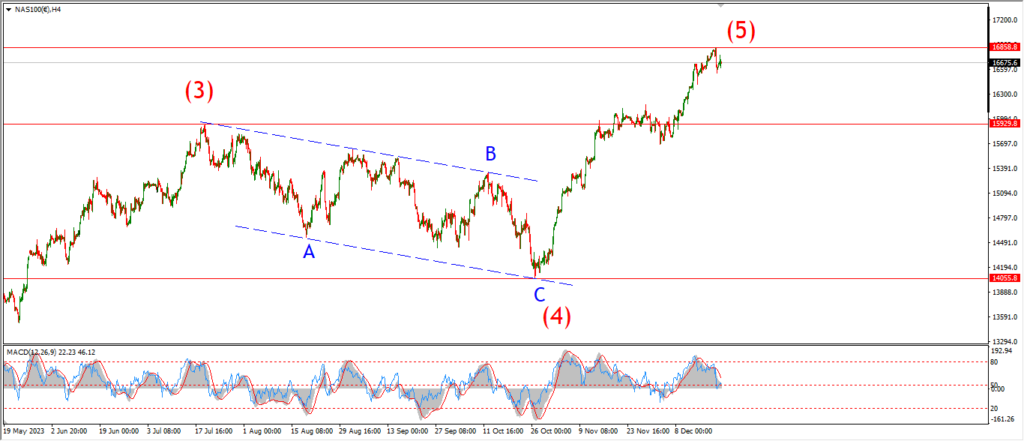
NASDAQ 4hr.
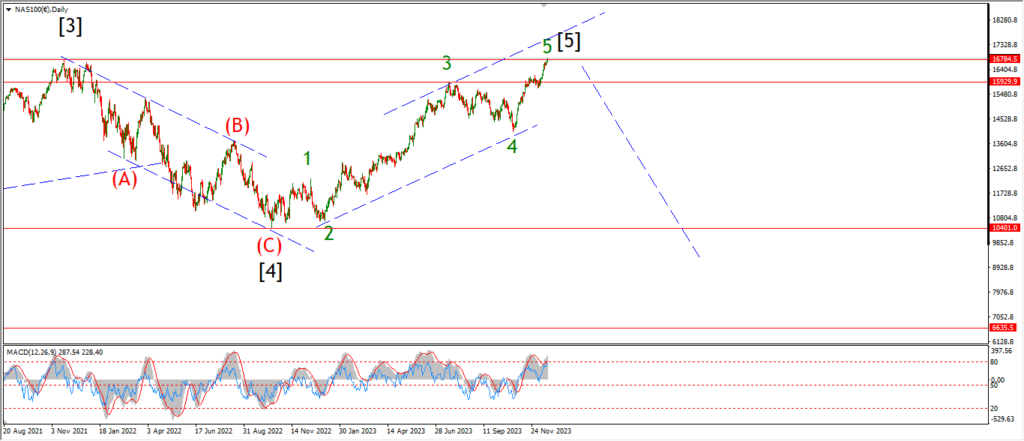
NASDAQ daily.
….