
Good evening to you all,
the Lord’s blessings to you all tonight.
EURUSD.
EURUSD 1hr.
EURUSD 4hr.
EURUSD daily.
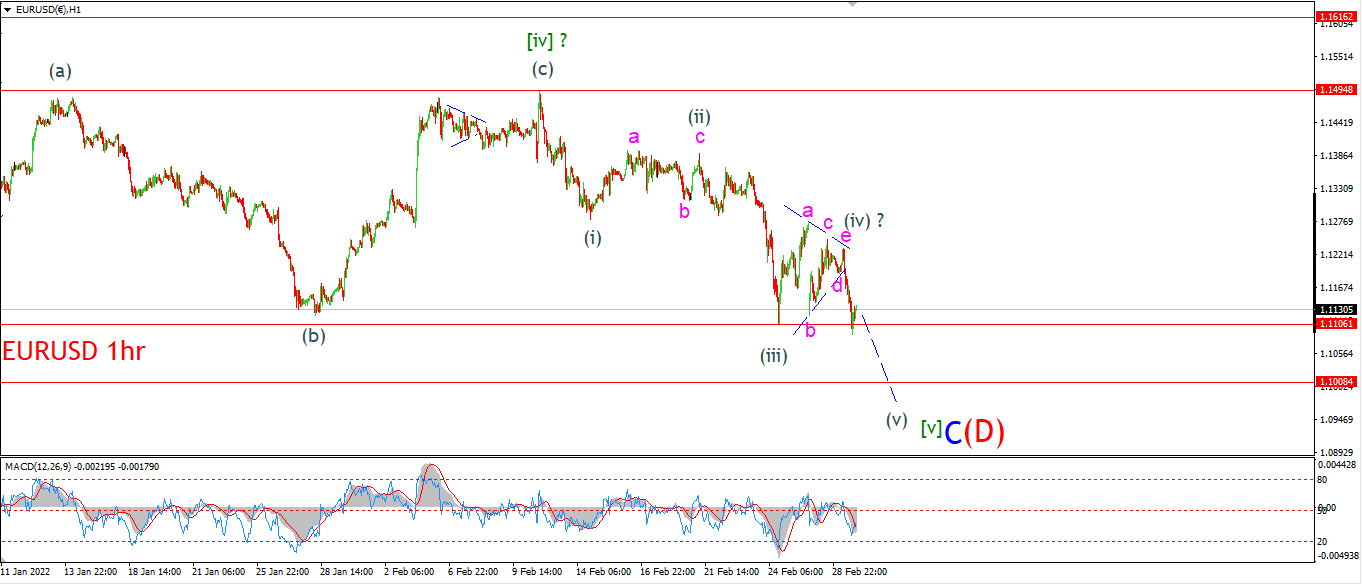
The alternate count for wave [v] was triggered today.
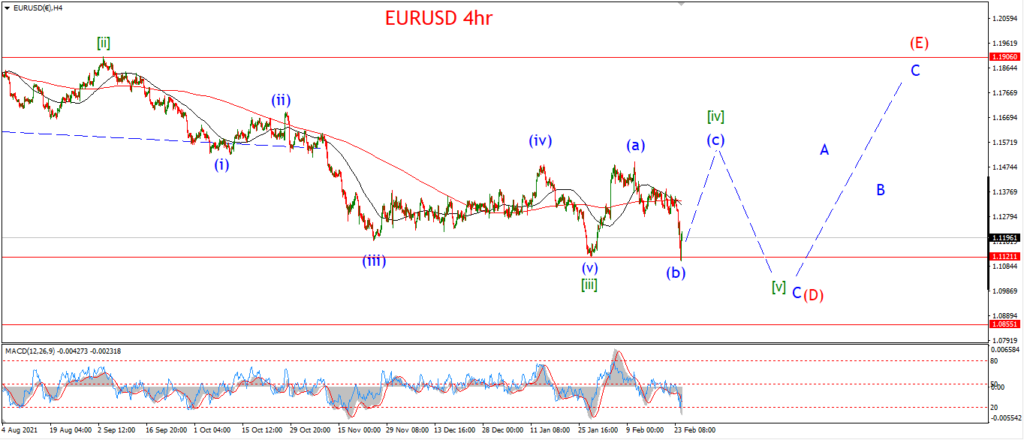
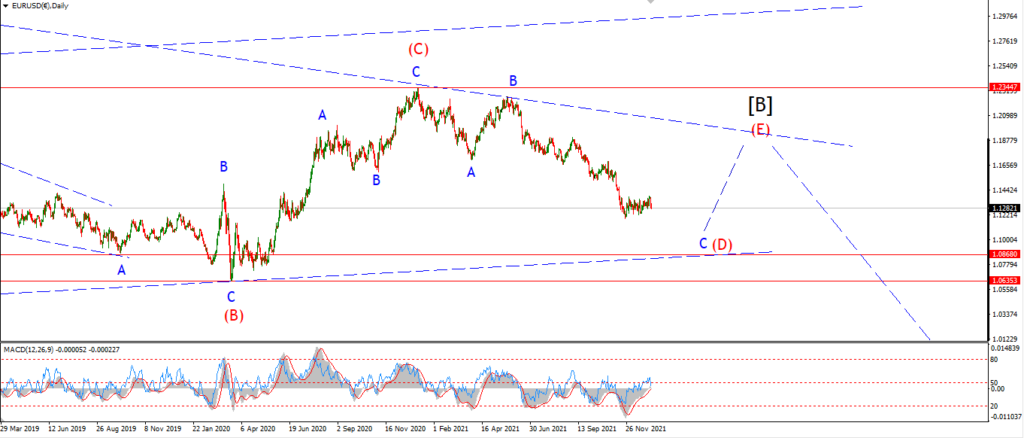
The main effect of this change, is that the larger wave count for wave (D) is moved forward in progress again.
So,
if this count is correct,
then we should see a final dip into the 1.1000 area to complete wave (v) of [v] of ‘C’ of (D) this week.
and then I will be looking higher to begin wave ‘A’ of (E) as per the 4hr chart.
Tomorrow;
The triangle in wave (iv) seems complete now,
and a break of 1.1106 today confirms wave (v) is underway.
watch for wave (v) to complete five wave decline near the 1.1000 level,
and we should be able to look higher into wave ‘A’ by the end of the week.
GBPUSD
GBPUSD 1hr.
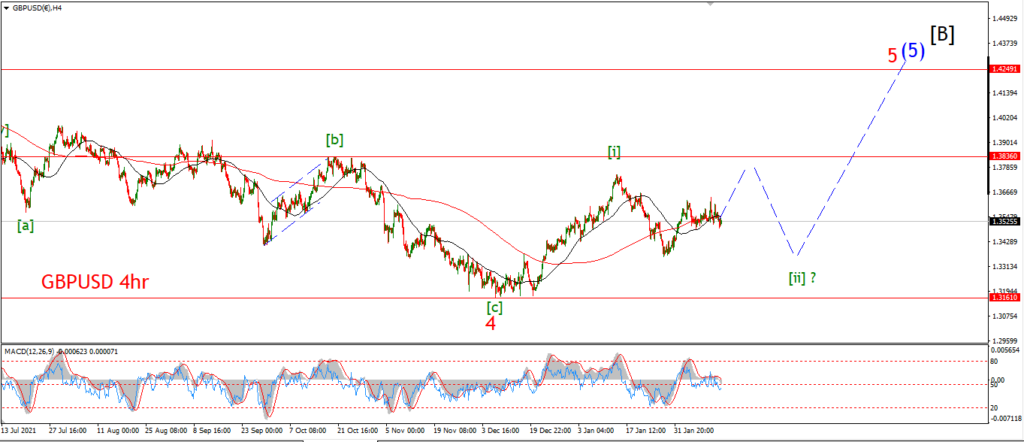
GBPUSD 4hr.
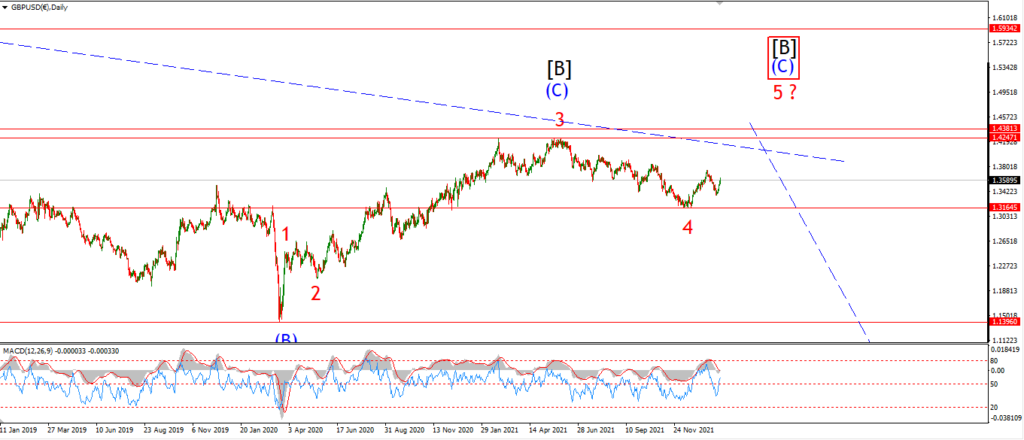
GBPUSD daily.
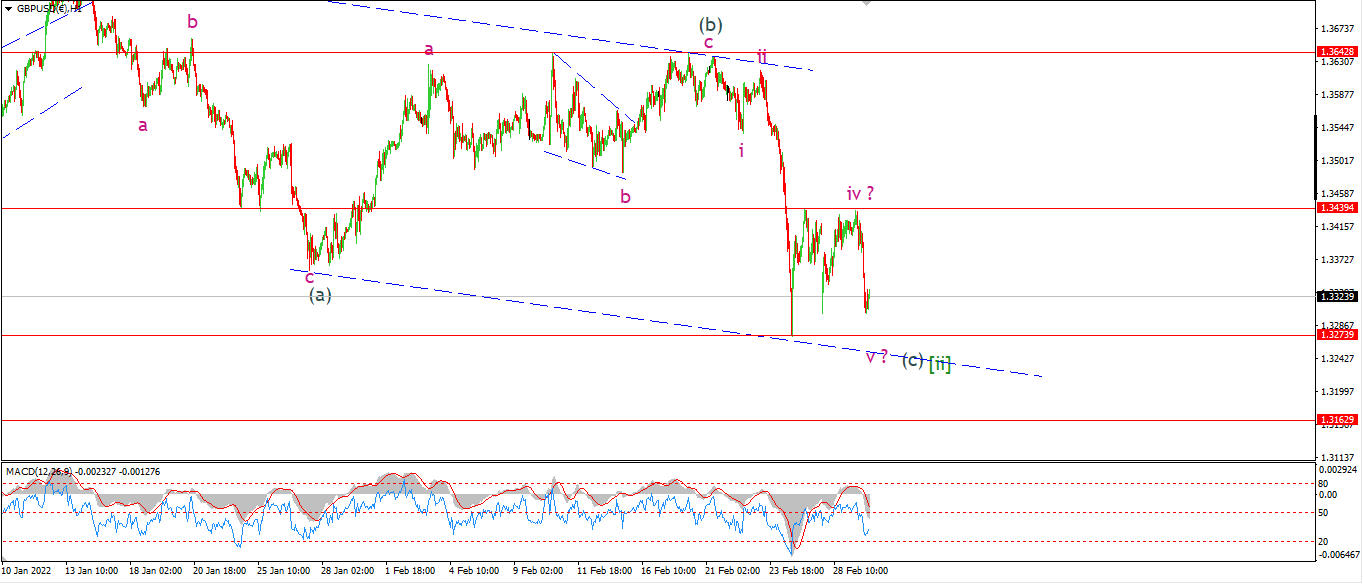
I am looking at a similar pattern in cable after todays spike lower.
There is a good chance that wave ‘v’ of (c) will make one new low with a break of 1.3273 again.
If that happens that will complete five waves down in wave (c).
And also complete a larger flat correction in wave [ii] green.
I do still expect a rally to begin in wave [iii] pretty soon,
and that rally should carry the price up towards 1.40 again over the next few weeks.
Tomorrow;
Watch for wave ‘v’ of (c) to complete with a break of 1.3273.
The low of wave [ii] must hold above 1.3163.
USDJPY.
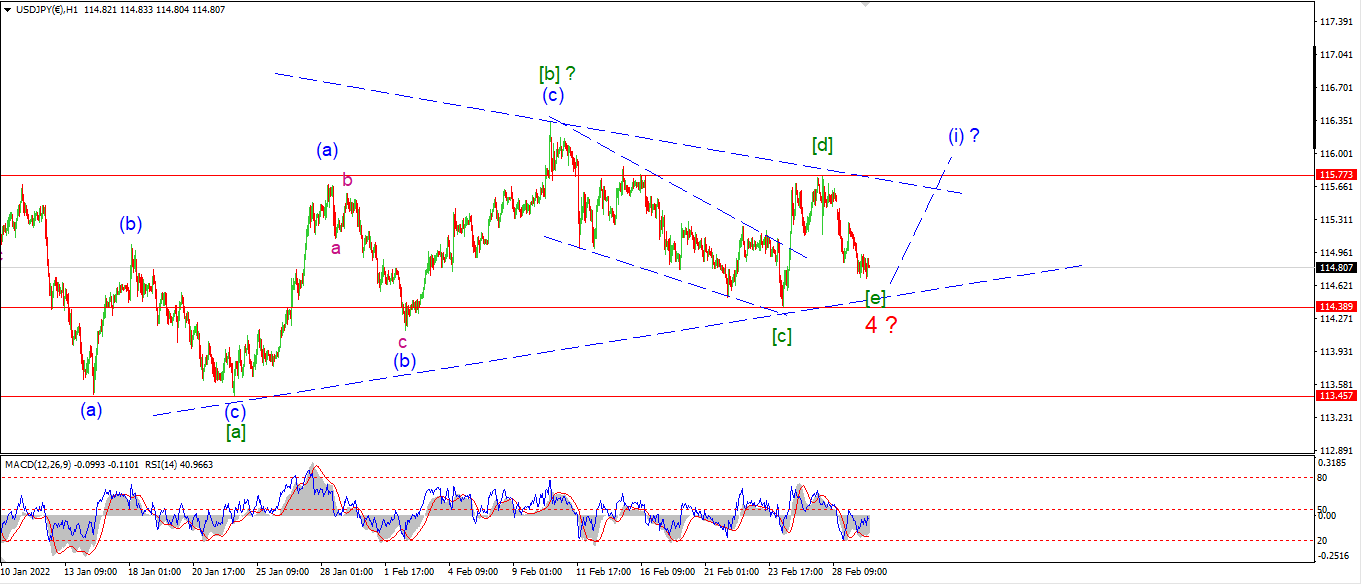
USDJPY 1hr.
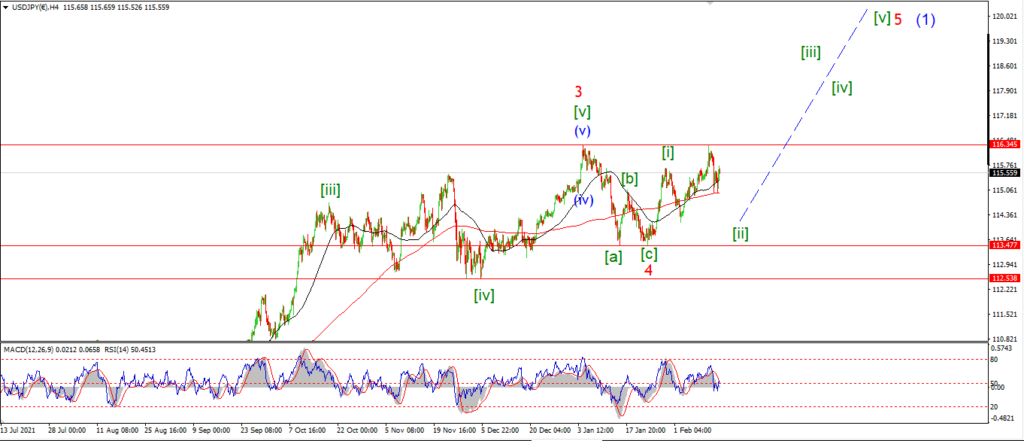
USDJPY 4hr.
USDJPY daily.
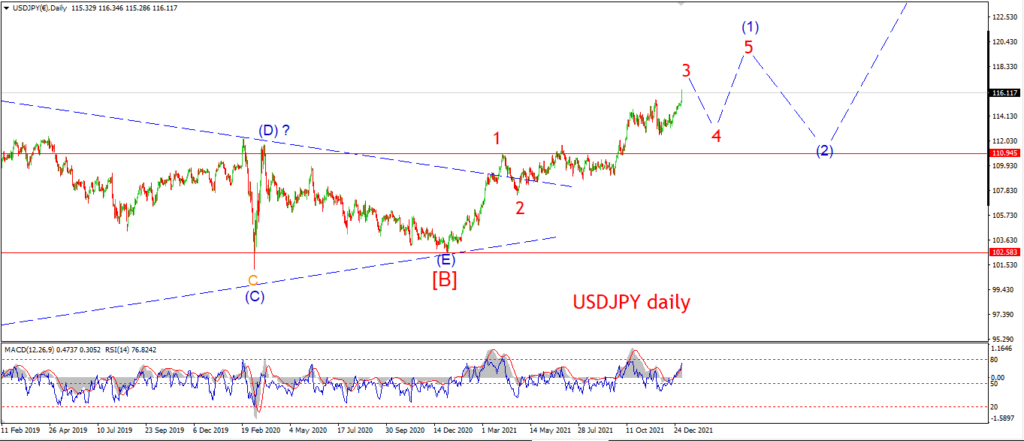
I am taking a closer look at the triangle idea for wave ‘4’ red tonight.
As the price continues sideways and the range continues to contract,
this triangle count gets ever more interesting as an explanation for the action.
There is a few ways of labelling the final two waves of the triangle.
but the count I have shown tonight is the most immediate interpretation.
It is possible that wave [d] and [e] will continue to drift sideways over the coming week,
but that should produce the same results in the end.
That is a rally to begin a larger move higher into wave ‘5’ red.
Tomorrow;
Watch for that low at 114.39 to hold.
A break above 115.77 again will signal wave (i) of [i] of ‘5’ has begun.
DOW JONES.
DOW 1hr.
DOW 4hr
DOW daily.
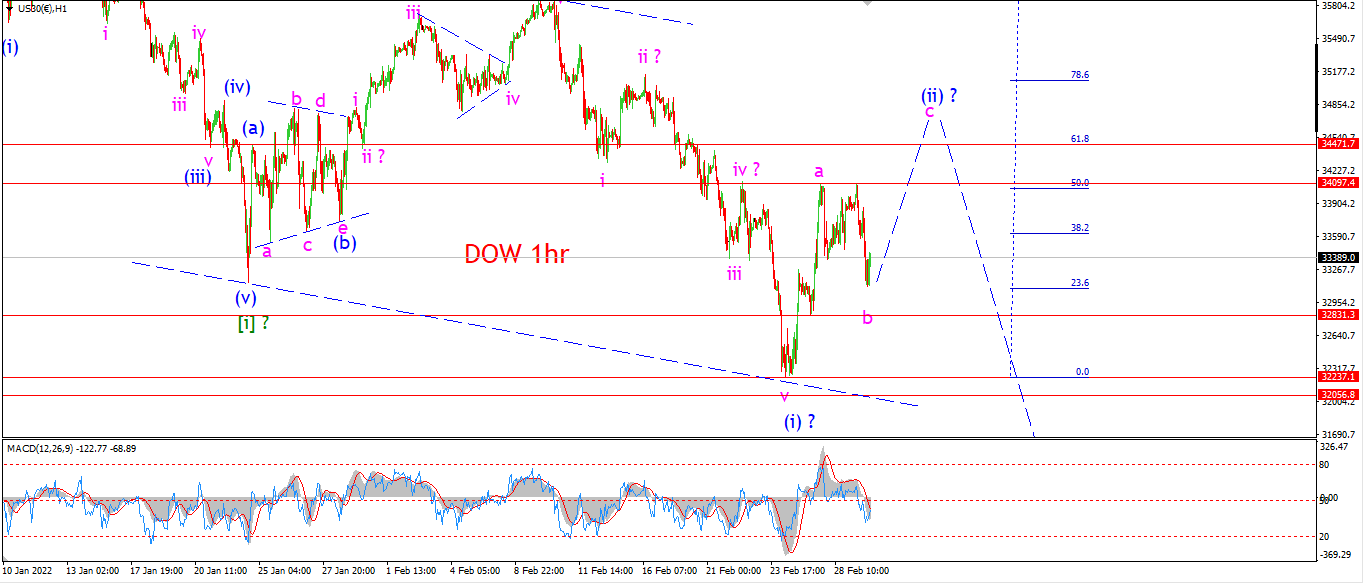
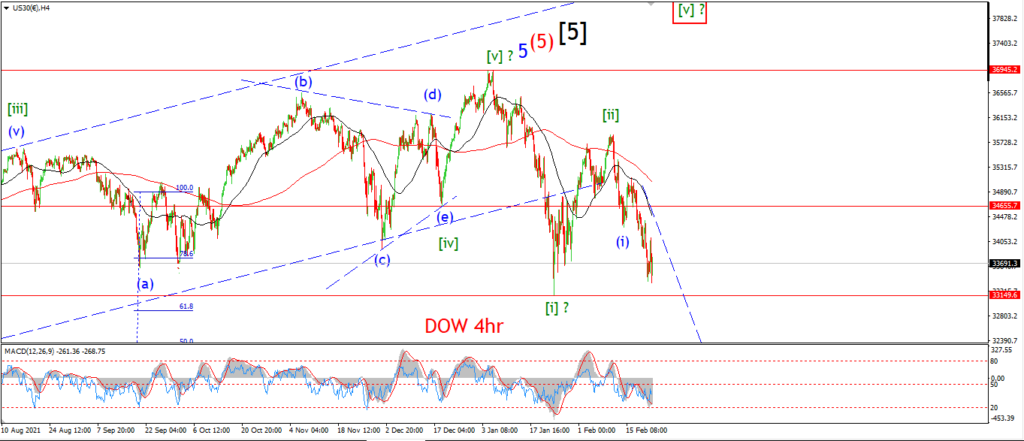
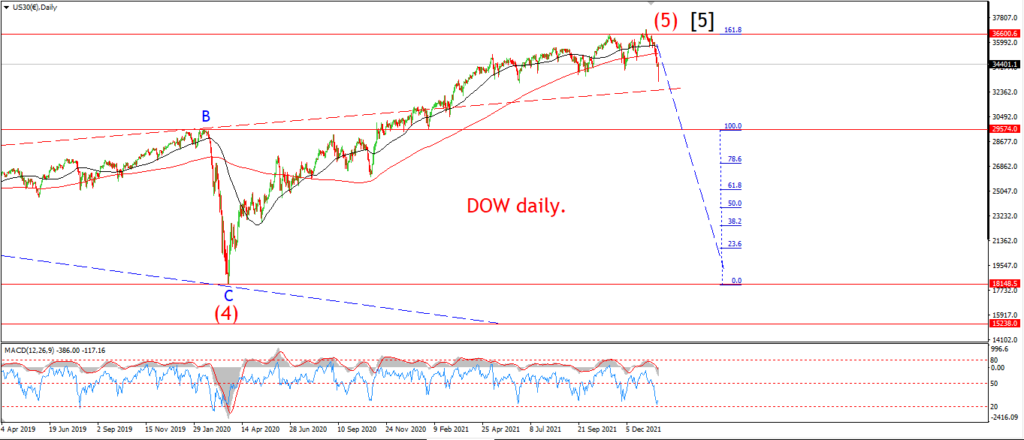
A different view on wave (ii) tonight after another pretty corrective looking trade today.
the drop into the low of todays session is labelled wave ‘b’ of (ii).
Where wave ‘b’ is an expanded flat correction.
Wave ‘c’ of (ii) should head higher beginning tomorrow in this scenario.
And a wave ‘c’ rally should bring us up to that 62% retracement level at 34470 again.
Tomorrow;
Watch for the low at wave (i) to hold and wave ‘b’ to complete above 32230.
Wave ‘c’ should begin early tomorrow and break above 34100 at a minimum.
GOLD
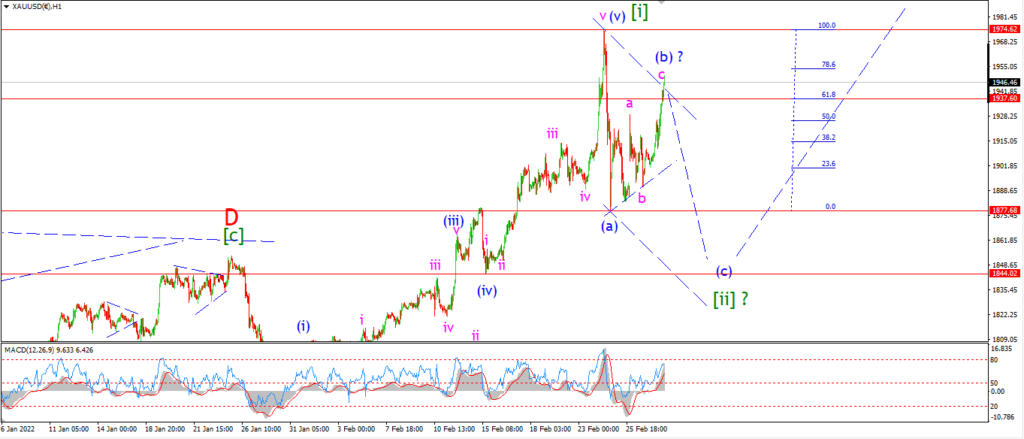
GOLD 1hr.
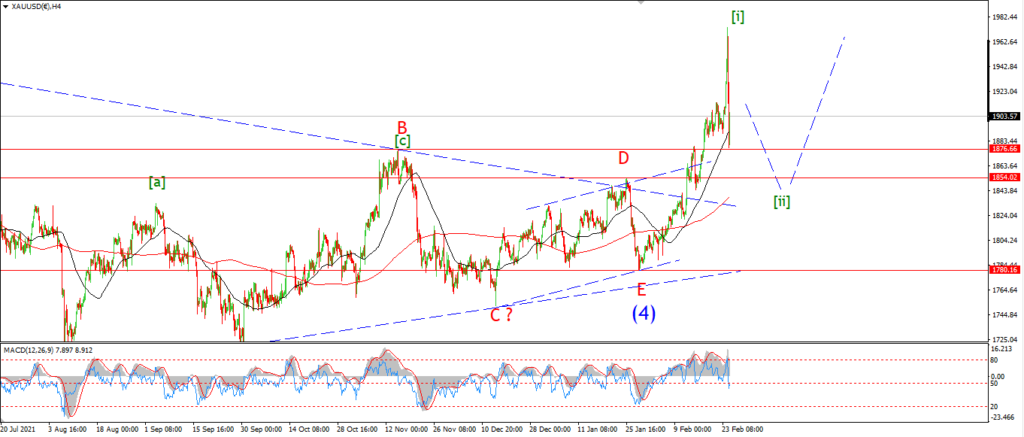
GOLD 4hr.
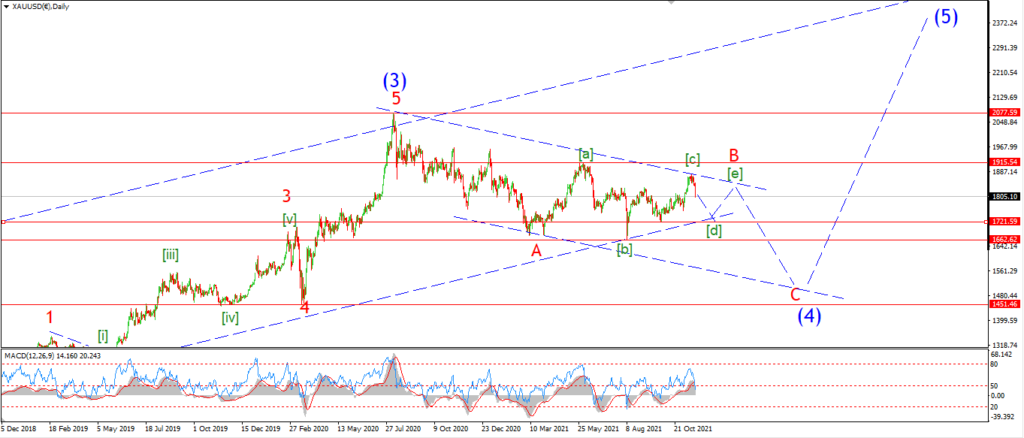
GOLD daily.
The triangle for wave (b) was ruled out today with a break above the wave ‘a’ high.
The pattern in wave (b) has now traced out a flat correction higher.
Waves ‘a’ and ‘b’ traced out 3 waves each,
With wave ‘c’ completing five waves up again this evening.
Wave (b) has hit the 62% retracement level of wave (a).
and now it is time for wave (c) to fall again tomorrow to break below 1877 at a minimum.
Tomorrow;
Watch for wave (b) to complete and then turn lower into wave (c) pretty early tomorrow.
CRUDE OIL.
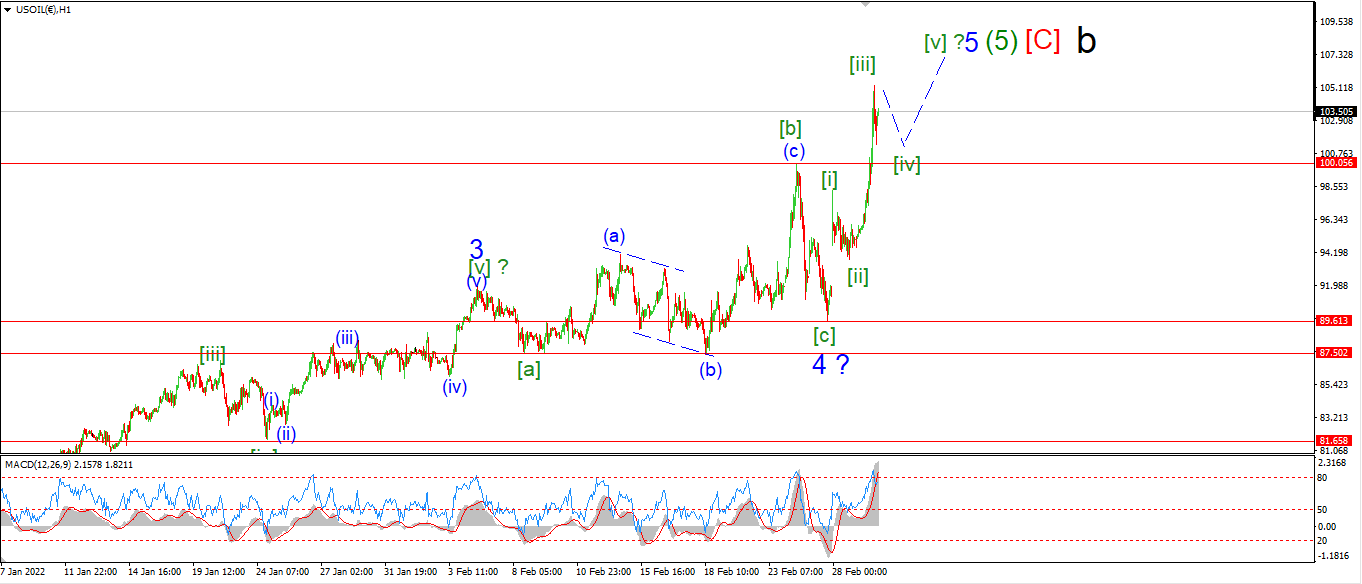
CRUDE OIL 1hr.
CRUDE OIL 4hr.

CRUDE OIL daily.
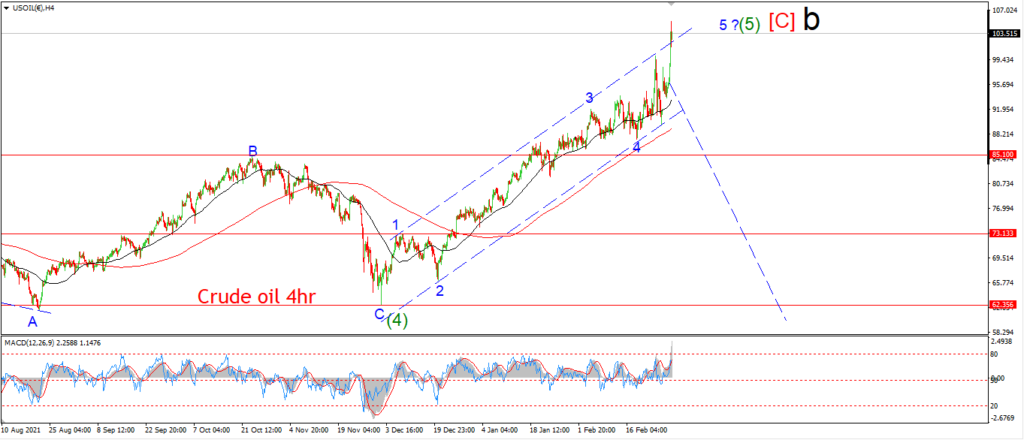
Another new high in crude today has called a halt to my ambitions to call this top here!
So I want to zoom out tonight.
Take a look at the daily chart to start with.
We have a five wave pattern higher in wave [C] that has filled a channel.
WAve [C] has broken above the wave [A] high,
and over the last week we have a throw-over playing out at the top of wave (5).
the 4hr chart shows a filled channel,
a possible five wave pattern, although it is a bit wild towards the top.
And another throw-over in wave ‘5’ of (5).
The hourly chart is where things get hard to decipher.
If wave ‘4’ was an expanded flat correction,
then maybe we saw the low of wave ‘4’ come in at last weeks lows.
The hourly pattern is proving very difficult to nail down lately.
Those whipsaw moves do not help the matter!
But I do know for sure that this pattern will complete in wave (5) as a solid five wave structure.
We will see soon enough if that final wave ‘5’ of (5) is now in play as suggested here.
S&P 500.
S&P 500 1hr
S&P 500 4hr
S&P 500 daily.
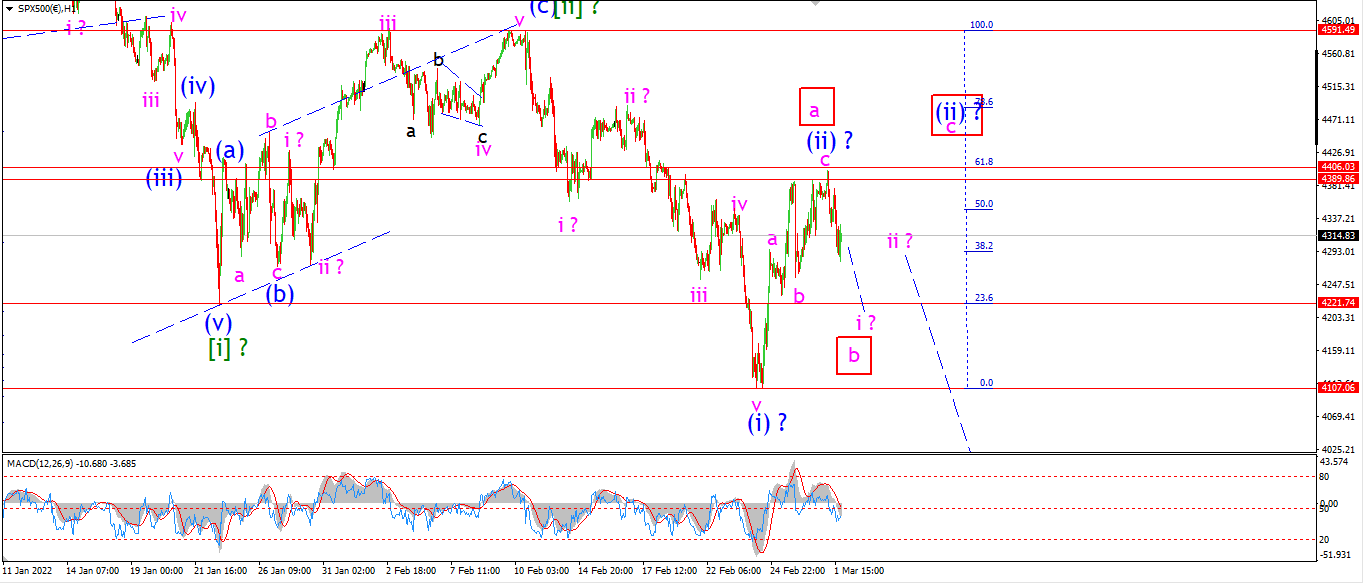
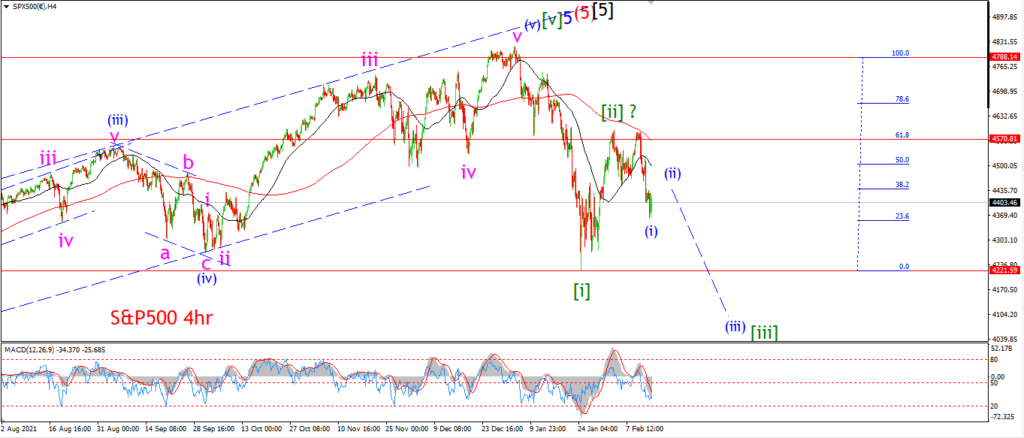
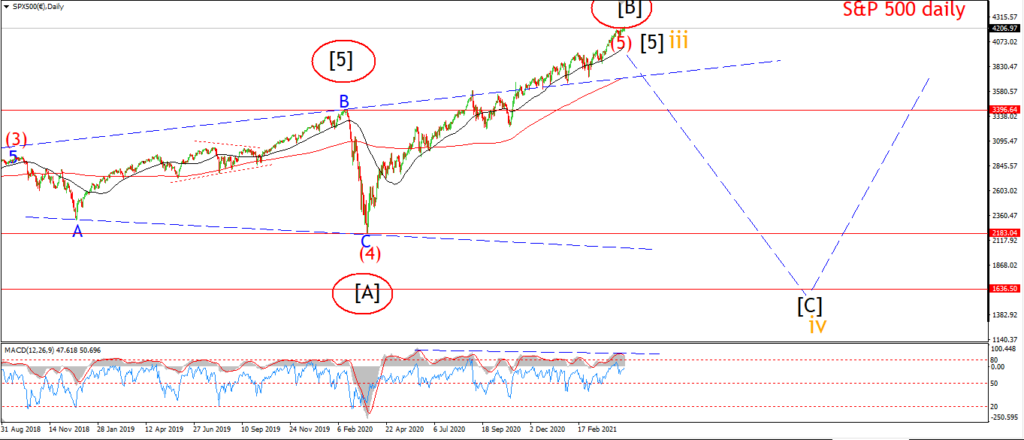
If the new pattern in the dow works out in wave (ii).
then I suspect the alternate pattern in the S&P will be triggered also.
The price has fallen today off that wave (ii) high,
but I cannot label this decline as a full five wave decline in wave ‘i’ yet.
This can easily happen tomorrow if we get another nice spike lower to fall into the 4200 area again.
That will be a vote in favor of the main count.
And if we see the market build another lower high in wave ‘ii’ this week,
that will be a clear signal pointing to an acceleration lower in wave ‘iii’ of (iii) next week.
Tomorrow;
Watch for wave ‘i’ of (iii) to trace out a clear five wave pattern lower to break 4200 again.
SILVER.
SILVER 1hr
SILVER 4hr.
SILVER daily.
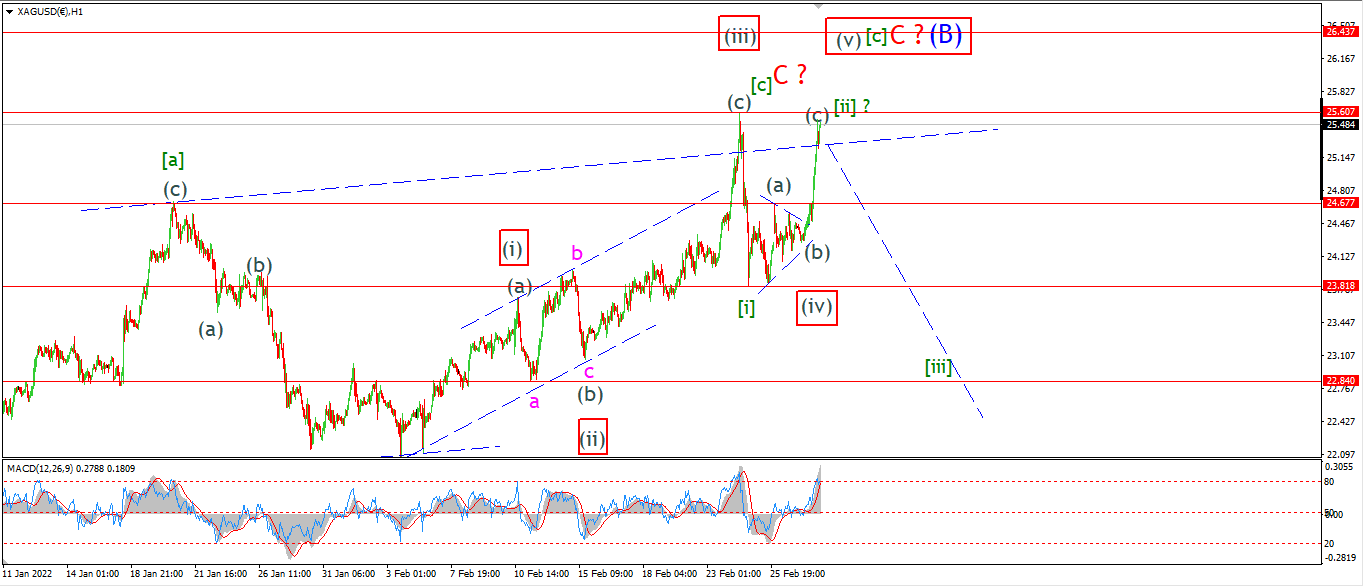
Silver blasted higher today in a far more vigorous fashion than gold.
And that action does push the boundaries of this current count for wave ‘C’ of (B).
With that in mind I have introduced a possible alternate for wave [c] of ‘C’.
It is a simple five wave pattern rather than the previous three wave rally from before.
The main count is still valid until we see a break of the previous highs at 25.60.
Tomorrow;
Watch for a sharp reversal back below 25.00 again to signal wave [ii] is complete.
A break of 25.60 will trigger the alternate count,
but even that pattern is close to complete itself.
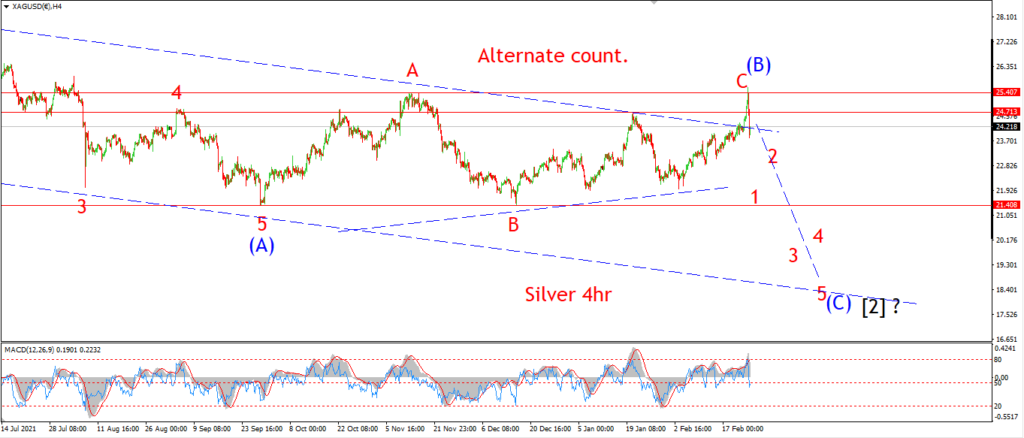
The next time we see a break of 25.00,
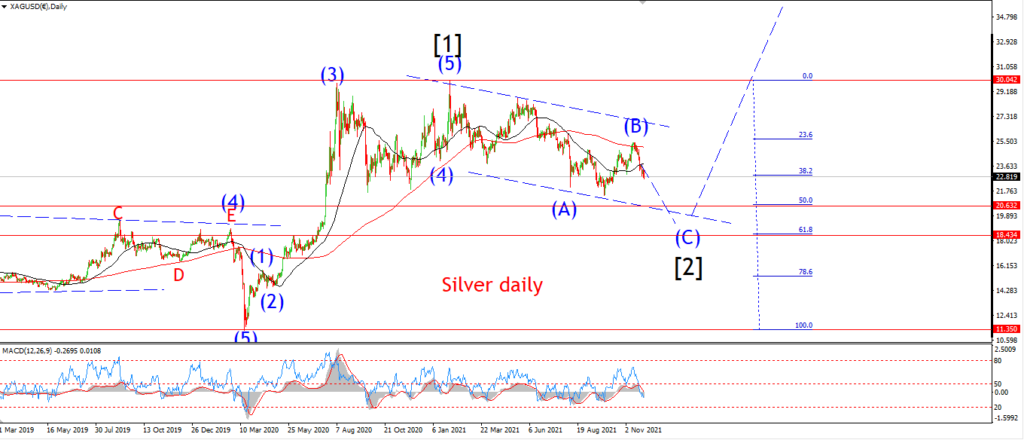
that should lead to a larger decline into wave ‘C’ red as per the 4hr count.
BITCOIN
BITCOIN 1hr.
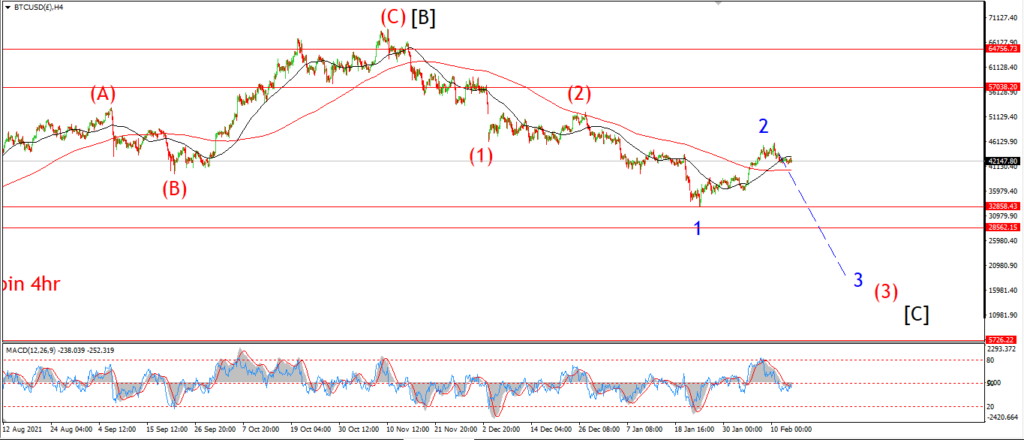
BITCOIN 4hr.

BITCOIN daily.
….
FTSE 100.
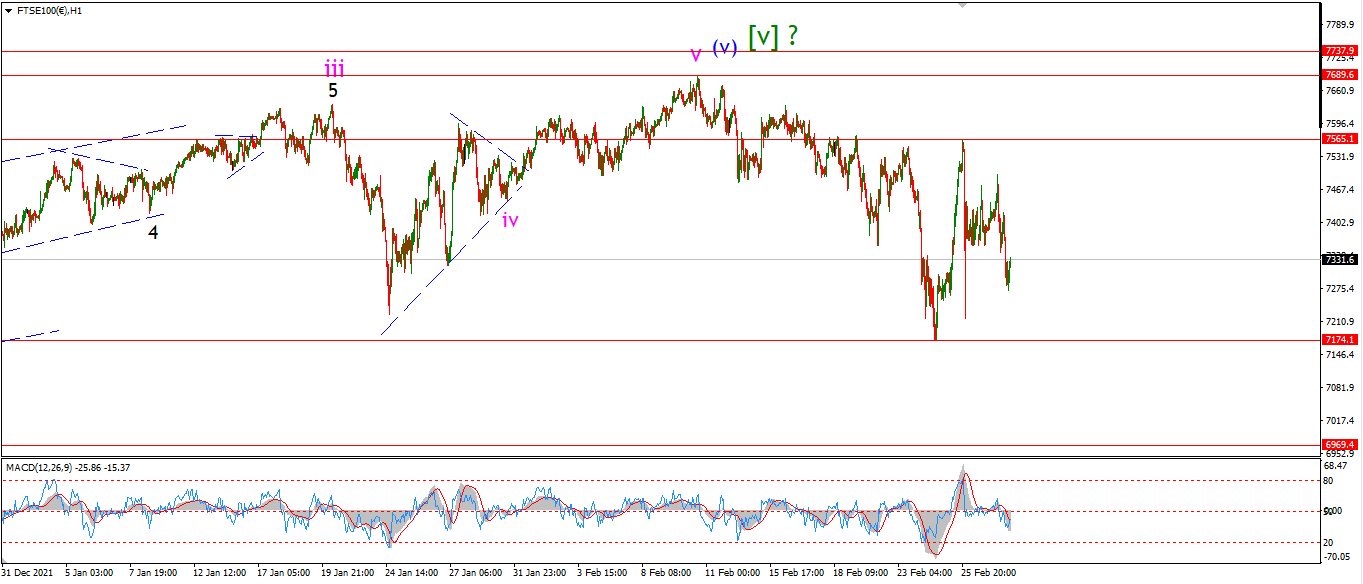
FTSE 100 1hr.
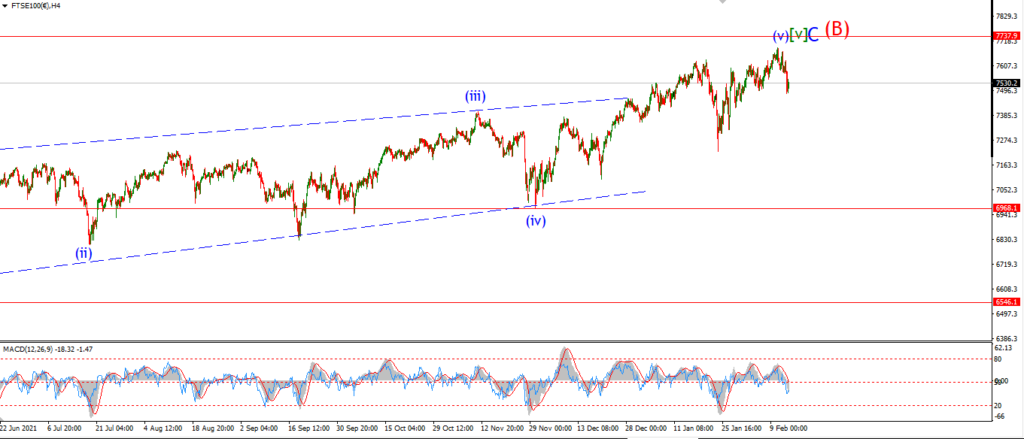
FTSE 100 4hr.

FTSE 100 daily.
….
DAX.
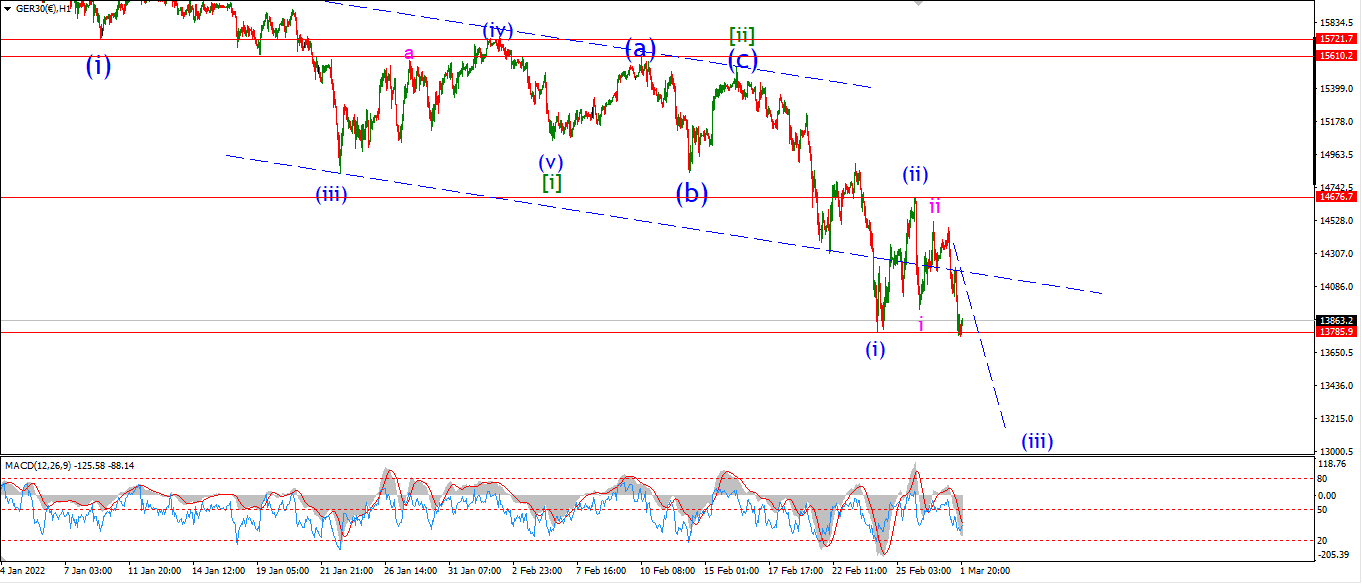
DAX 1hr
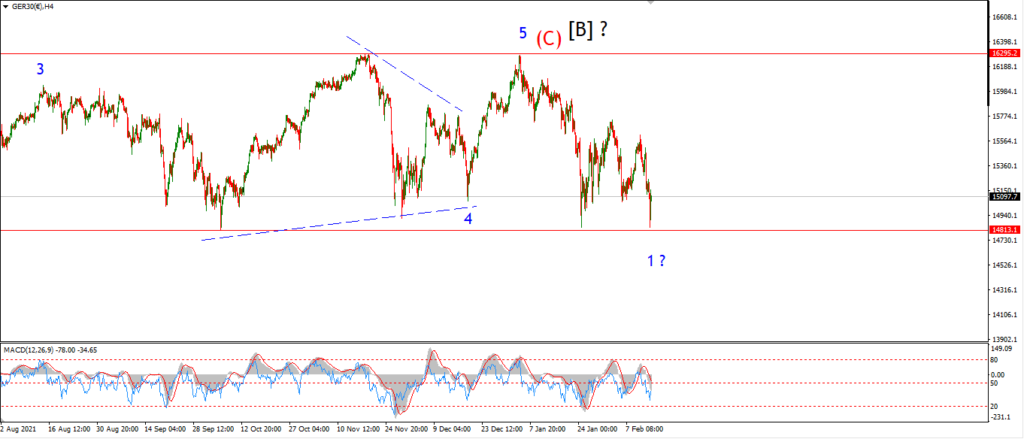
DAX 4hr
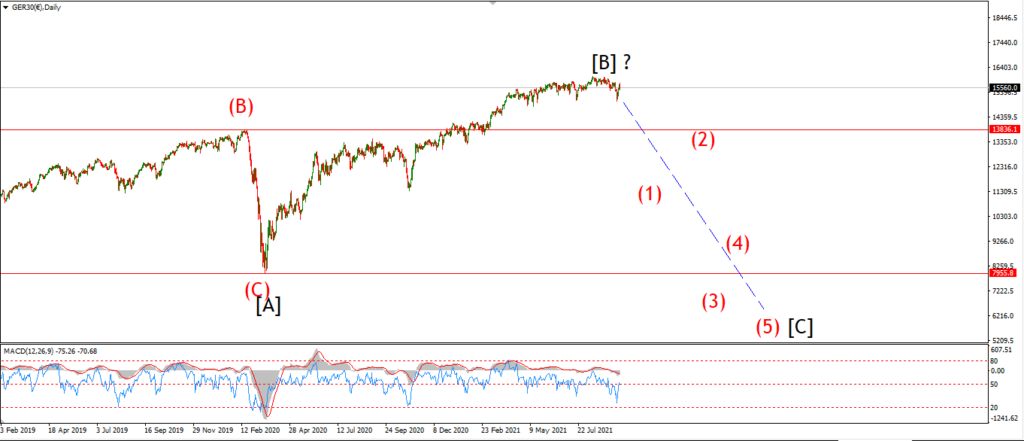
DAX daily.
….
NASDAQ 100.
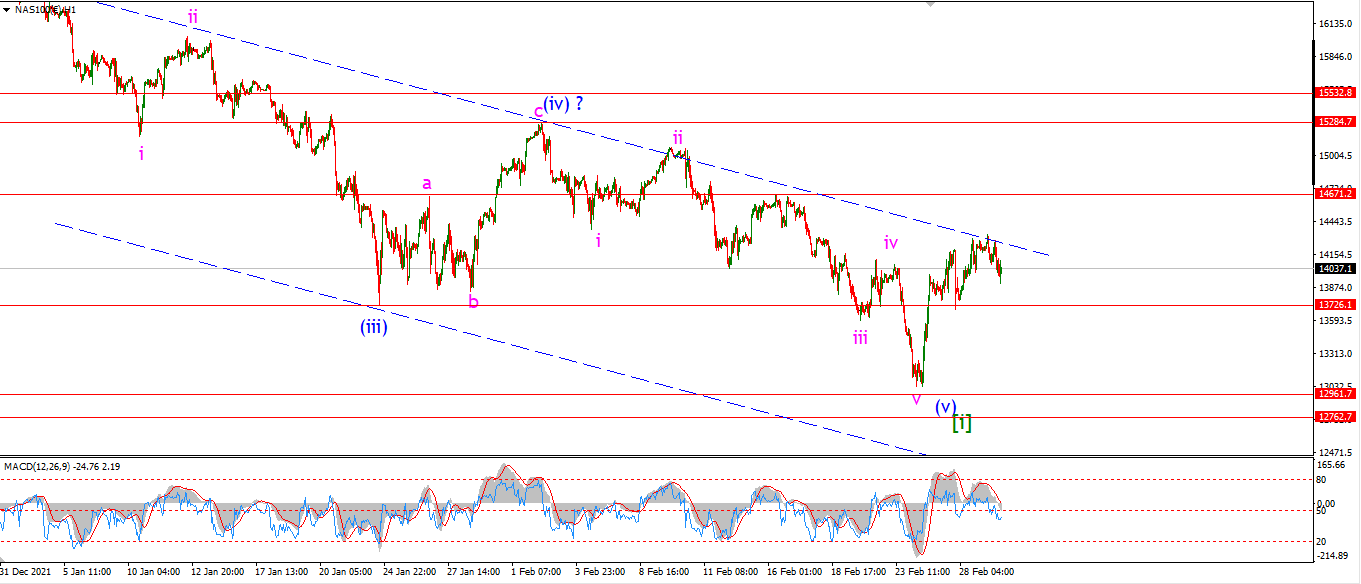
NASDAQ 1hr
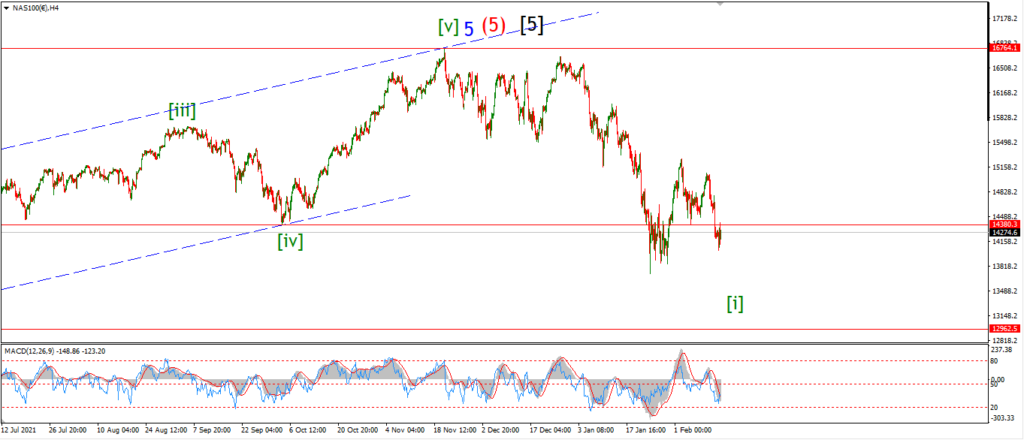
NASDAQ 4hr.
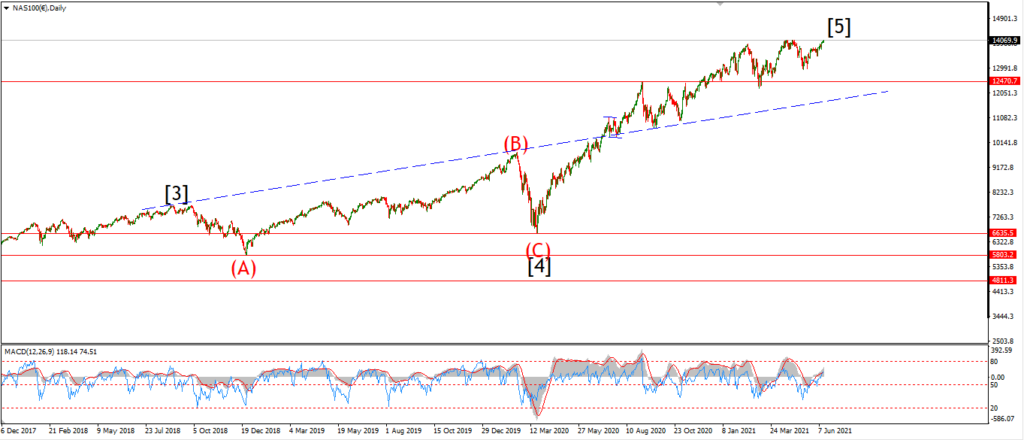
NASDAQ daily.
….