
[vc_row][vc_column][vc_separator border_width=”5″][/vc_column][/vc_row]
[vc_row][vc_column][vc_column_text]
It’s March the first.
Is it just me,
or is time just slipping away from between my fingers!
before you know it the month of February is gone.
Lots to get to tonight,
here we go.
[/vc_column_text][/vc_column][/vc_row]
[_s2If current_user_can(access_s2member_ccap_eurusd)]
[vc_row][vc_column][vc_separator border_width=”5″][/vc_column][/vc_row]
[vc_row][vc_column][vc_column_text]
EURUSD
[/vc_column_text][/vc_column][/vc_row]
[vc_row][vc_column][vc_separator border_width=”5″][/vc_column][/vc_row][vc_row][vc_column width=”2/3″][vc_custom_heading text=”1 hr” use_theme_fonts=”yes”][vc_column_text]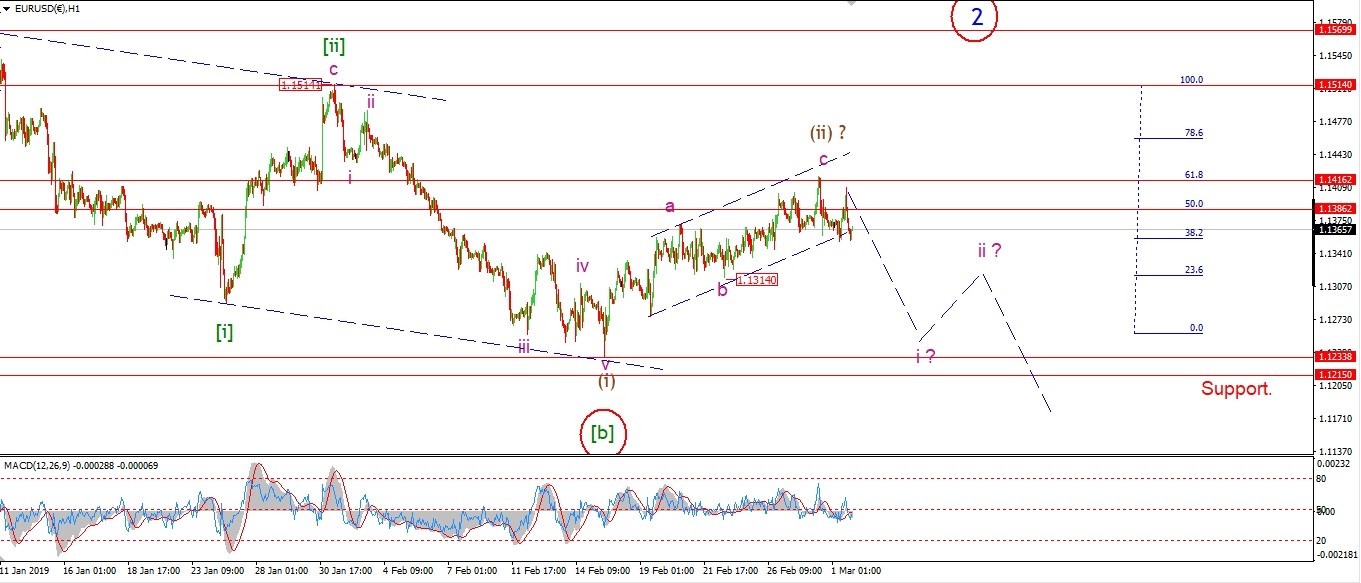 [/vc_column_text][/vc_column][vc_column width=”1/3″][vc_custom_heading text=”4 Hours” use_theme_fonts=”yes”][vc_column_text]
 [/vc_column_text][vc_custom_heading text=”Daily” use_theme_fonts=”yes”][vc_column_text]
 [/vc_column_text][/vc_column][/vc_row]
[vc_row][vc_column][vc_column_text]
The wave count in EURUSD has been moved up by one degree.
You can see on the daily chart that the decline off the wave [B] high is labelled wave (1) and (2).
And now we are dropping in a series of impulse waves lower into wave (3).
The price has stalled at the 62% retracement level of wave (i).
With a three wave move off that high so far.
This decline must now continue lower in five waves next week to indicate that wave (iii) brown has begun.
If wave (iii) of [iii] is now about to begin,
then the market should now move out of its sideways motion and begin a long descent from here.
Monday;
Watch for wave ‘i’ down to create a five wave structure lower.
[/vc_column_text][/vc_column][/vc_row]
[/_s2If]
[_s2If current_user_can(access_s2member_ccap_gbpusd)]
[vc_row][vc_column][vc_separator border_width=”5″][/vc_column][/vc_row][vc_row][vc_column][vc_column_text]
GBPUSD
[/vc_column_text][/vc_column][/vc_row][vc_row][vc_column][vc_separator border_width=”5″][/vc_column][/vc_row][vc_row][vc_column width=”2/3″][vc_custom_heading text=”1 hr” use_theme_fonts=”yes”][vc_column_text]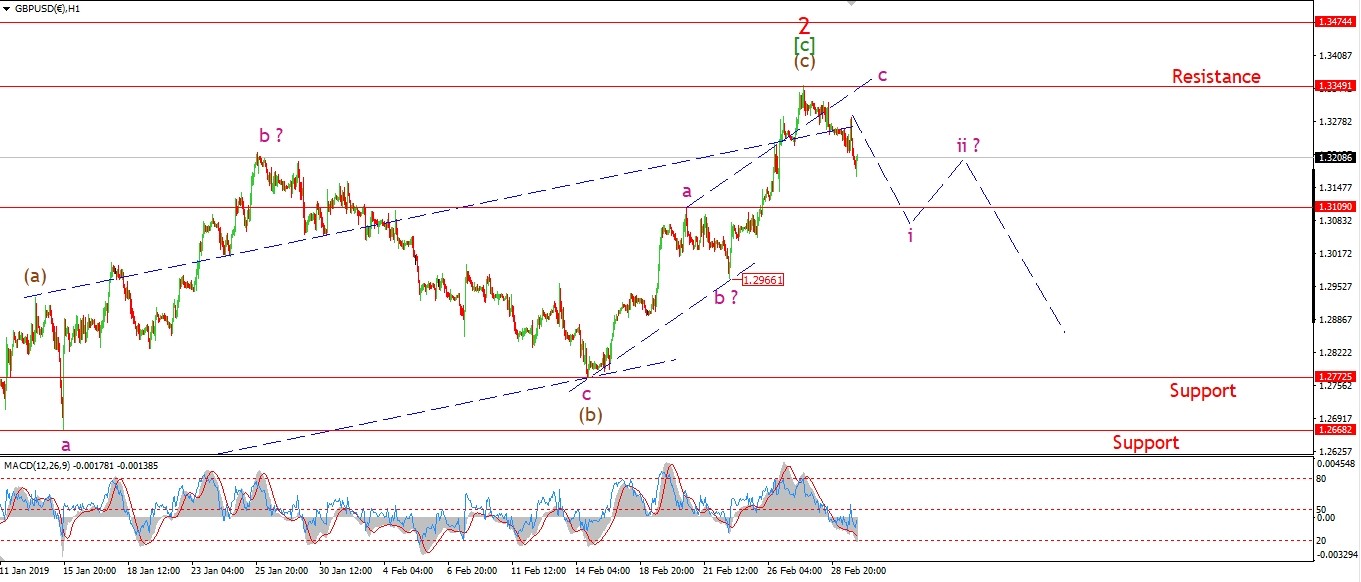 [/vc_column_text][/vc_column][vc_column width=”1/3″][vc_custom_heading text=”4 Hours” use_theme_fonts=”yes”][vc_column_text]
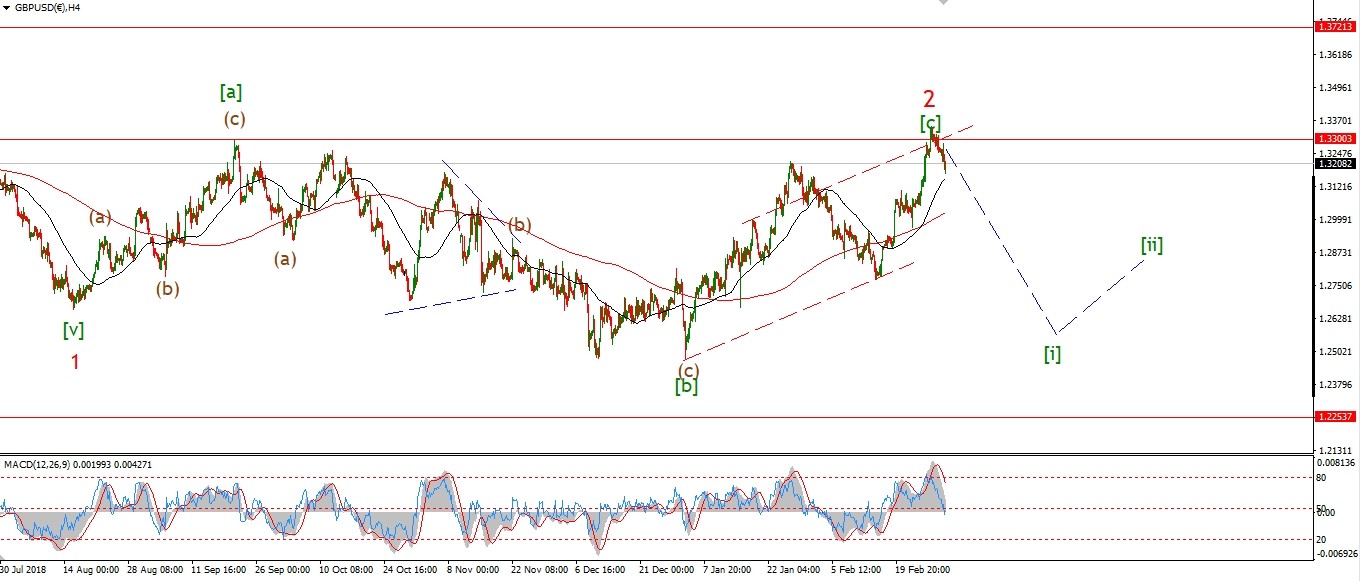 [/vc_column_text][vc_custom_heading text=”Daily” use_theme_fonts=”yes”][vc_column_text]
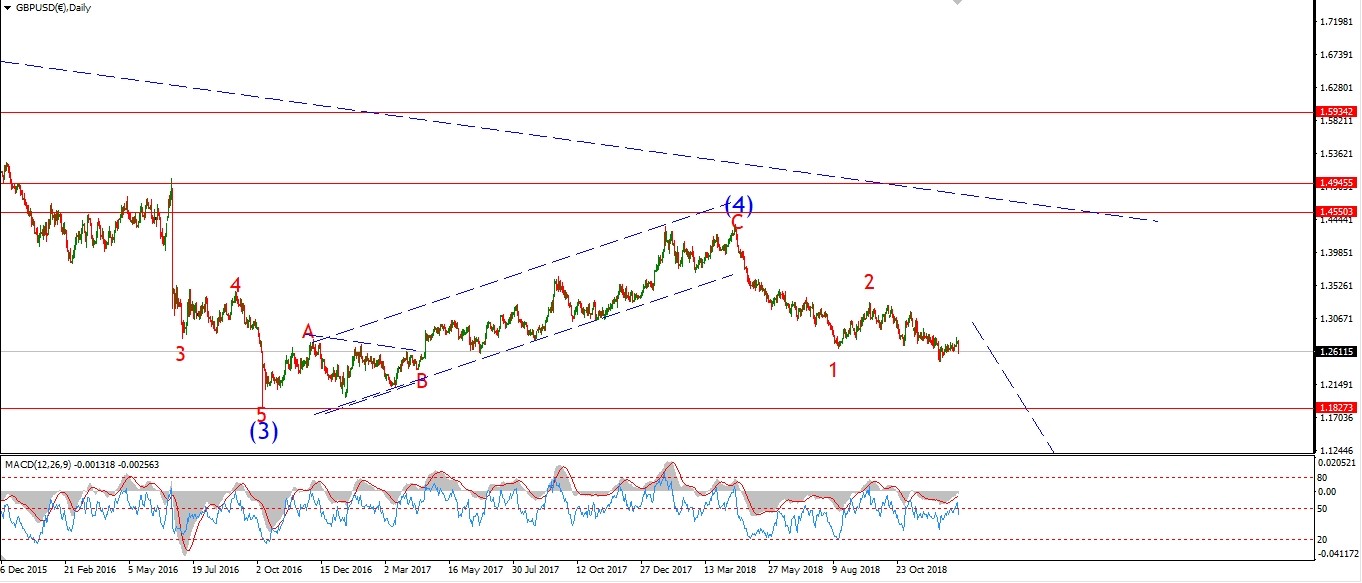 [/vc_column_text][/vc_column][/vc_row]
[vc_row][vc_column][vc_column_text]
I have altered the short term count slightly this evening.
Wave (c) is now shown as a three wave structure higher.
And the market is now moving lower in a possible impulse wave ‘i’ of (i) of [i] of ‘3’!
So,
if wave ‘2’ is now complete,
and wave ‘3’ has begun,
then we are at a point with a very large downside potential.
Next week;
The job is the same as always when we reach a large degree turning point.
Watch for a five wave move into the direction of the new trend.
Wave ‘i’ may be underway now as the market is dropping off sharply now.
lets see if wave ‘i’ down creates that five wave move.
[/vc_column_text][/vc_column][/vc_row]
[/_s2If]
[_s2If current_user_can(access_s2member_ccap_usdjpy)]
[vc_row][vc_column][vc_separator border_width=”5″][/vc_column][/vc_row][vc_row][vc_column][vc_column_text]
USDJPY
[/vc_column_text][/vc_column][/vc_row][vc_row][vc_column][vc_separator border_width=”5″][/vc_column][/vc_row][vc_row][vc_column width=”2/3″][vc_custom_heading text=”1 hr” use_theme_fonts=”yes”][vc_column_text]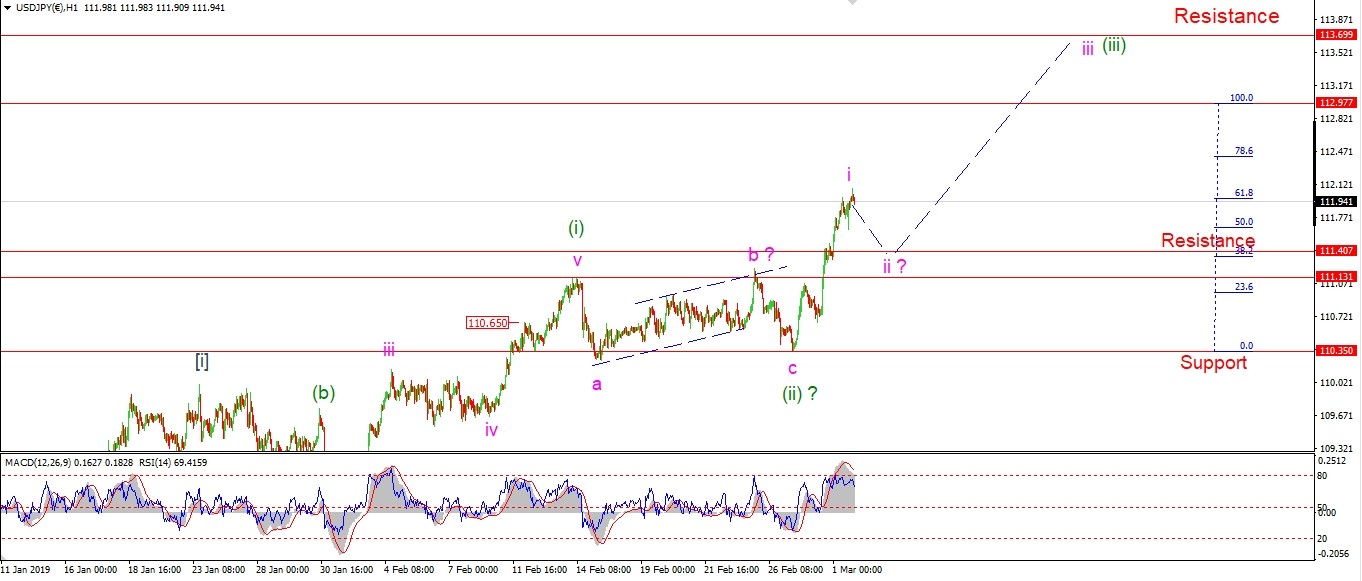 [/vc_column_text][/vc_column][vc_column width=”1/3″][vc_custom_heading text=”4 Hours” use_theme_fonts=”yes”][vc_column_text]
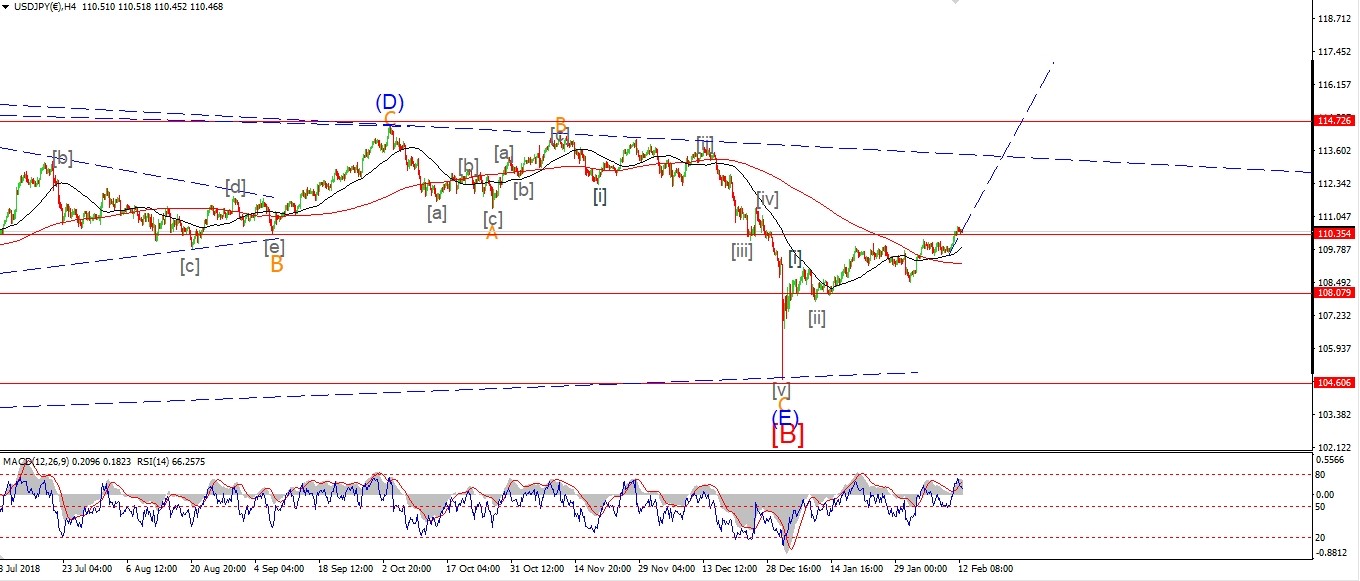 [/vc_column_text][vc_custom_heading text=”Daily” use_theme_fonts=”yes”][vc_column_text]
 [/vc_column_text][/vc_column][/vc_row]
[vc_row][vc_column][vc_column_text]
I think we now have five waves up in wave ‘i’ of (iii) now in place off the wave (ii) low at 110.35.
The market should correct slightly on Monday in wave ‘ii’,
This should complete an impulse wave higher to signal wave (iii) has begun.
Monday;
110.35 must now hold.
Watch for wave ‘ii’ to correct back to about 111.40 in three waves.
Wave ‘iii’ of (iii) should then continue higher
towards the target area at 113.00.
[/vc_column_text][/vc_column][/vc_row]
[/_s2If]
[_s2If current_user_can(access_s2member_ccap_dow_jones)]
[vc_row][vc_column][vc_separator border_width=”5″][/vc_column][/vc_row][vc_row][vc_column][vc_column_text]
DOW JONES INDUSTRIALS
[/vc_column_text][/vc_column][/vc_row][vc_row][vc_column][vc_separator border_width=”5″][/vc_column][/vc_row][vc_row][vc_column width=”2/3″][vc_custom_heading text=”1 hr” use_theme_fonts=”yes”][vc_column_text]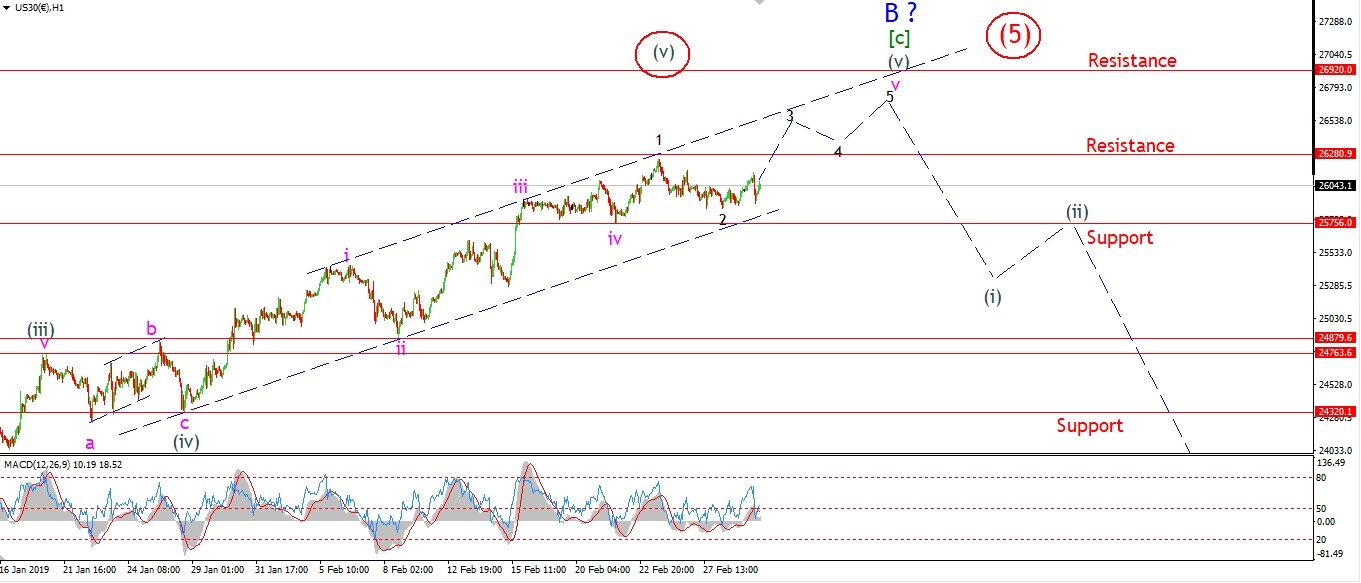 [/vc_column_text][/vc_column][vc_column width=”1/3″][vc_custom_heading text=”4 Hours” use_theme_fonts=”yes”][vc_column_text]
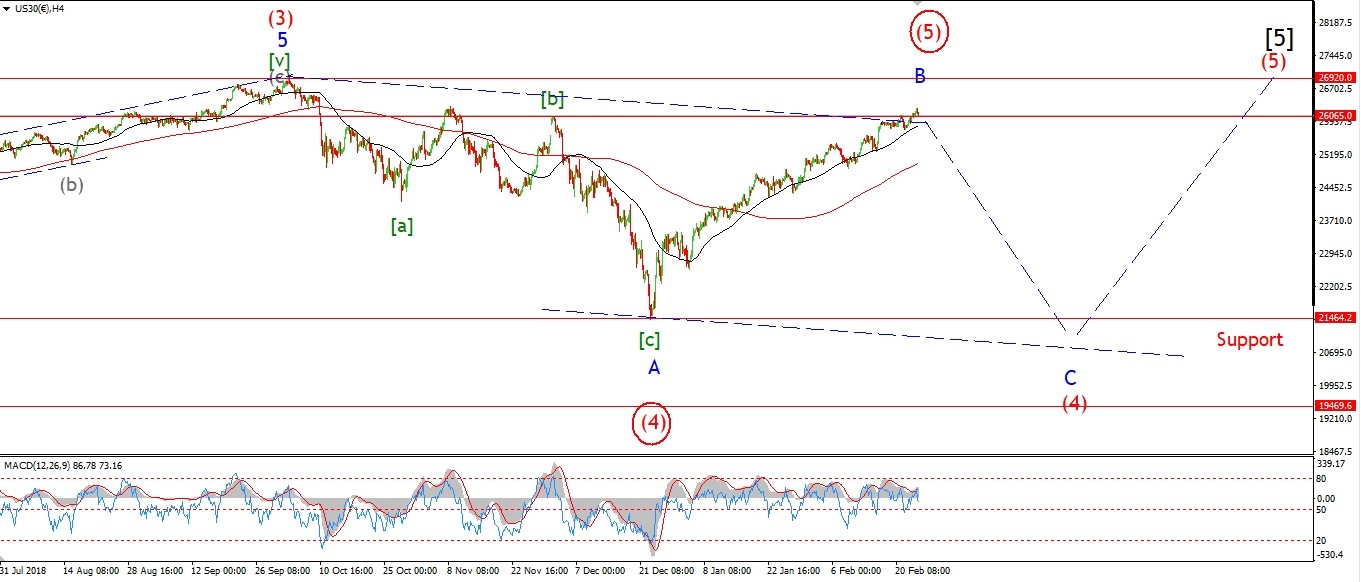 [/vc_column_text][vc_custom_heading text=”Daily” use_theme_fonts=”yes”][vc_column_text]
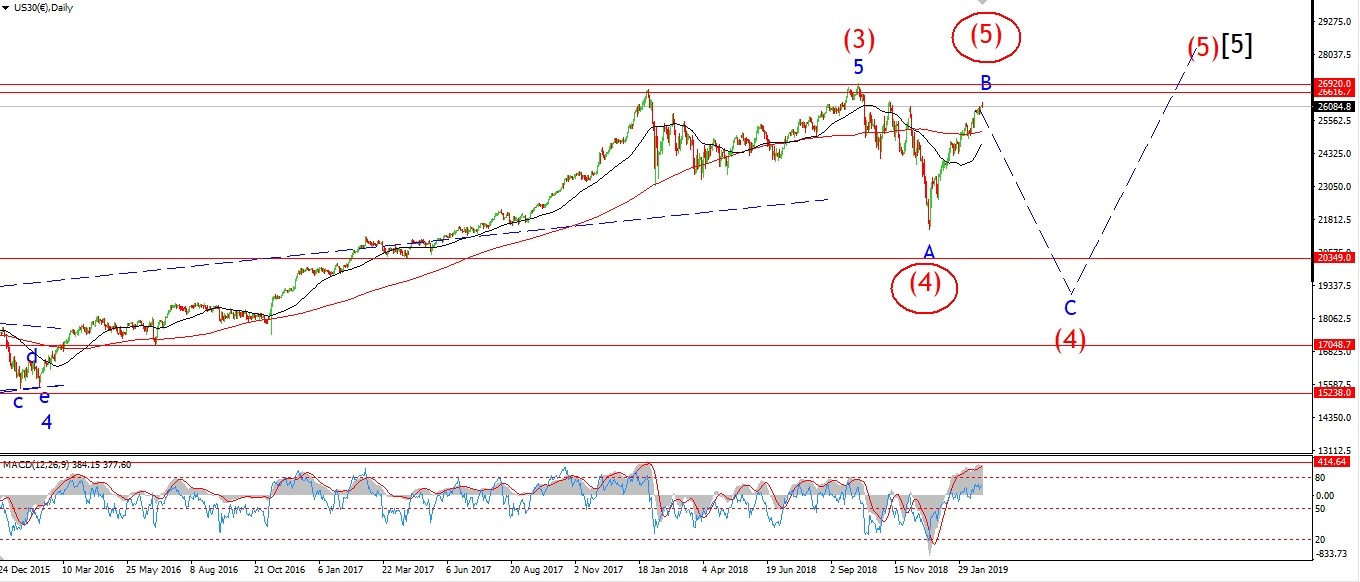 [/vc_column_text][/vc_column][/vc_row]
[vc_row][vc_column][vc_column_text]
That all time high at 26920 is like a shiny silver coin to a magpie now!
Impossible to ignore,
and waiting to be grabbed.
The market is gravitating towards it!
But I fear a new high will be confirmation of wave (5) of [5],
and this will be the last time in our lifetimes that these levels will be seen.
So maybe we should savor the moment a little,
like a sunset on a warm summers eve!
Winter is coming.
I have shown a correction in wave ‘2’ off the highs this week.
If the market breaks 26280 early next week,
that will confirm wave ‘3’ of ‘v’ is underway.
And then we will be within reach of that resistance level.
Could we reach a new all time high next week,
anything is possible when the market is this reckless!
Next week;
I am still calling this rally wave ‘B’ of (4),
with the very strong possibility of that alternate wave (5) red.
Watch for wave ‘2’ to hold above 25756,
and wave ‘3’ to turn higher again.
[/vc_column_text][/vc_column][/vc_row]
[/_s2If]
[_s2If current_user_can(access_s2member_ccap_gold)]
[vc_row][vc_column][vc_separator border_width=”5″][/vc_column][/vc_row][vc_row][vc_column][vc_column_text]
GOLD
[/vc_column_text][/vc_column][/vc_row][vc_row][vc_column][vc_separator border_width=”5″][/vc_column][/vc_row][vc_row][vc_column width=”2/3″][vc_custom_heading text=”1 hr” use_theme_fonts=”yes”][vc_column_text]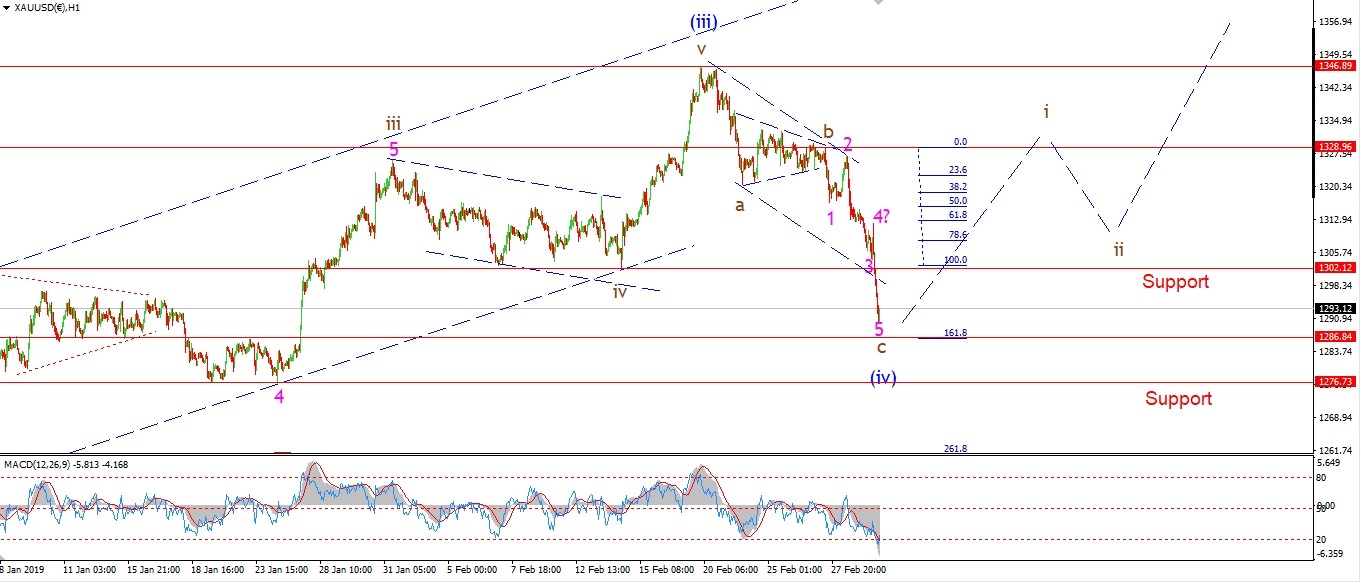 [/vc_column_text][/vc_column][vc_column width=”1/3″][vc_custom_heading text=”4 Hours” use_theme_fonts=”yes”][vc_column_text]
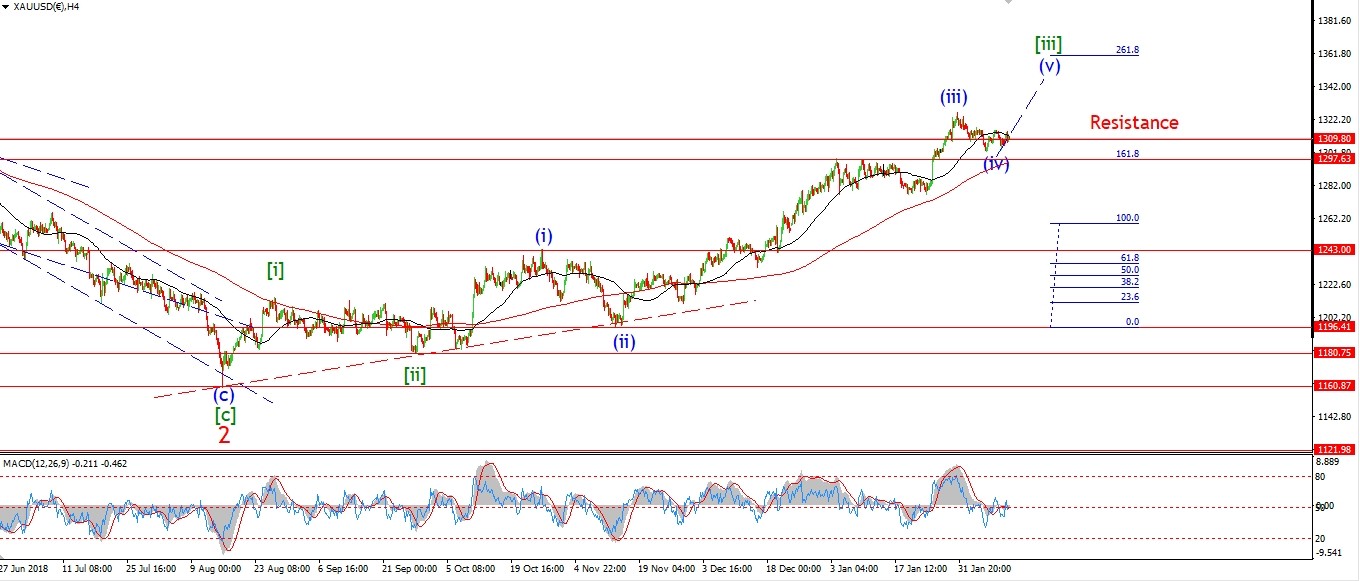 [/vc_column_text][vc_custom_heading text=”Daily” use_theme_fonts=”yes”][vc_column_text]
 [/vc_column_text][/vc_column][/vc_row]
[vc_row][vc_column][vc_column_text]
Just like that,
the market snaps and the alternate count gets triggered for GOLD.
The price took a real dive today in a five wave pattern.
The price broke through the 1302 support and is now heading for the lower support at 1276.
This action triggered the alternate count for wave (iv) blue.
The decline is still in three waves so far.
And should turn out to be corrective.
If wave (iv) is a straight forward three wave decline
then 1276 should be enough to complete it and we can again look higher to begin wave (v) next week.
Monday;
Wave ‘c’ has already traced out a five wave drop.
And wave ‘c’ reaches 162% of wave (a) at 1286.
So I’m fairly confident that we should see a turn higher again early next week.
[/vc_column_text][/vc_column][/vc_row]
[/_s2If]
[_s2If current_user_can(access_s2member_ccap_crude)]
[vc_row][vc_column][vc_separator border_width=”5″][/vc_column][/vc_row][vc_row][vc_column][vc_column_text]
U.S CRUDE OIL
[/vc_column_text][/vc_column][/vc_row][vc_row][vc_column][vc_separator border_width=”5″][/vc_column][/vc_row][vc_row][vc_column width=”2/3″][vc_custom_heading text=”1 hr” use_theme_fonts=”yes”][vc_column_text]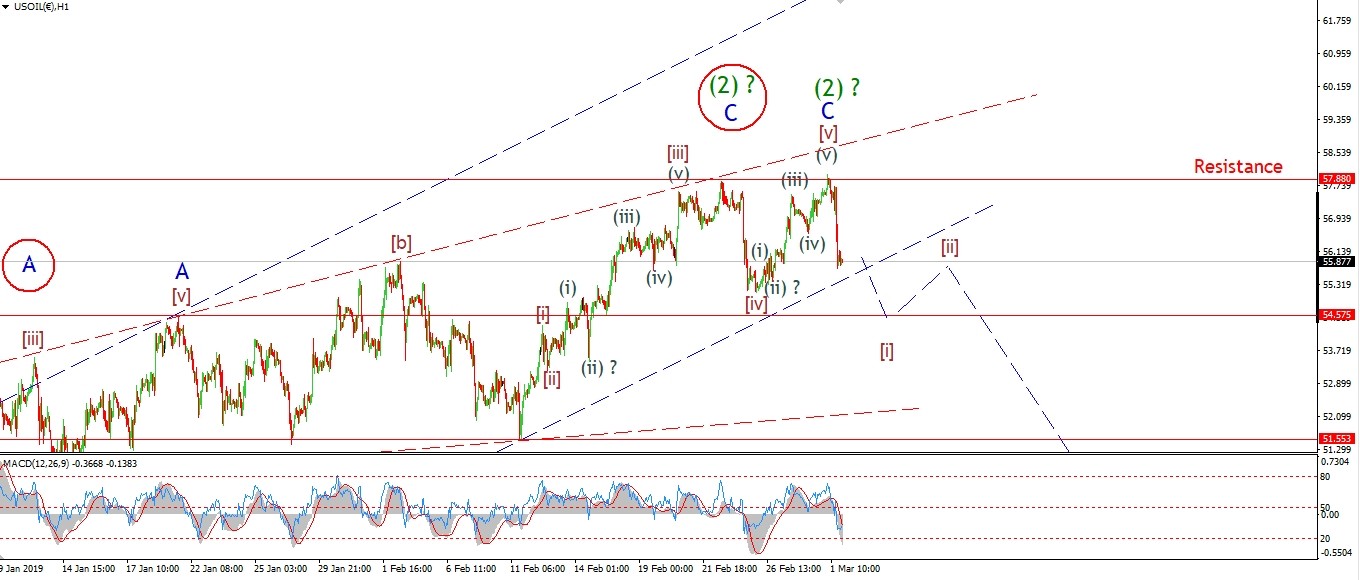 [/vc_column_text][/vc_column][vc_column width=”1/3″][vc_custom_heading text=”4 Hours” use_theme_fonts=”yes”][vc_column_text]
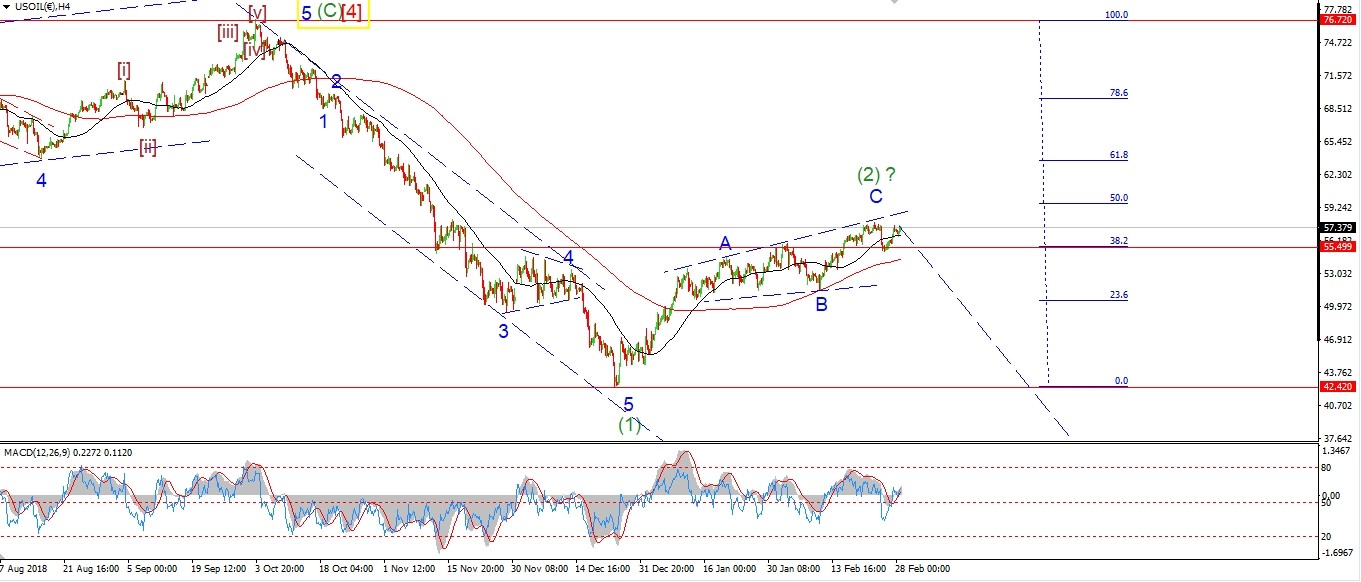 [/vc_column_text][vc_custom_heading text=”Daily” use_theme_fonts=”yes”][vc_column_text]
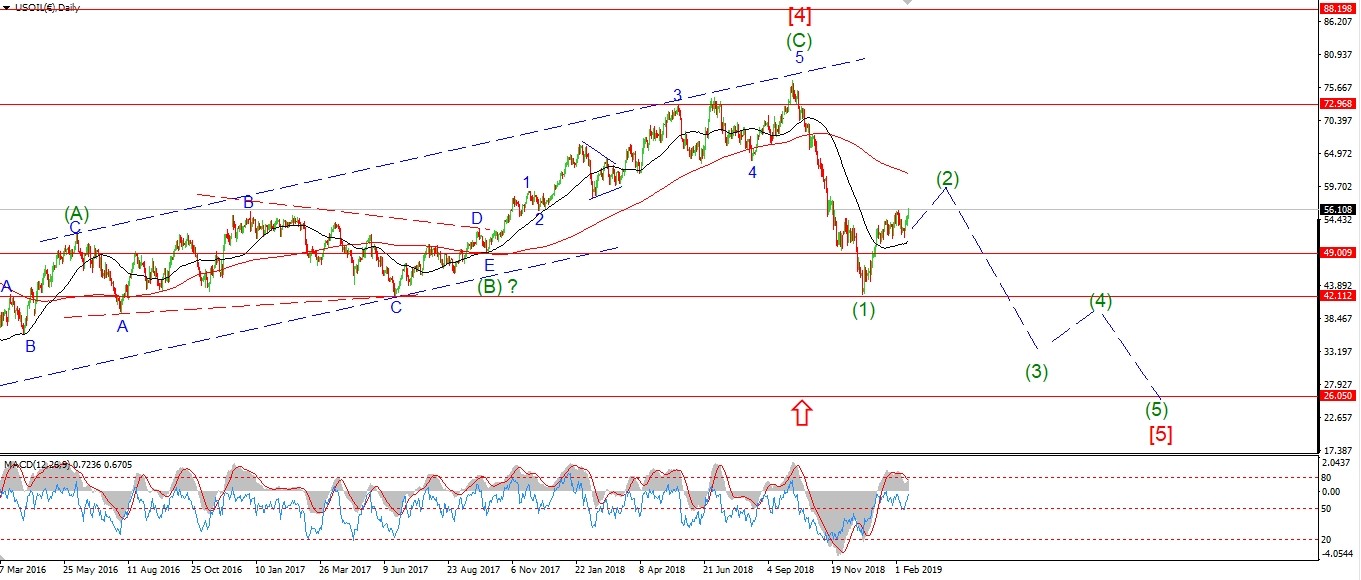 [/vc_column_text][/vc_column][/vc_row]
[vc_row][vc_column][vc_column_text]
Crude reached 57.88 at the overnight highs.
This new high is now labelled wave (v) of [v].
If this is correct,
Then we have reached the final high for wave ‘C’
and now we should expect a bearish signal in the form of a five wave move lower to begin wave ‘1’ of (3).
The market dropped sharply today.
and this is viewed as the beginning of such a signal to the downside in wave [i].
If this decline traces out five waves and breaks below 55.00 again.
And then followed by a three wave correction.
then we will be set to begin the long journey lower into wave (3).
Monday;
Watch for wave [i] down to continue in five waves.
[/vc_column_text][/vc_column][/vc_row]
[/_s2If]
[_s2If current_user_can(access_s2member_ccap_us10yr)]
[vc_row][vc_column][vc_separator border_width=”5″][/vc_column][/vc_row][vc_row][vc_column][vc_column_text]
US 10 yr Treasuries.
[/vc_column_text][/vc_column][/vc_row][vc_row][vc_column][vc_separator border_width=”5″][/vc_column][/vc_row][vc_row][vc_column width=”2/3″][vc_custom_heading text=”1 hr” use_theme_fonts=”yes”][vc_column_text]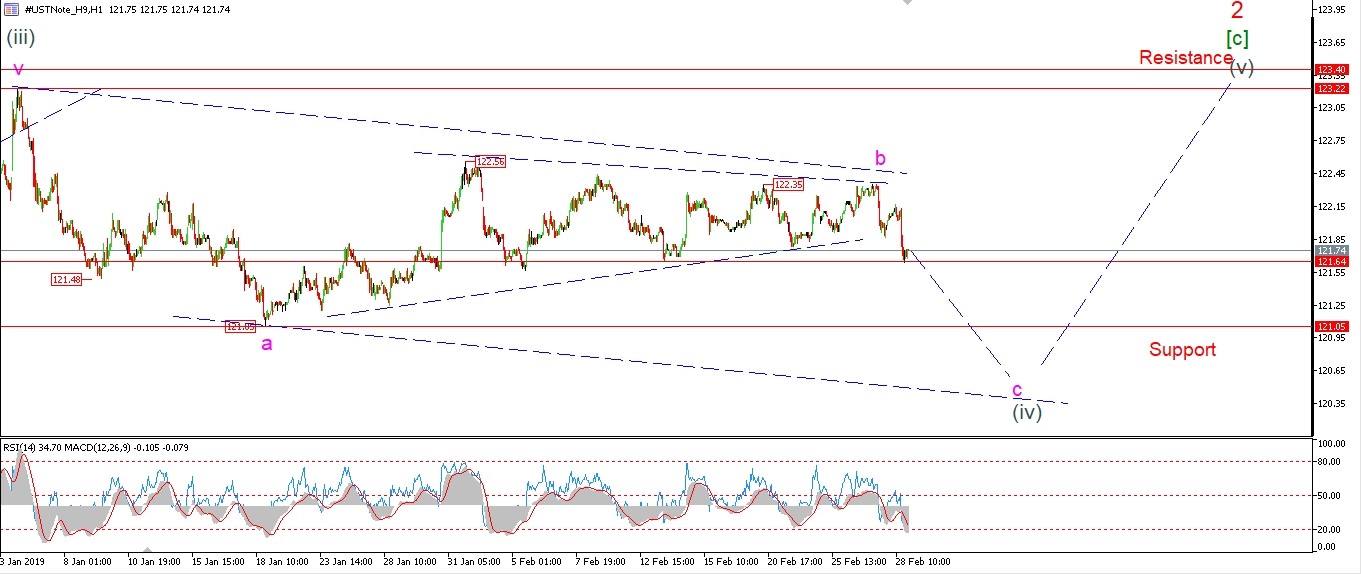 [/vc_column_text][/vc_column][vc_column width=”1/3″][vc_custom_heading text=”4 Hours” use_theme_fonts=”yes”][vc_column_text]
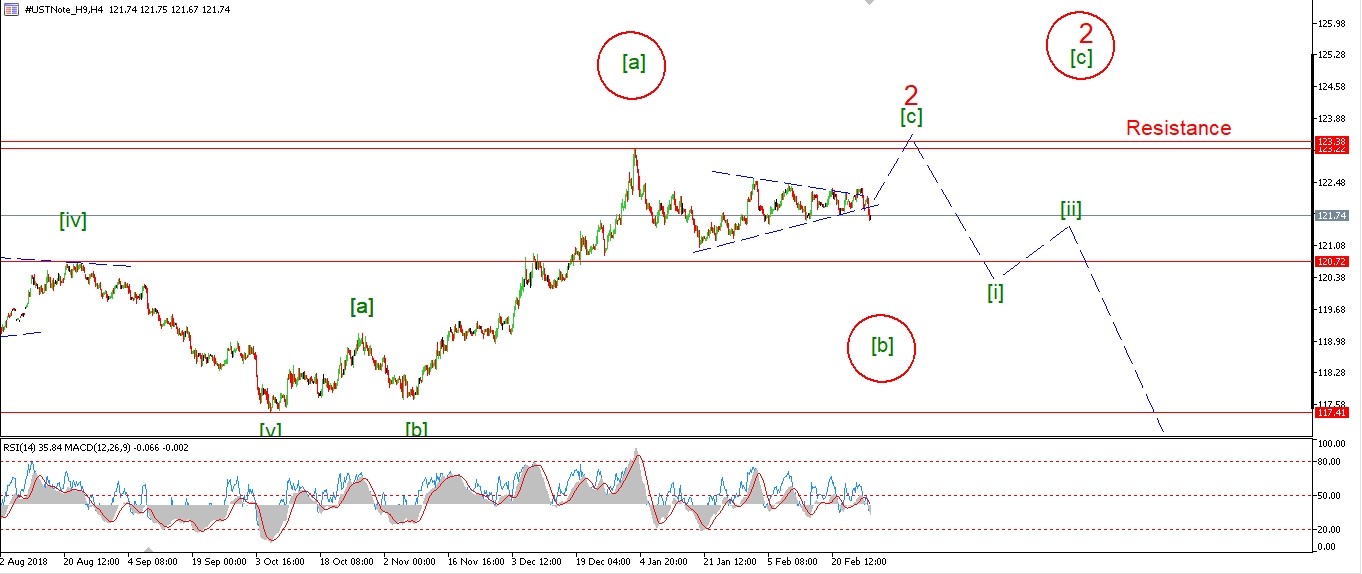 [/vc_column_text][vc_custom_heading text=”Daily” use_theme_fonts=”yes”][vc_column_text]
 [/vc_column_text][/vc_column][/vc_row]
[vc_row][vc_column][vc_column_text]
My charts have failed to update this evening,
thank you Admiral mkts!
so I will have to wait until Monday to update the count.
The 10YR did continue lower today in a possible wave ‘c’ of (iv) as shown,
Or, wave (c) of [b] as per the alternate count.
So It is likely that next week we will see wave ‘c’ continue towards that lower trend channel line at 120.00.
Monday;
122.35 should hold as wave ‘c’ develops.
[/vc_column_text][/vc_column][/vc_row]
[/_s2If]
[_s2If current_user_can(access_s2member_ccap_silver)]
[vc_row][vc_column][vc_separator border_width=”5″][/vc_column][/vc_row][vc_row][vc_column][vc_column_text]
SILVER
[/vc_column_text][/vc_column][/vc_row][vc_row][vc_column][vc_separator border_width=”5″][/vc_column][/vc_row][vc_row][vc_column width=”2/3″][vc_custom_heading text=”1 hr” use_theme_fonts=”yes”][vc_column_text]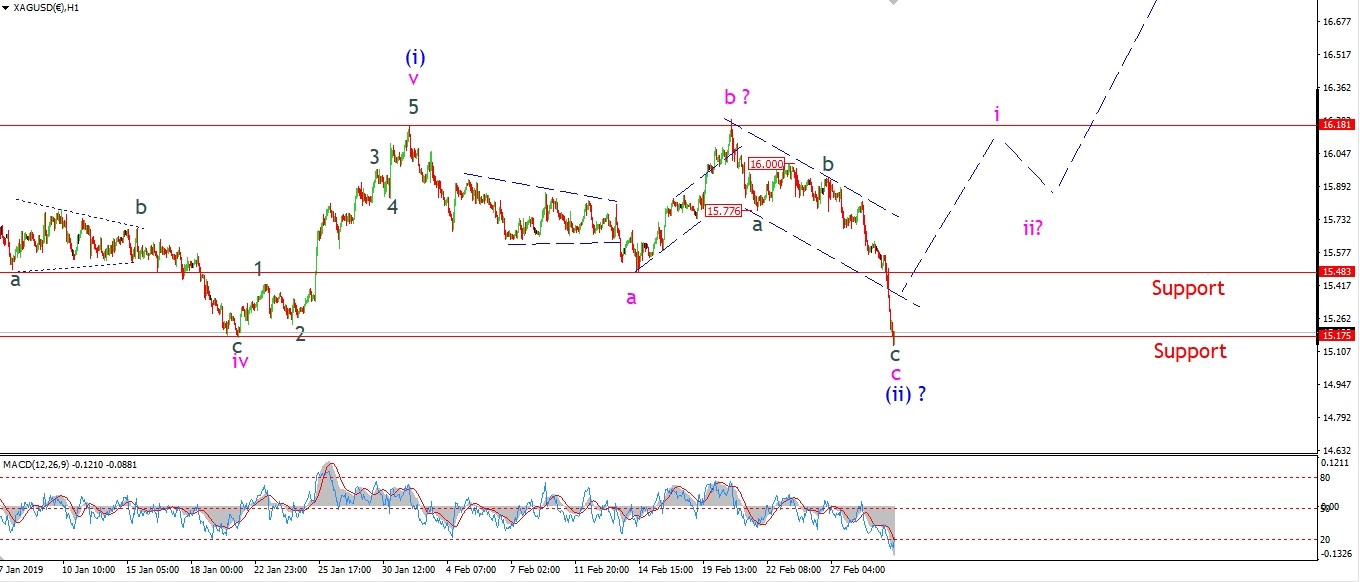 [/vc_column_text][/vc_column][vc_column width=”1/3″][vc_custom_heading text=”4 Hours” use_theme_fonts=”yes”][vc_column_text]
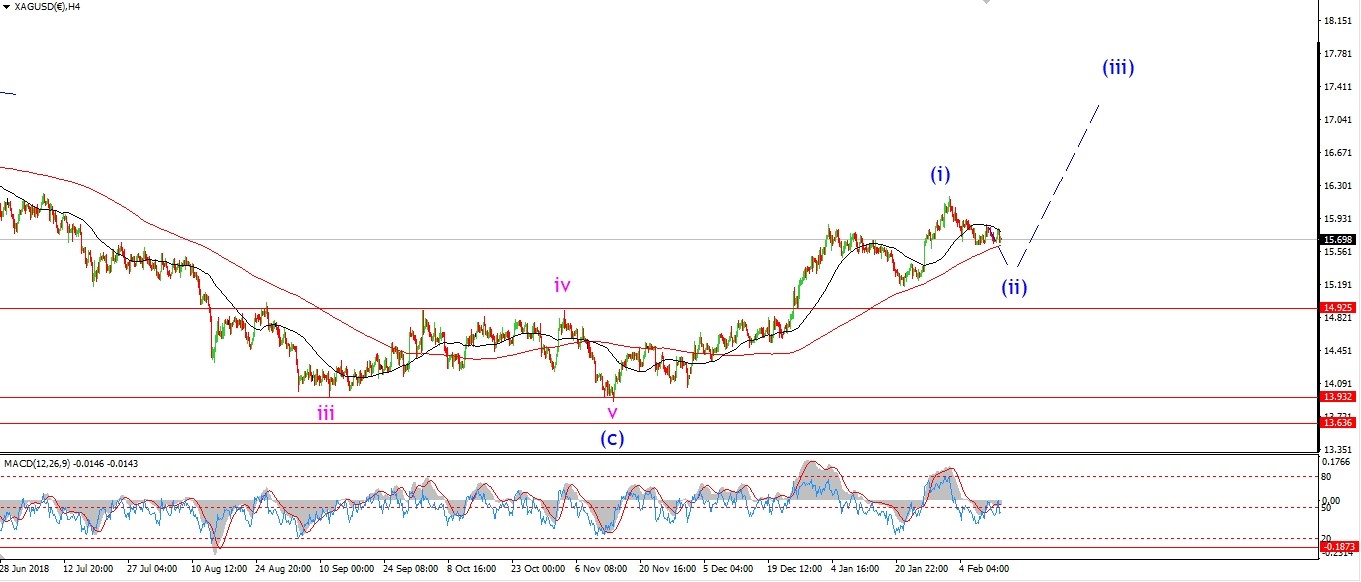 [/vc_column_text][vc_custom_heading text=”Daily” use_theme_fonts=”yes”][vc_column_text]
 [/vc_column_text][/vc_column][/vc_row]
[vc_row][vc_column][vc_column_text]
Silvers decline today triggered the alternate count for wave (ii).
The price has sold off sharply and broke support at 15.48.
And now we are ending the session at the lower support level of 15.17.
This level market the previous fourth wave and should offer support for wave (ii).
Next week;
Wave (ii) has now completed an expanded flat.
So next week we should expect this correction to end and begin another five wave move higher in wave ‘i’ of (iii).
Watch for a push back above 15.50 to signal wave ‘i’ of (iii) has begun.
[/vc_column_text][/vc_column][/vc_row]
[/_s2If]
[_s2If current_user_can(access_s2member_ccap_sp500)]
[vc_row][vc_column][vc_separator border_width=”5″][/vc_column][/vc_row][vc_row][vc_column][vc_column_text]
S&P 500.
[/vc_column_text][/vc_column][/vc_row][vc_row][vc_column][vc_separator border_width=”5″][/vc_column][/vc_row][vc_row][vc_column width=”2/3″][vc_custom_heading text=”1 hr” use_theme_fonts=”yes”][vc_column_text]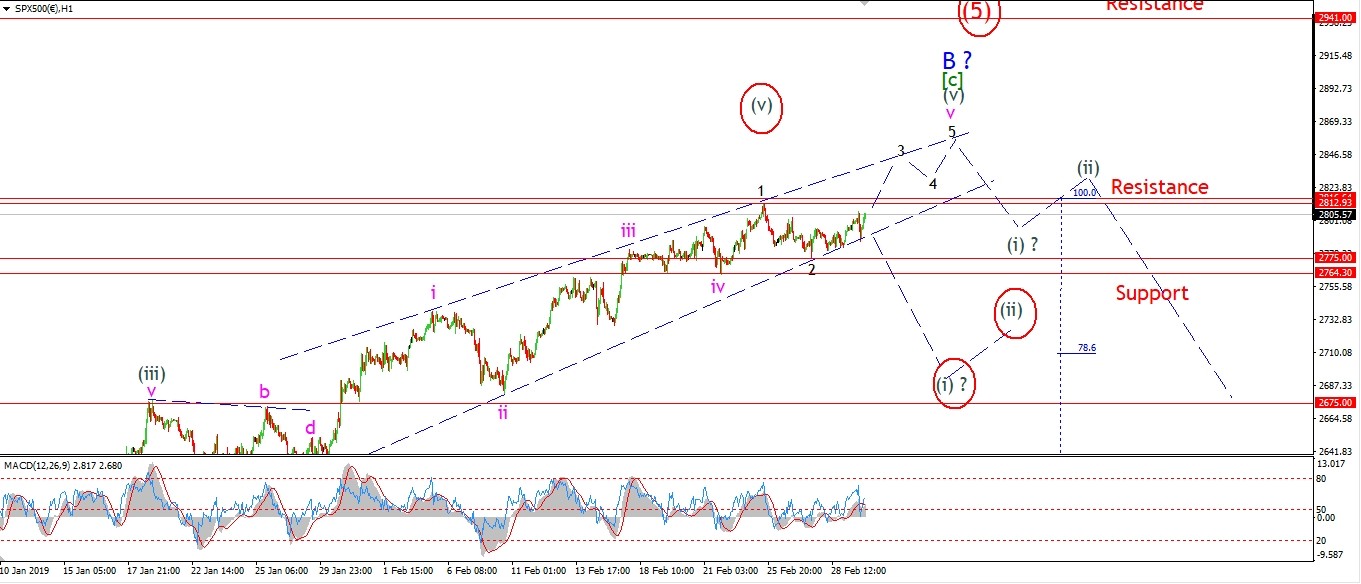 [/vc_column_text][/vc_column][vc_column width=”1/3″][vc_custom_heading text=”4 Hours” use_theme_fonts=”yes”][vc_column_text]
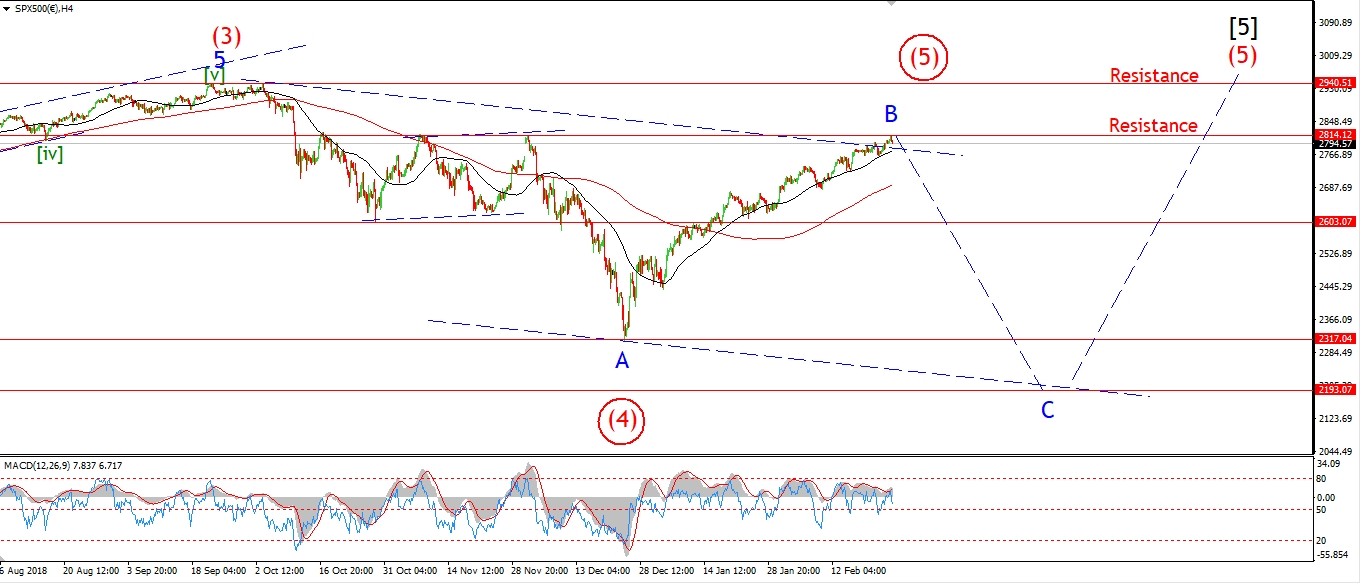 [/vc_column_text][vc_custom_heading text=”Daily” use_theme_fonts=”yes”][vc_column_text]
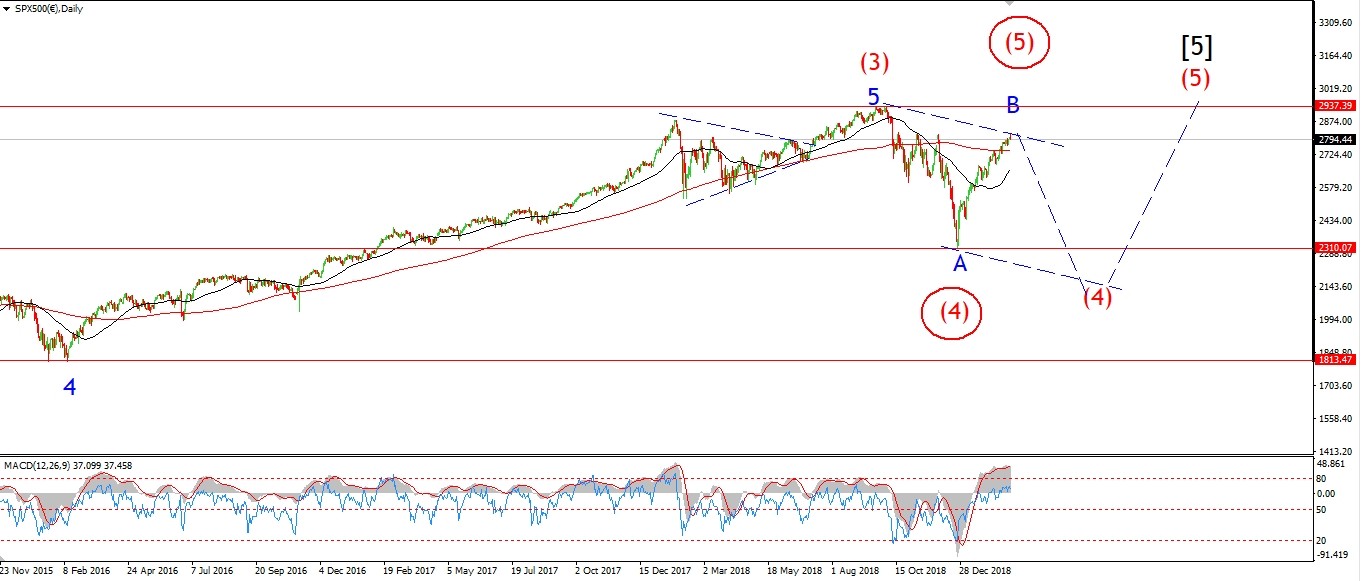 [/vc_column_text][/vc_column][/vc_row]
[vc_row][vc_column][vc_column_text]
The S&P is still hanging below that resistance at 2816 this evening.
If wave ‘3’ of ‘v’ is going to take over on Monday,
we should break that level with ease and head higher to about 2850.
The price is rallying to the close,
so wave ‘3’ could be underway now.
A break of the recent high at 2813 will confirm wave ‘3’ of ‘v’.
In the grand scheme of things,
we are still charting a topping sequence in either wave ‘B’, or wave (5).
And I think it’s a clean 50/50 between those two interpretations at this point.
This is simply the final leg up in both patterns.
And the downside risk for both counts is significant.
With the current wave count now expecting at least a drop into 2100 to complete wave ‘C’ of (4).
Monday;
Watch for a break of 2813 to confirm wave ‘3’ of ‘v’ with a target of about 2850.
[/vc_column_text][/vc_column][/vc_row]
[/_s2If]
[vc_row][vc_column][vc_column_text]
Until next week,
au revoir, bon chance et que Dieu vous bénisse!
[/vc_column_text][/vc_column][/vc_row]
[vc_row][vc_column][vc_separator border_width=”5″][/vc_column][/vc_row]