
[vc_row][vc_column][vc_separator border_width=”5″][/vc_column][/vc_row]
[vc_row][vc_column][vc_column_text]
Hi everyone, I hope your well.
[/vc_column_text][/vc_column][/vc_row]
[_s2If current_user_can(access_s2member_ccap_eurusd)]
[vc_row][vc_column][vc_separator border_width=”5″][/vc_column][/vc_row]
[vc_row][vc_column][vc_column_text]
EURUSD
[/vc_column_text][/vc_column][/vc_row]
[vc_row][vc_column][vc_separator border_width=”5″][/vc_column][/vc_row][vc_row][vc_column width=”2/3″][vc_custom_heading text=”1 hr” use_theme_fonts=”yes”][vc_column_text]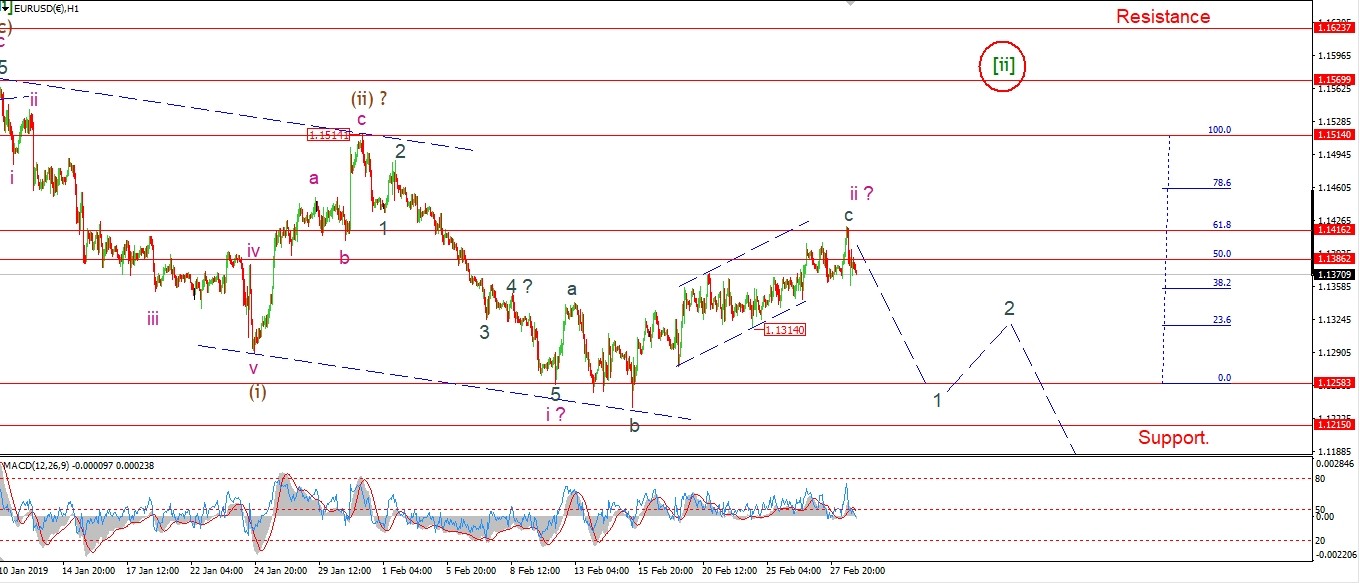 [/vc_column_text][/vc_column][vc_column width=”1/3″][vc_custom_heading text=”4 Hours” use_theme_fonts=”yes”][vc_column_text]
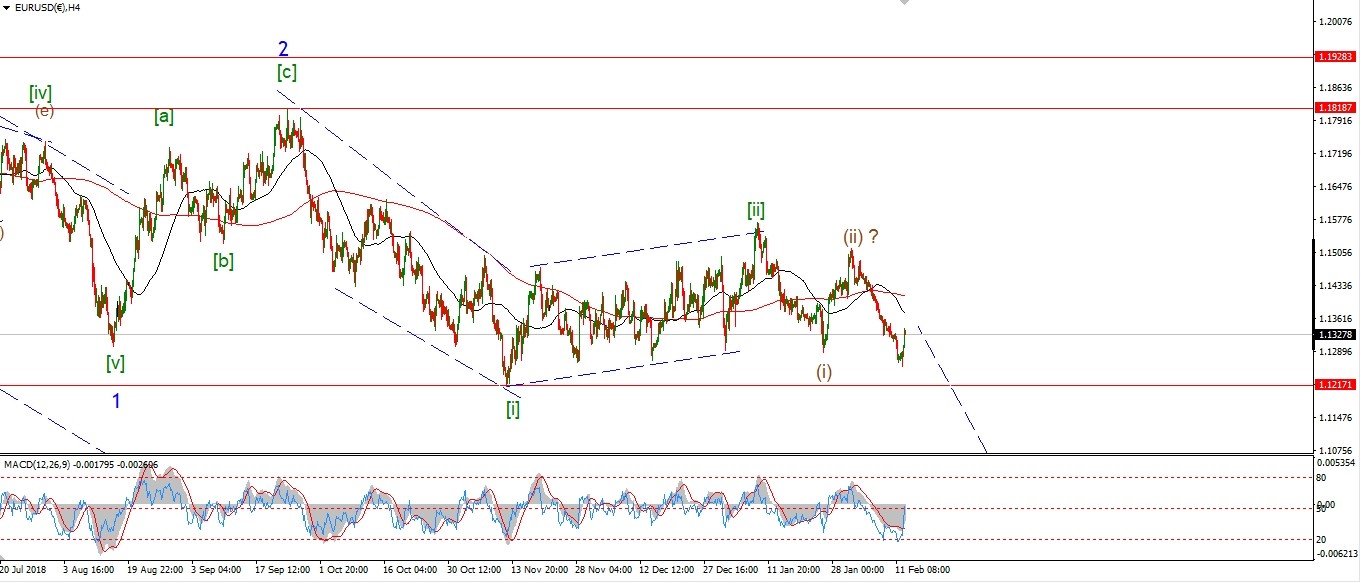 [/vc_column_text][vc_custom_heading text=”Daily” use_theme_fonts=”yes”][vc_column_text]
 [/vc_column_text][/vc_column][/vc_row]
[vc_row][vc_column][vc_column_text]
EURUSD has been drifting sideways in a corrective pattern since last October.
It’s about time we broke out of it.
I think we are close to that point now.
The price hit the 62% retracement level today and immediately dropped sharply.
It is not five waves down just yet,
but it’s a start!
If the impulsive nature of this fall continues tomorrow,
and we see a break of 1.1300 that will definitely favor the beginning of wave ‘1’ of ‘iii’.
Tomorrow;
Watch for todays high to hold and a break of 1.1340 to signal the start of ‘iii’ down.
[/vc_column_text][/vc_column][/vc_row]
[/_s2If]
[_s2If current_user_can(access_s2member_ccap_gbpusd)]
[vc_row][vc_column][vc_separator border_width=”5″][/vc_column][/vc_row][vc_row][vc_column][vc_column_text]
GBPUSD
[/vc_column_text][/vc_column][/vc_row][vc_row][vc_column][vc_separator border_width=”5″][/vc_column][/vc_row][vc_row][vc_column width=”2/3″][vc_custom_heading text=”1 hr” use_theme_fonts=”yes”][vc_column_text]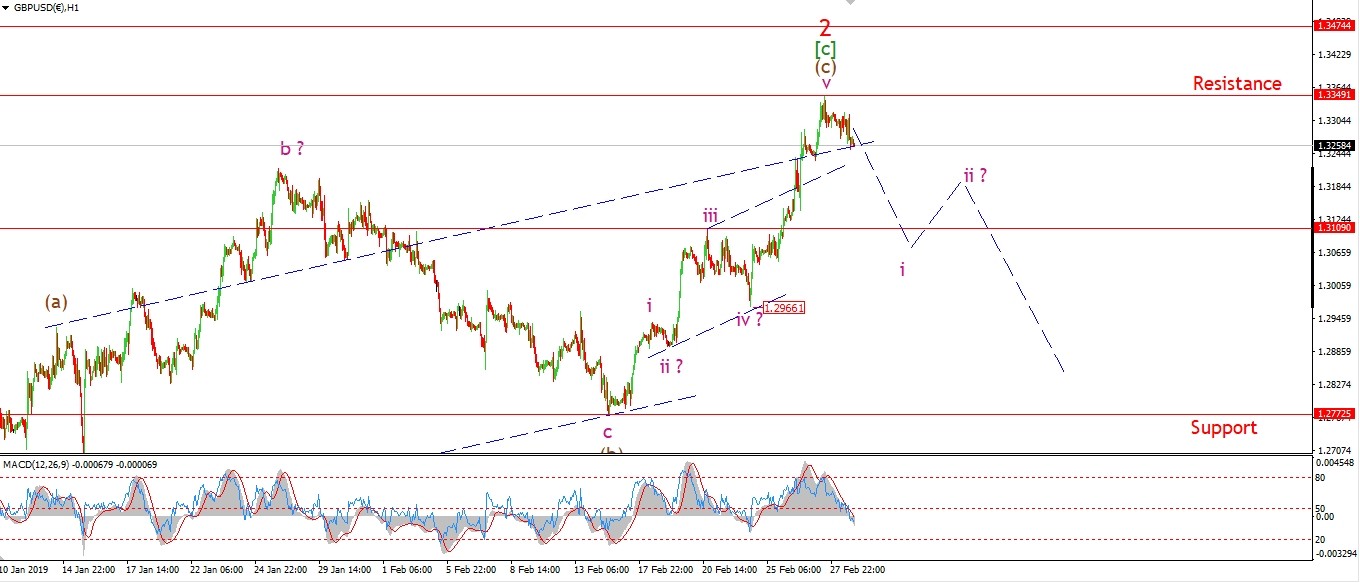 [/vc_column_text][/vc_column][vc_column width=”1/3″][vc_custom_heading text=”4 Hours” use_theme_fonts=”yes”][vc_column_text]
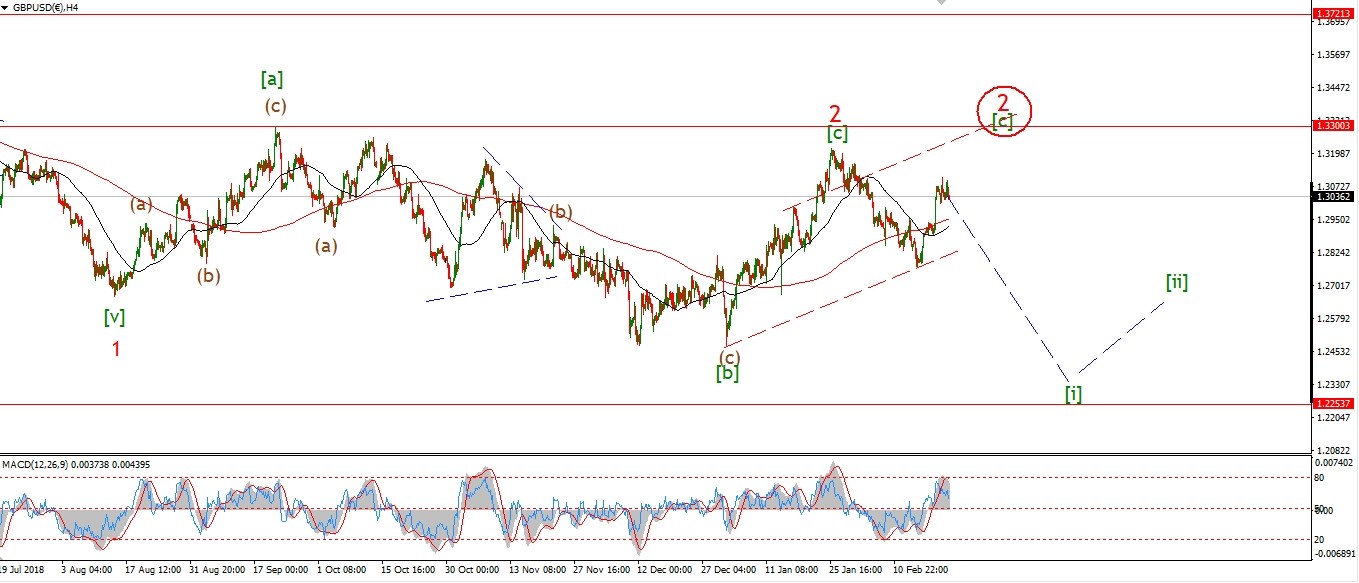 [/vc_column_text][vc_custom_heading text=”Daily” use_theme_fonts=”yes”][vc_column_text]
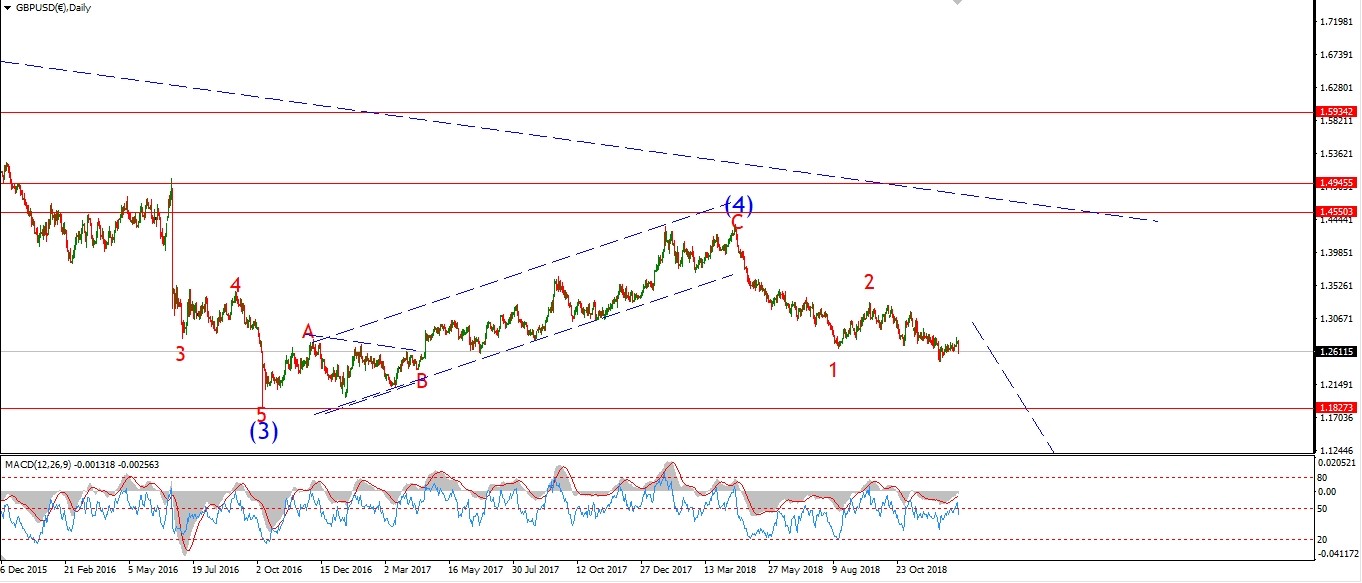 [/vc_column_text][/vc_column][/vc_row]
[vc_row][vc_column][vc_column_text]
Cable is slowly dropping off the wave ‘2’ high again.
but we have not dropped impulsively yet.
The market is definitely sporting signs of an overbought extreme on the 4hr chart.
So a turn is near.
If the price drops off impulsively from here and breaks below the wave ‘iii’ high at 1.3109,
That will signal that wave ‘i’ of (iii) has begun.
Tomorrow;
Watch for the decline to continue and develop into wave ‘i’ down.
The best opportunity to enter short will come
when a clear impulse wave completes as shown in waves ‘i’ and ‘ii’.
[/vc_column_text][/vc_column][/vc_row]
[/_s2If]
[_s2If current_user_can(access_s2member_ccap_usdjpy)]
[vc_row][vc_column][vc_separator border_width=”5″][/vc_column][/vc_row][vc_row][vc_column][vc_column_text]
USDJPY
[/vc_column_text][/vc_column][/vc_row][vc_row][vc_column][vc_separator border_width=”5″][/vc_column][/vc_row][vc_row][vc_column width=”2/3″][vc_custom_heading text=”1 hr” use_theme_fonts=”yes”][vc_column_text]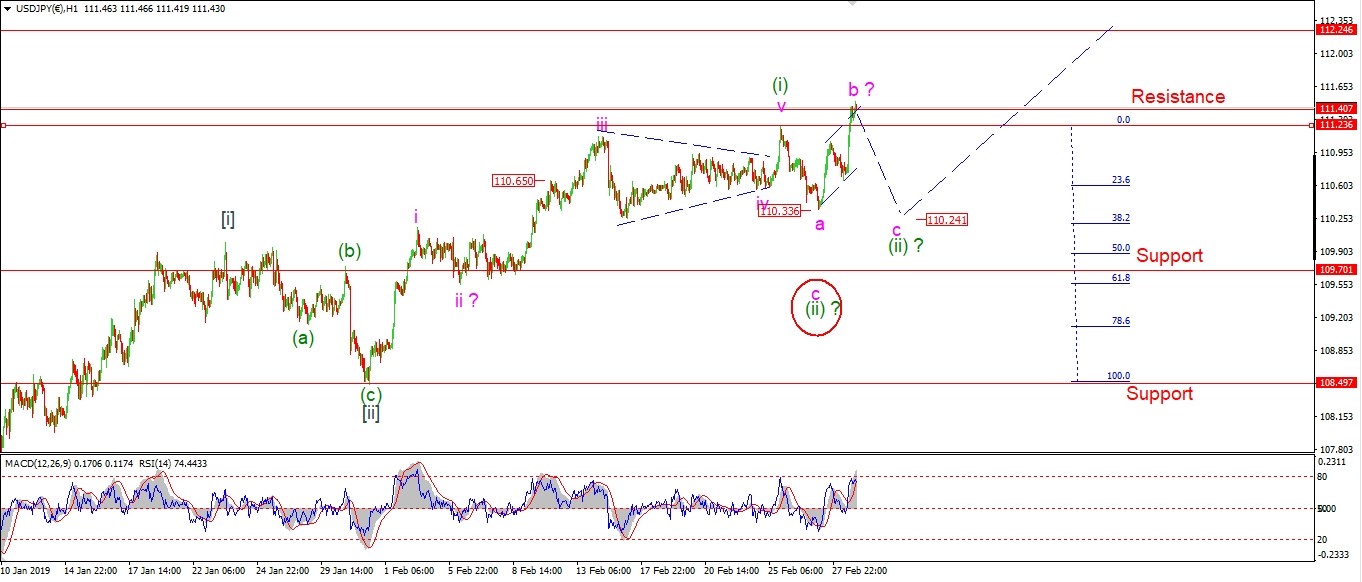 [/vc_column_text][/vc_column][vc_column width=”1/3″][vc_custom_heading text=”4 Hours” use_theme_fonts=”yes”][vc_column_text]
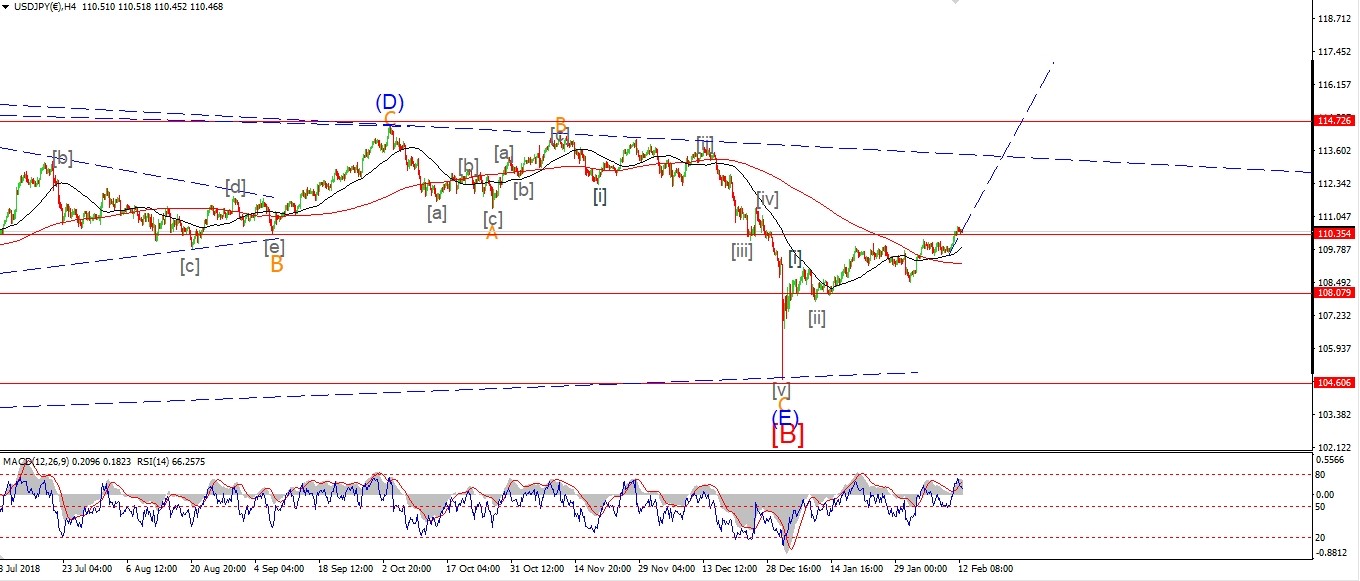 [/vc_column_text][vc_custom_heading text=”Daily” use_theme_fonts=”yes”][vc_column_text]
 [/vc_column_text][/vc_column][/vc_row]
[vc_row][vc_column][vc_column_text]
USDJPY has rallied again today but I still think this is a ‘b’ wave rally.
The rise off wave ‘a’ is in three waves and filled a trend channel this evening.
The pattern is now an expanded flat,
So wave ‘c’ should drop to below the wave ‘a’ low at 110.33.
Tomorrow;
Watch for wave ‘c’ to finally begin off the highs this evening.
The minimum target for wave ‘c’ lies at 110.33.
[/vc_column_text][/vc_column][/vc_row]
[/_s2If]
[_s2If current_user_can(access_s2member_ccap_dow_jones)]
[vc_row][vc_column][vc_separator border_width=”5″][/vc_column][/vc_row][vc_row][vc_column][vc_column_text]
DOW JONES INDUSTRIALS
[/vc_column_text][/vc_column][/vc_row][vc_row][vc_column][vc_separator border_width=”5″][/vc_column][/vc_row][vc_row][vc_column width=”2/3″][vc_custom_heading text=”1 hr” use_theme_fonts=”yes”][vc_column_text]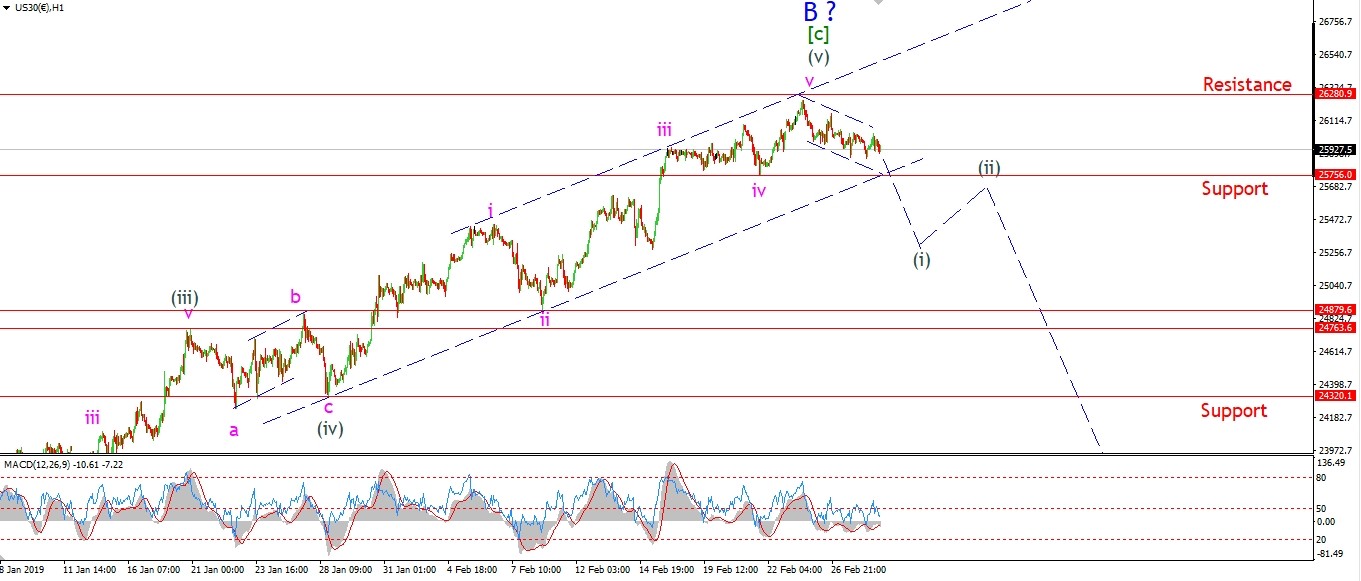 [/vc_column_text][/vc_column][vc_column width=”1/3″][vc_custom_heading text=”4 Hours” use_theme_fonts=”yes”][vc_column_text]
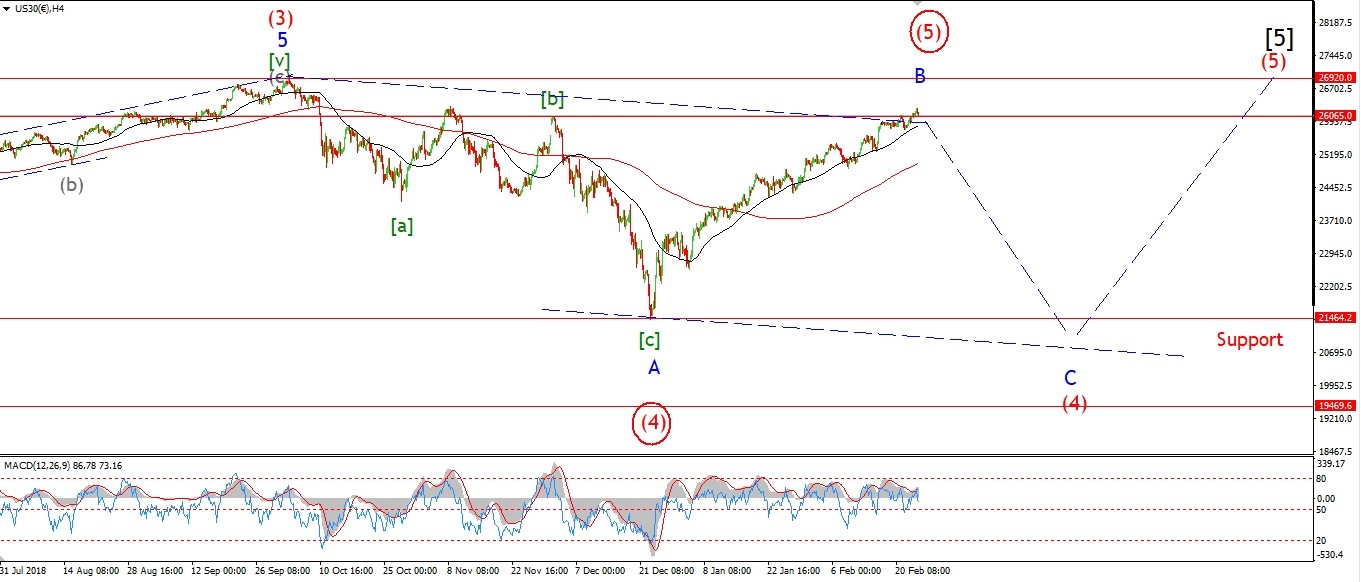 [/vc_column_text][vc_custom_heading text=”Daily” use_theme_fonts=”yes”][vc_column_text]
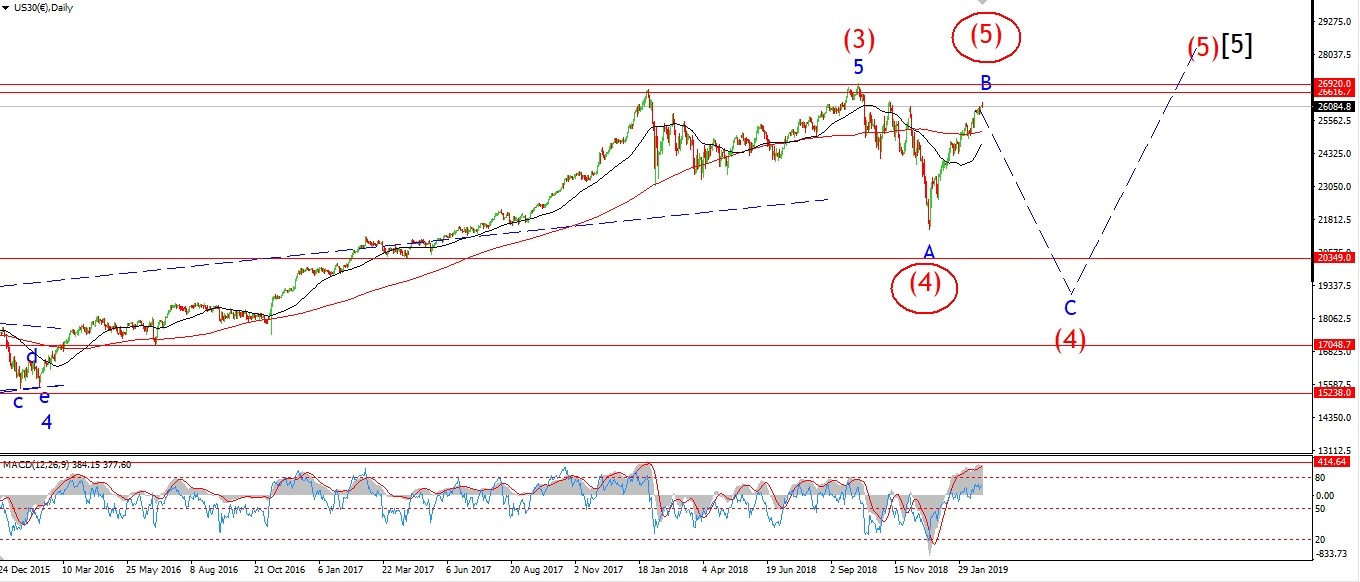 [/vc_column_text][/vc_column][/vc_row]
[vc_row][vc_column][vc_column_text]
The indecision remains.
Is this wave ‘B’ high complete,
or are we going to break out and trigger the alternate count.
The DOW continues to drift sideways within a trend channel off the highs.
Initial support lies at 25756,
If this level holds tomorrow and we see a turn higher again,
That will be a sign that wave (v) grey is about to extend.
And we will take another step towards the alternate count
Which shows this entire rally as wave (5) of [5].
Tomorrow;
An impulsive break below 25750 will favor the idea that wave ‘B’ is now complete.
And wave (i) down should then push towards 25000 again.
[/vc_column_text][/vc_column][/vc_row]
[/_s2If]
[_s2If current_user_can(access_s2member_ccap_gold)]
[vc_row][vc_column][vc_separator border_width=”5″][/vc_column][/vc_row][vc_row][vc_column][vc_column_text]
GOLD
[/vc_column_text][/vc_column][/vc_row][vc_row][vc_column][vc_separator border_width=”5″][/vc_column][/vc_row][vc_row][vc_column width=”2/3″][vc_custom_heading text=”1 hr” use_theme_fonts=”yes”][vc_column_text]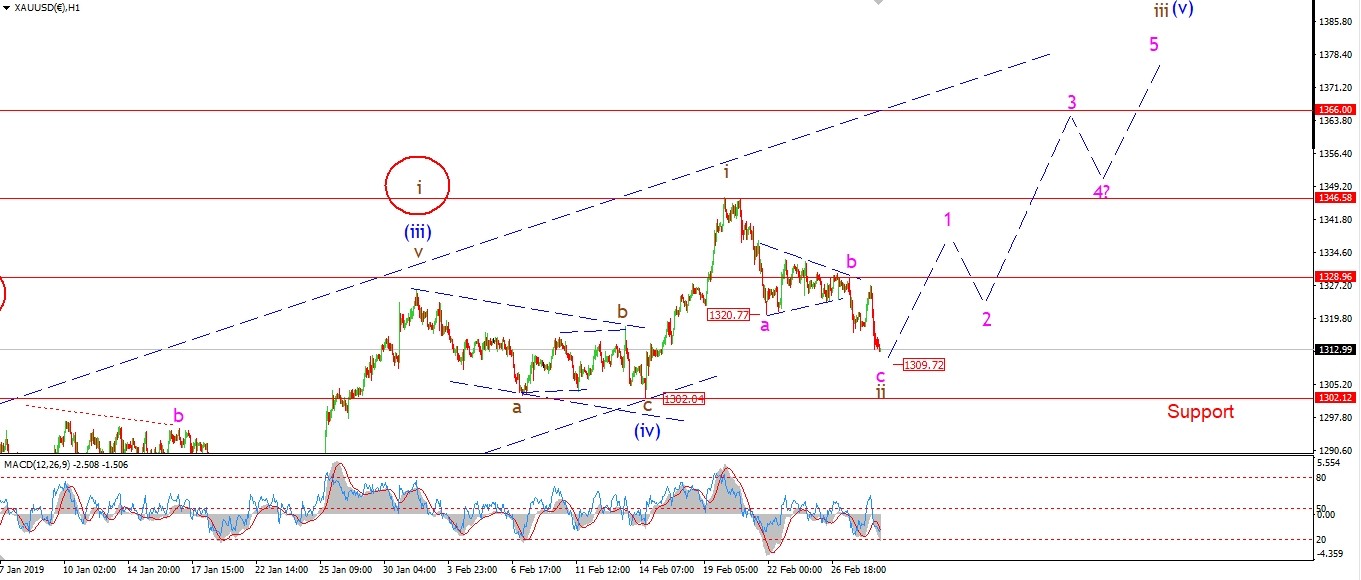 [/vc_column_text][/vc_column][vc_column width=”1/3″][vc_custom_heading text=”4 Hours” use_theme_fonts=”yes”][vc_column_text]
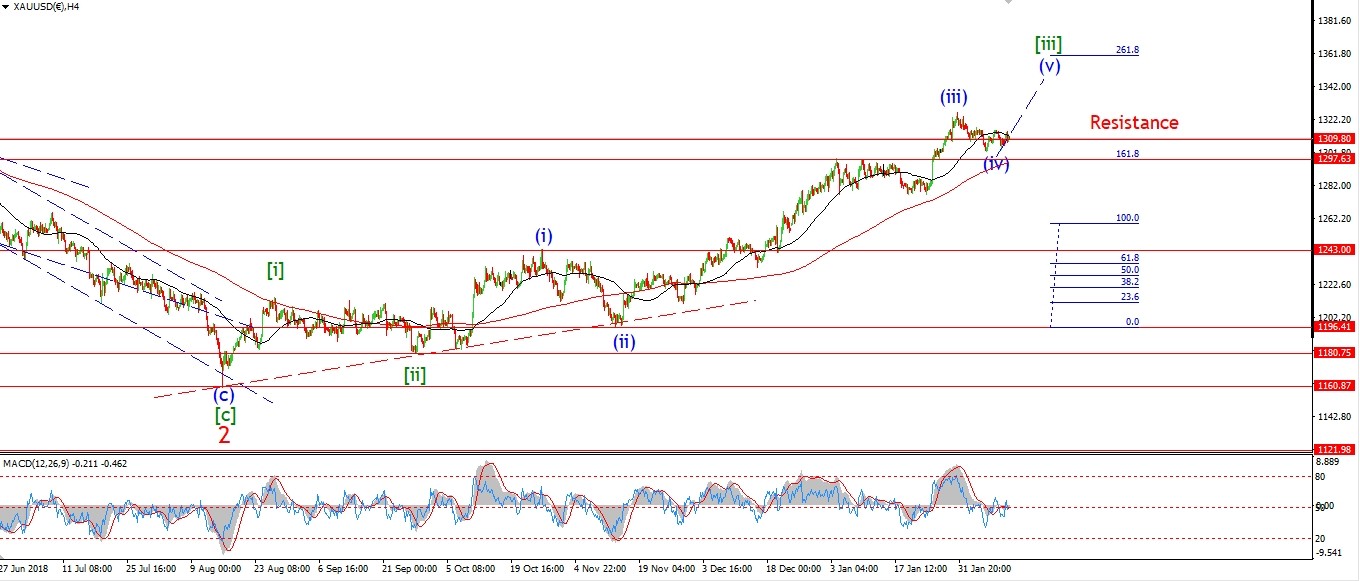 [/vc_column_text][vc_custom_heading text=”Daily” use_theme_fonts=”yes”][vc_column_text]
 [/vc_column_text][/vc_column][/vc_row]
[vc_row][vc_column][vc_column_text]
GOLD is creating a three wave structure in wave ‘c’ of ‘ii’.
This action creates a complex combination for wave ‘ii’.
But we are nearing the end of that correction now.
Wave ‘ii’ must complete above 1302
and begin a push higher in wave ‘iii’ of (v) tomorrow.
A rise above 1330 again will signal that wave ‘iii’ has begun.
And a break of 1346 will confirm wave ‘iii’.
but we should get a small impulse wave to create a higher low above wave ‘ii’ first.
Tomorrow;
Watch for wave ‘c’ to complete above 1302 and possibly the beginning of wave ‘iii’ up to appear.
[/vc_column_text][/vc_column][/vc_row]
[/_s2If]
[_s2If current_user_can(access_s2member_ccap_crude)]
[vc_row][vc_column][vc_separator border_width=”5″][/vc_column][/vc_row][vc_row][vc_column][vc_column_text]
U.S CRUDE OIL
[/vc_column_text][/vc_column][/vc_row][vc_row][vc_column][vc_separator border_width=”5″][/vc_column][/vc_row][vc_row][vc_column width=”2/3″][vc_custom_heading text=”1 hr” use_theme_fonts=”yes”][vc_column_text]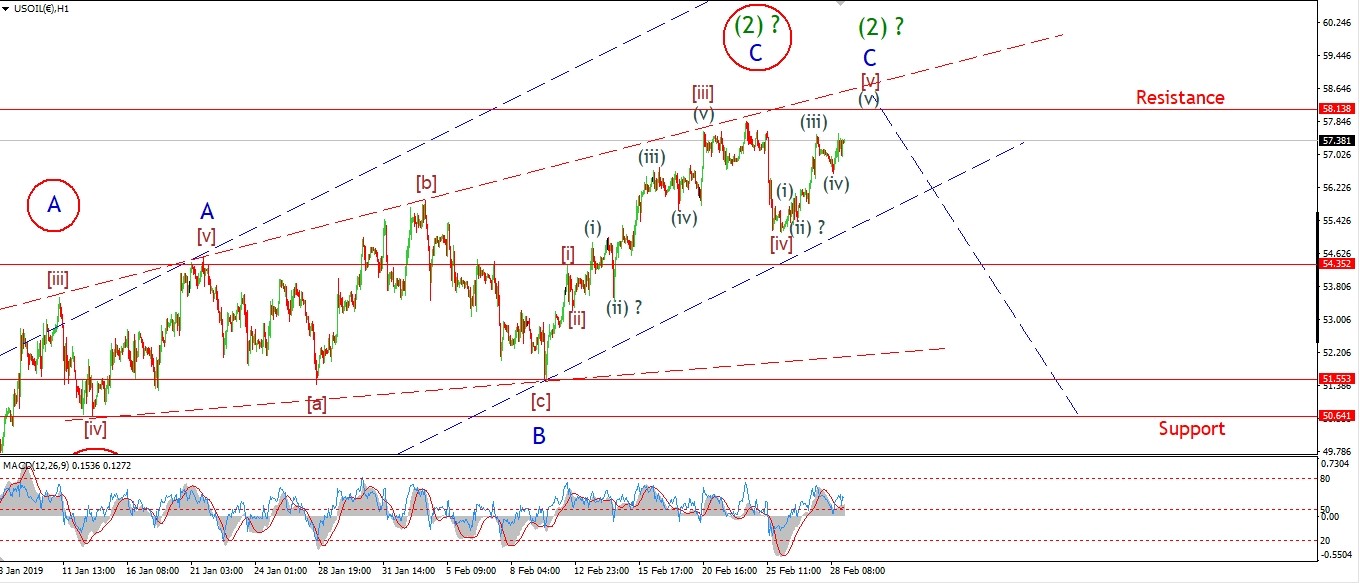 [/vc_column_text][/vc_column][vc_column width=”1/3″][vc_custom_heading text=”4 Hours” use_theme_fonts=”yes”][vc_column_text]
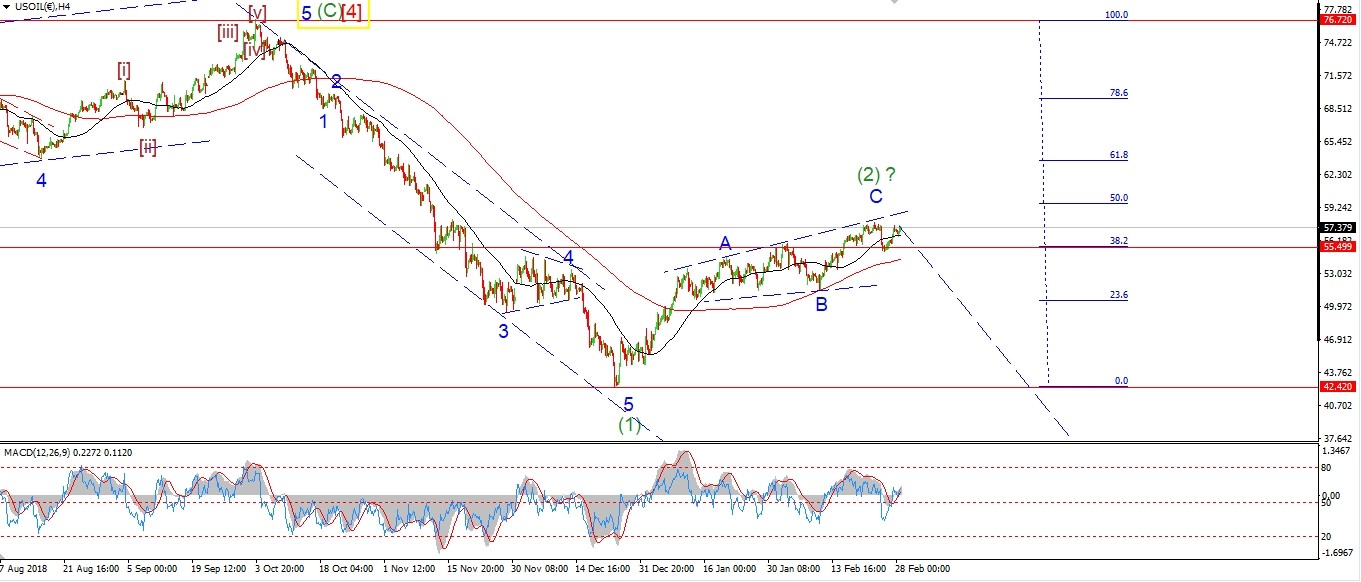 [/vc_column_text][vc_custom_heading text=”Daily” use_theme_fonts=”yes”][vc_column_text]
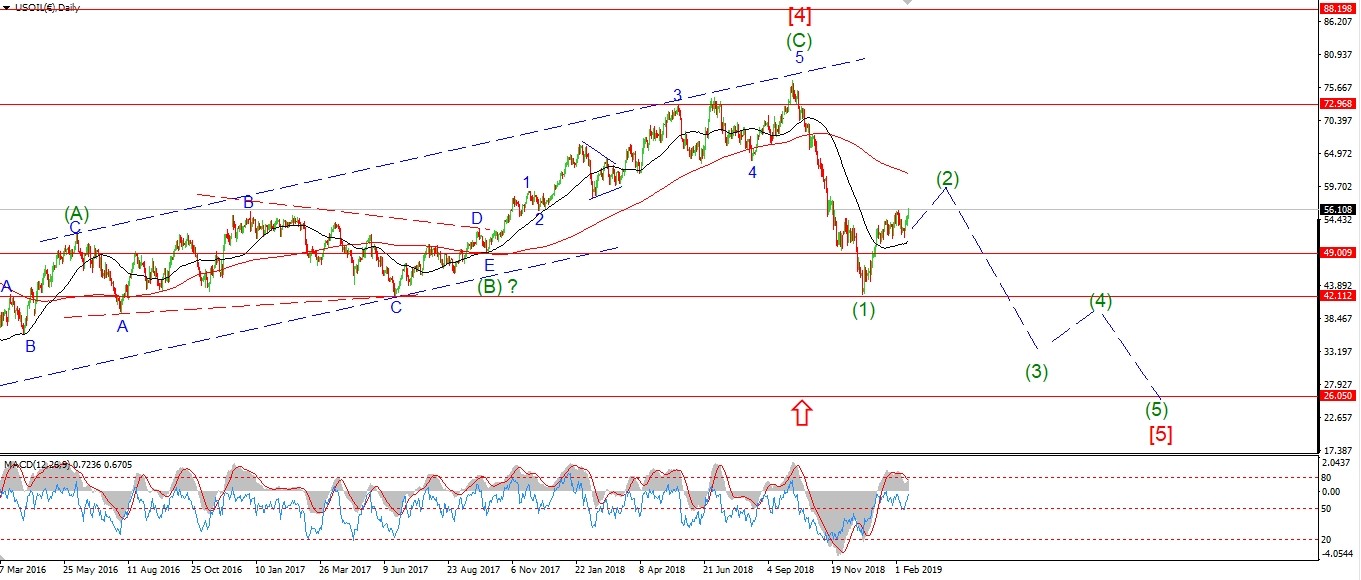 [/vc_column_text][/vc_column][/vc_row]
[vc_row][vc_column][vc_column_text]
The rally in Crude is weakening severely in terms of momentum throughout this week.
The 4hr chart shows a serious bearish divergence only getting worse.
Another push towards 58.00 again will complete five waves in wave ‘C’
and that should be followed by an impulsive turn lower to begin wave ‘1’ of (3) over the coming weeks.
Wave [v] is nearing the completion of a five wave internal structure itself.
It is a bit messy off the wave [iv] low,
but wave (iii) has a clear internal structure.
Wave (iv) is a three wave drop so far,
but it may develop into a larger flat 3,3,5 pattern.
So that leaves wave (v) of [v] left to finish off this rally.
Tomorrow;
Watch for wave (iv) to close out and wave (v) to rally above 58.00 again to complete wave ‘C’.
[/vc_column_text][/vc_column][/vc_row]
[/_s2If]
[_s2If current_user_can(access_s2member_ccap_us10yr)]
[vc_row][vc_column][vc_separator border_width=”5″][/vc_column][/vc_row][vc_row][vc_column][vc_column_text]
US 10 yr Treasuries.
[/vc_column_text][/vc_column][/vc_row][vc_row][vc_column][vc_separator border_width=”5″][/vc_column][/vc_row][vc_row][vc_column width=”2/3″][vc_custom_heading text=”1 hr” use_theme_fonts=”yes”][vc_column_text]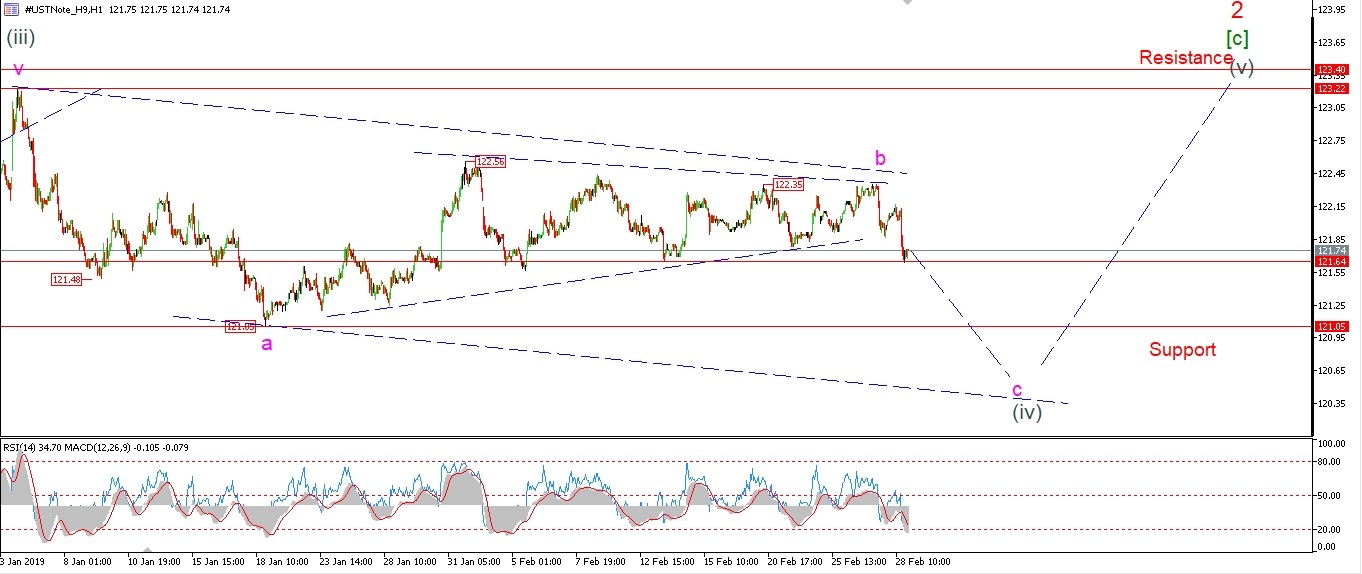 [/vc_column_text][/vc_column][vc_column width=”1/3″][vc_custom_heading text=”4 Hours” use_theme_fonts=”yes”][vc_column_text]
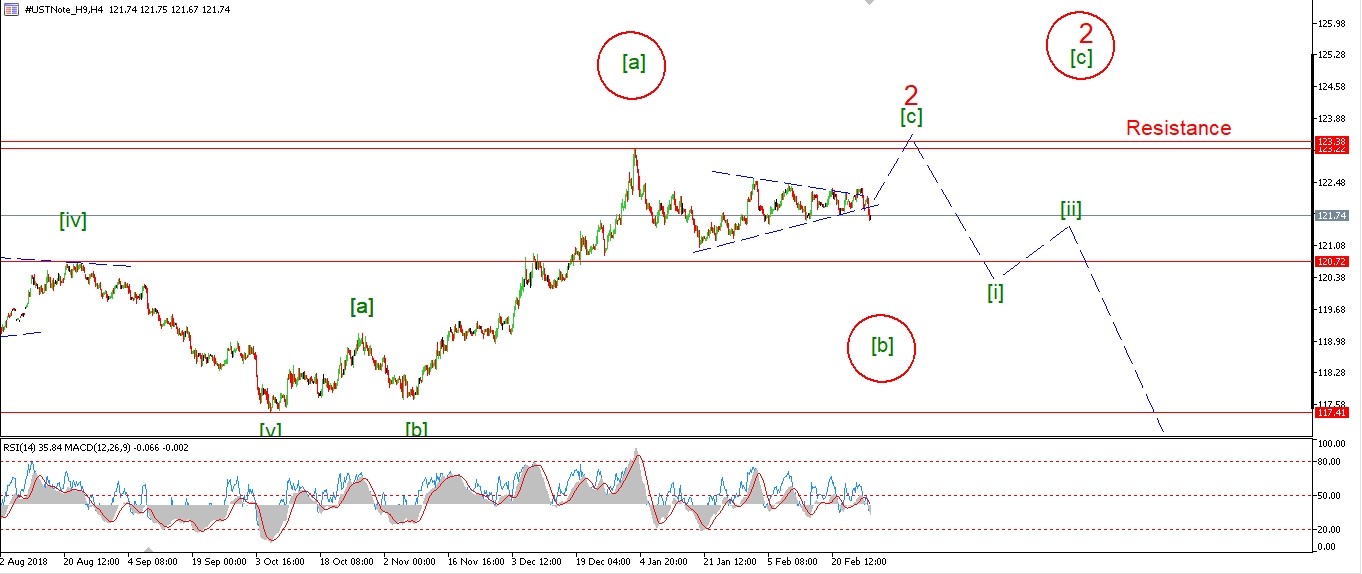 [/vc_column_text][vc_custom_heading text=”Daily” use_theme_fonts=”yes”][vc_column_text]
 [/vc_column_text][/vc_column][/vc_row]
[vc_row][vc_column][vc_column_text]
A break of the previous lows at 121.78 has forced a rethink of the wave count this evening.
The triangle pattern which has contracted the price over the last while is now viewed as wave ‘b’ of a larger wave (iv)
as shown on the chart.
The price should continue to move lower now in wave ‘c’ of (iv)
with a minimum target at 121.05.
The alternate count is shown on the 4hr chart.
this shows the possibility of a larger wave ‘2’ in three waves.
In that case the correction would form wave [b].
Tomorrow;
Watch for the price to continue to fall in wave ‘c’ and confirm this new count.
[/vc_column_text][/vc_column][/vc_row]
[/_s2If]
[_s2If current_user_can(access_s2member_ccap_silver)]
[vc_row][vc_column][vc_separator border_width=”5″][/vc_column][/vc_row][vc_row][vc_column][vc_column_text]
SILVER
[/vc_column_text][/vc_column][/vc_row][vc_row][vc_column][vc_separator border_width=”5″][/vc_column][/vc_row][vc_row][vc_column width=”2/3″][vc_custom_heading text=”1 hr” use_theme_fonts=”yes”][vc_column_text]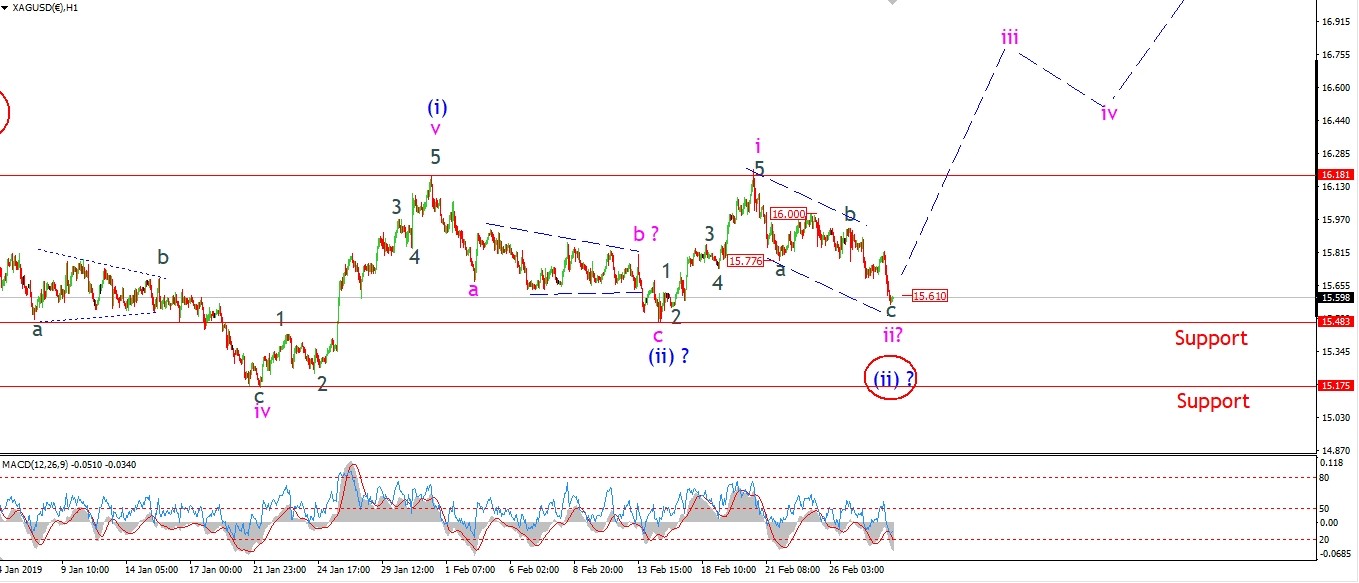 [/vc_column_text][/vc_column][vc_column width=”1/3″][vc_custom_heading text=”4 Hours” use_theme_fonts=”yes”][vc_column_text]
 [/vc_column_text][vc_custom_heading text=”Daily” use_theme_fonts=”yes”][vc_column_text]
 [/vc_column_text][/vc_column][/vc_row]
[vc_row][vc_column][vc_column_text]
Silver should now complete wave ‘ii’ at this evenings lows.
We are quite close to the invalidation line at 15.48,
so price must hold above that level tomorrow
in order to save this particular wave count.
A break of that level will signal that wave (ii) is creating a larger structure.
And in that case we can expect wave (ii) to find support again at 15.17.
Tomorrow;
Watch for 15.48 to hold and wave ‘iii’ up to turn higher again.
[/vc_column_text][/vc_column][/vc_row]
[/_s2If]
[_s2If current_user_can(access_s2member_ccap_sp500)]
[vc_row][vc_column][vc_separator border_width=”5″][/vc_column][/vc_row][vc_row][vc_column][vc_column_text]
S&P 500.
[/vc_column_text][/vc_column][/vc_row][vc_row][vc_column][vc_separator border_width=”5″][/vc_column][/vc_row][vc_row][vc_column width=”2/3″][vc_custom_heading text=”1 hr” use_theme_fonts=”yes”][vc_column_text]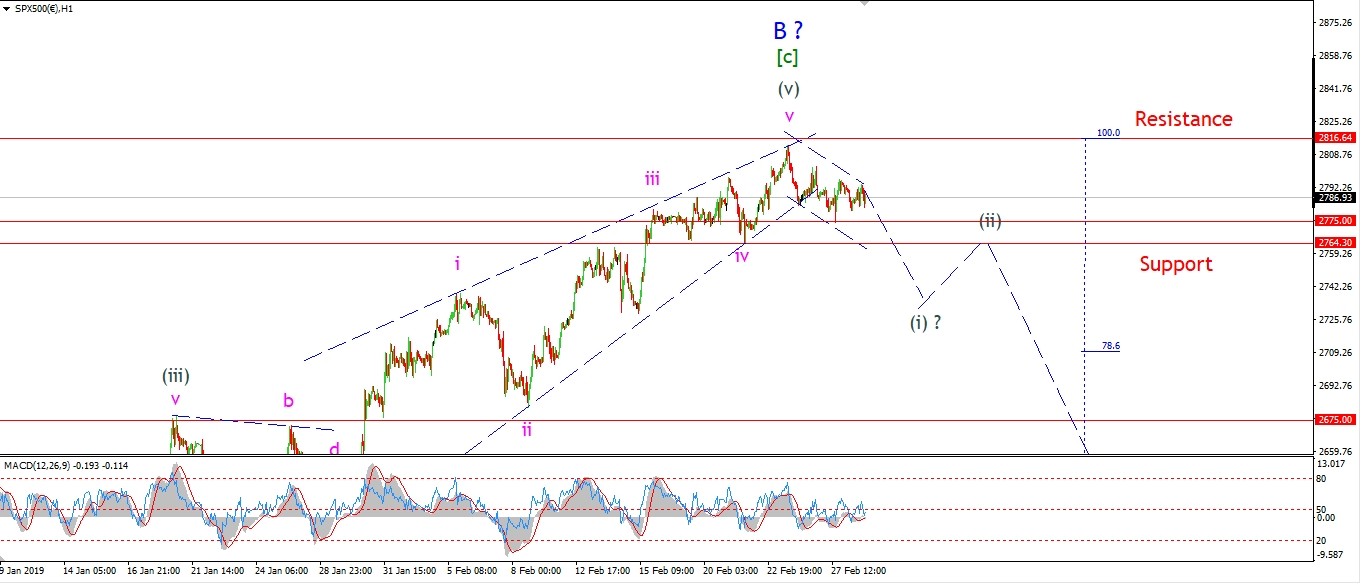 [/vc_column_text][/vc_column][vc_column width=”1/3″][vc_custom_heading text=”4 Hours” use_theme_fonts=”yes”][vc_column_text]
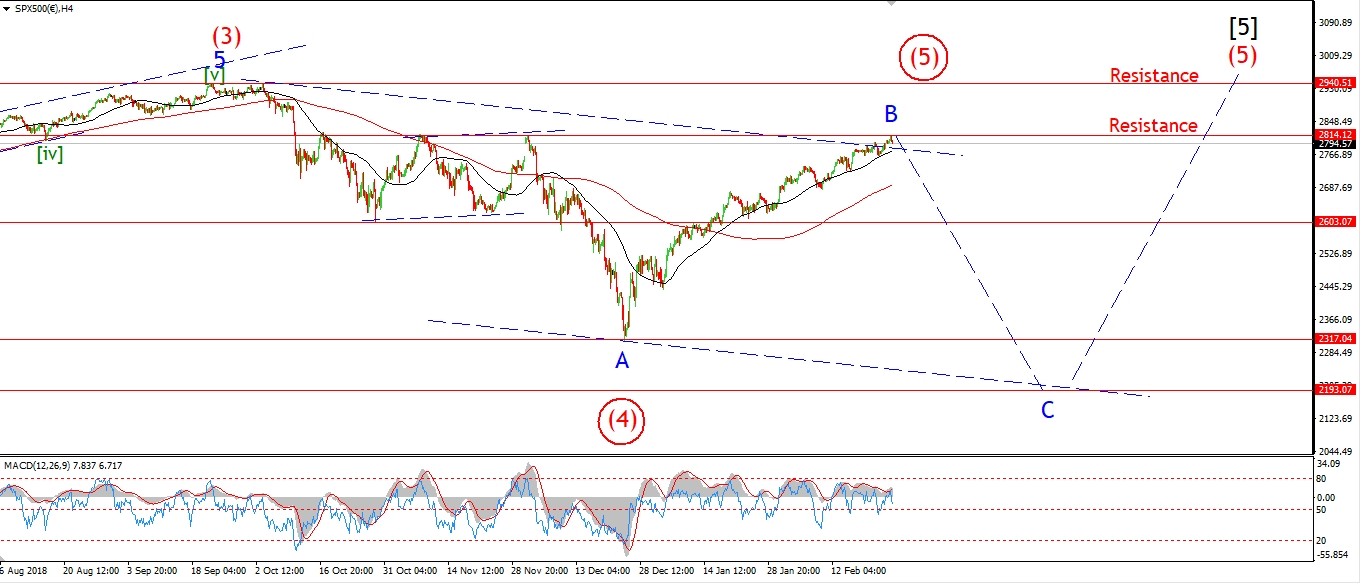 [/vc_column_text][vc_custom_heading text=”Daily” use_theme_fonts=”yes”][vc_column_text]
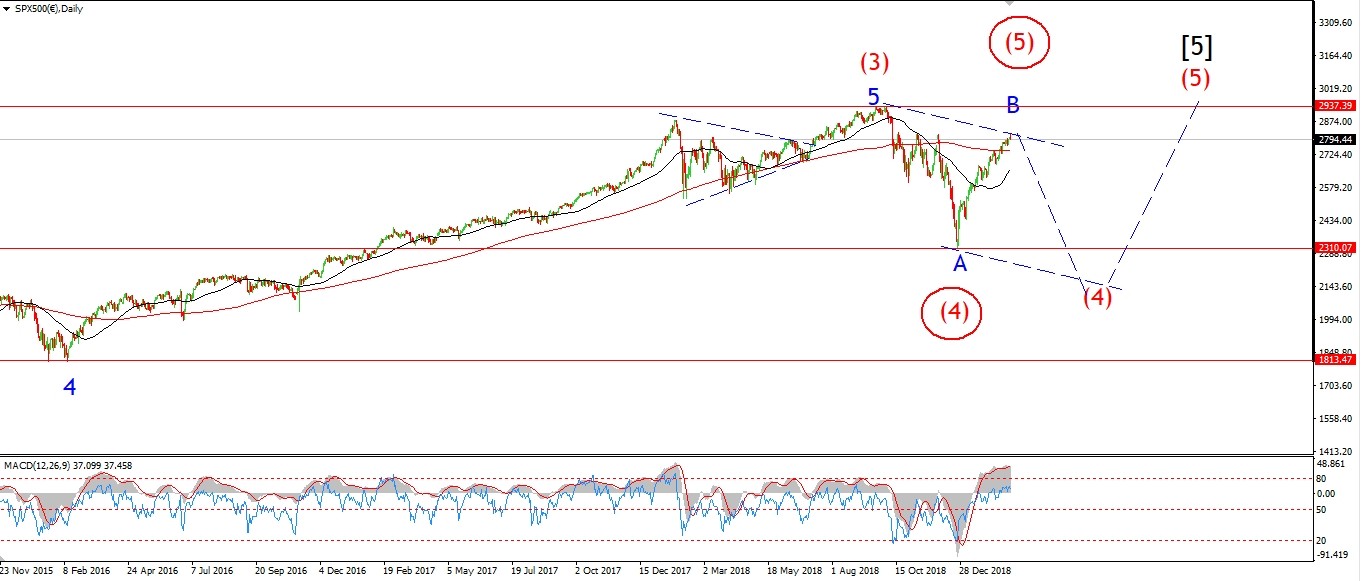 [/vc_column_text][/vc_column][/vc_row]
[vc_row][vc_column][vc_column_text]
The S&P has dropped in three waves off the high within a trend channel,
and today we seem to have bounced higher and corrected again to a higher low.
The odds are now shifting in favor of the idea of an extended wave ‘v’ to complete wave ‘B’.
or,
the alternate idea
of wave ‘5’ of (5) of [5] now heading to new all time highs again.
A break of 2940 will confirm that alternate count,
so we are a good distance from that point yet.
Tomorrow;
A break of 2775 tomorrow will favor the decline in wave (i) grey.
A break of 2764 will likely rule out the possibility of an extension in wave ‘v’.
For the moment,
We are still stuck in limbo here!
lets see if tomorrow clears up the short term patterns.
[/vc_column_text][/vc_column][/vc_row]
[/_s2If]
[vc_row][vc_column][vc_column_text]
[/vc_column_text][/vc_column][/vc_row]
[vc_row][vc_column][vc_separator border_width=”5″][/vc_column][/vc_row]