
Good evening to one and all.
I hope the weekend treated you well,
the market woke up with a massive hangover this morning!
This could be a very big week ahead in terms of the long term patterns in the stock market.
So lets get into the action to see what is unfolding.
EURUSD.
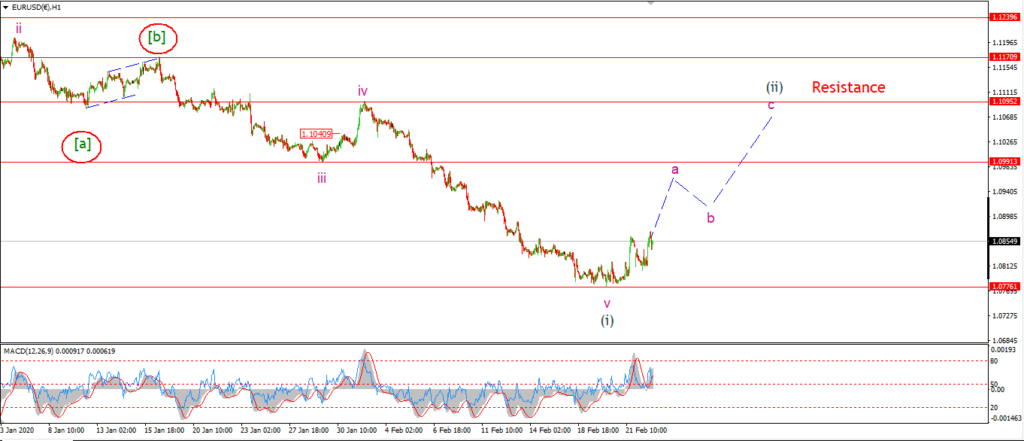
EURUSD 1hr.
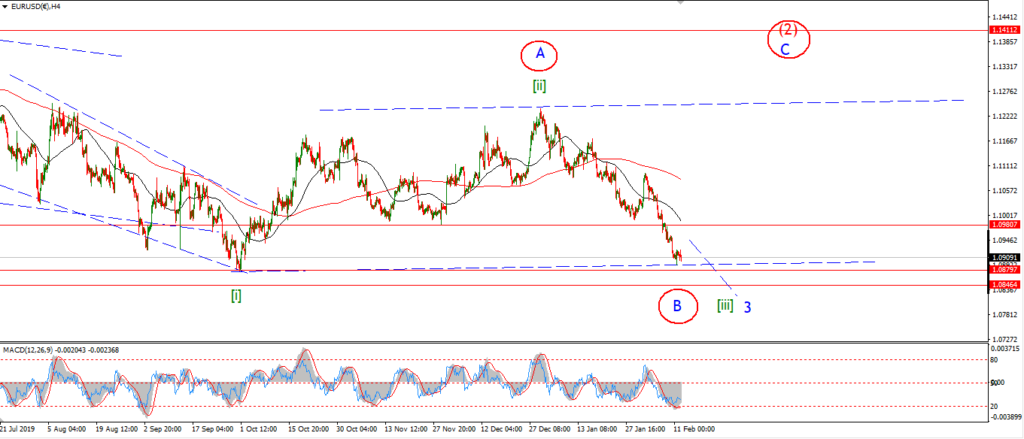
EURUSD 4hr.

EURUSD daily.
It’s a real struggle to get higher in EURUSD these days.
The pattern off the lows at wave (i) are building in a corrective manner so far.
I am looking for more upside in wave (ii) to come though.
This initial move higher may be part of wave ‘a’ of (ii),
but I would like to see wave ‘a’ break above 1.0950 or so
before correcting again in wave ‘b’ later in the week.
Tomorrow;
If wave (ii) is a flat correction,
then we will see a three wave rise in wave ‘a’ of (ii).
watch for wave ‘a’ to hold above 1.0776 and continue higher.
GBPUSD
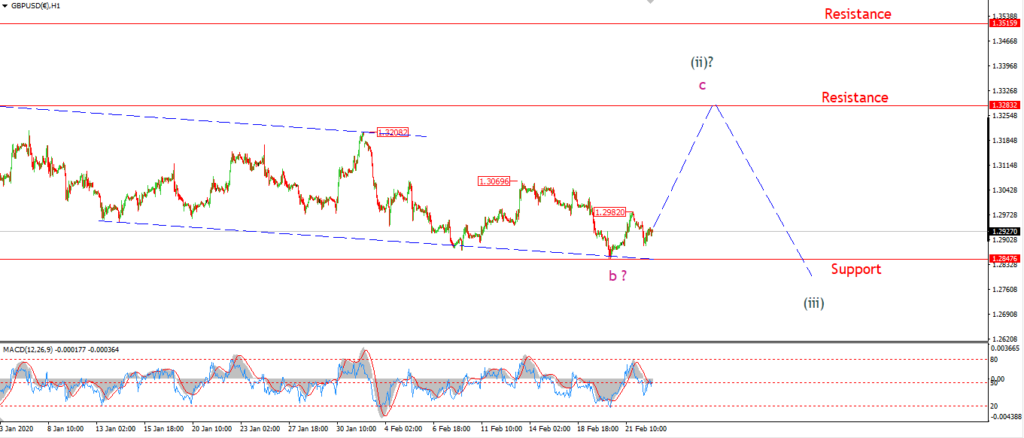
GBPUSD 1hr.
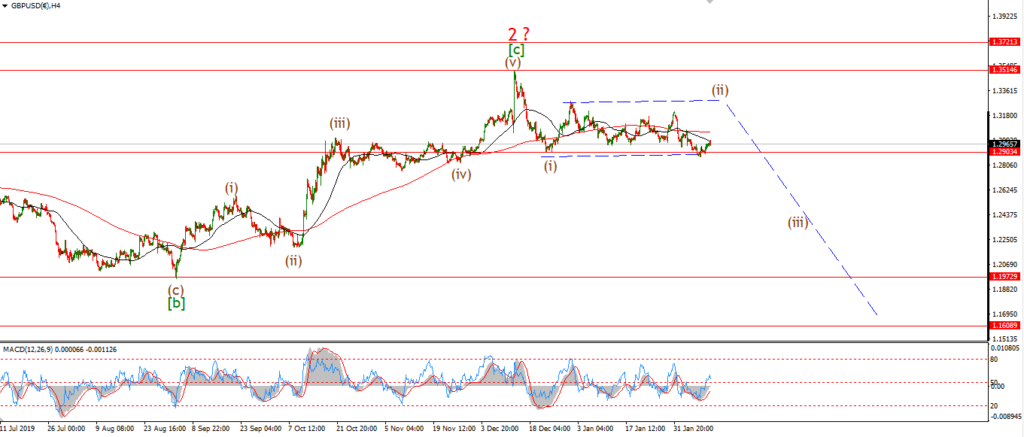
GBPUSD 4hr.
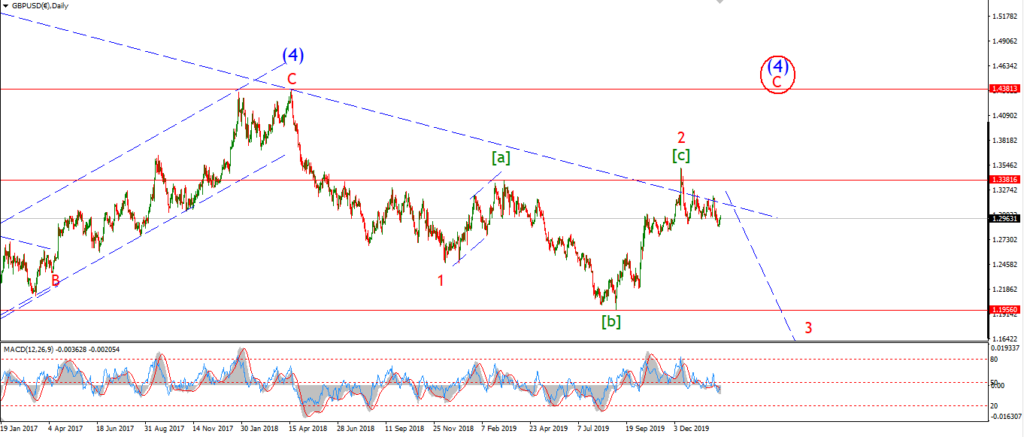
GBPUSD daily.
The low at wave ‘b’ is holding for now at 1.2847.
The price fell off Fridays highs early in the session,
but that decline traced out three waves.
And the price is now sitting at a small higher low above 1.2847 this evening.
This action has the hallmarks of a turn higher into wave ‘c’ of (ii) now.
So wee need to see some follow through tomorrow.
Tomorrow;
watch for wave ‘c’ to continue higher.
A break above 1.2982 again will signal wave ‘c’ has begun.
A break above 1.3069 should confirm wave ‘c’
and then setup for a run up to the resistance at 1.3283.
USDJPY.
USDJPY 1hr.
USDJPY 1hr.
USDJPY daily.
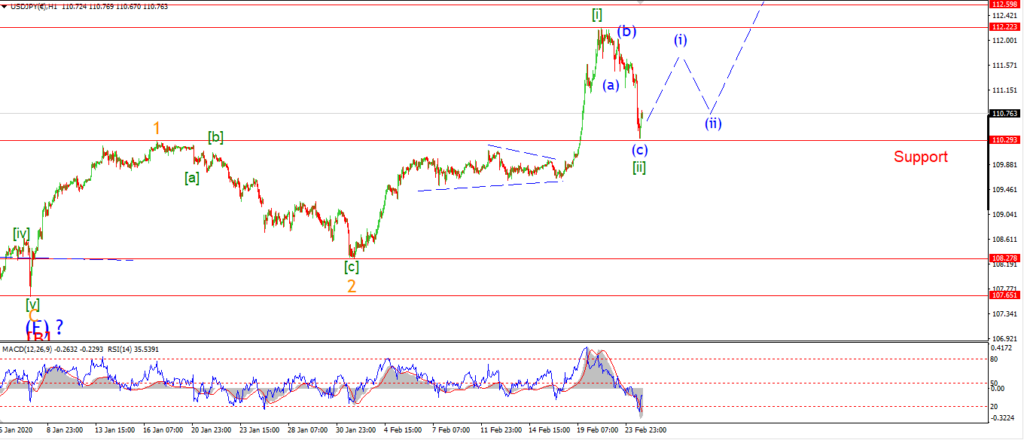
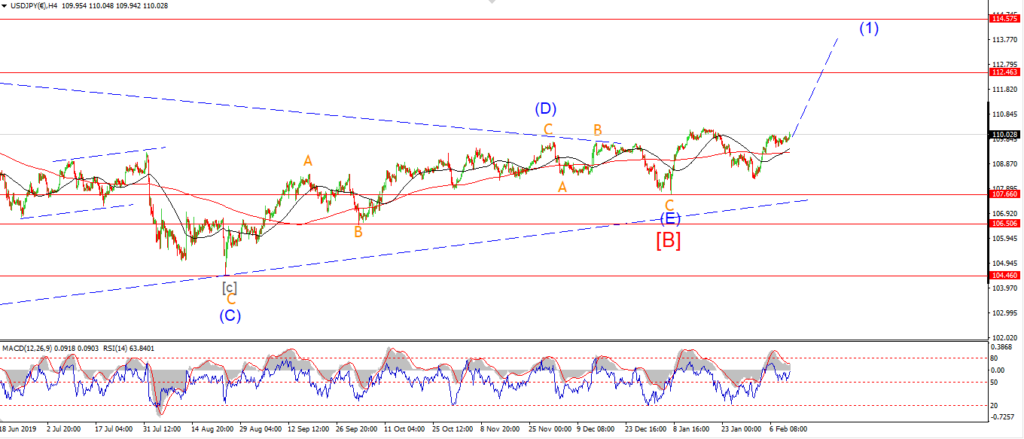
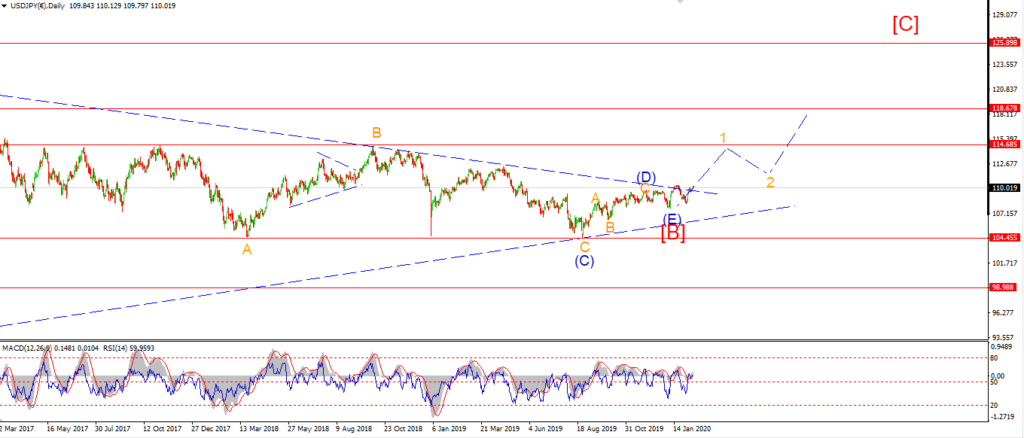
USDJPY took a massive hit today which has forced me to rethink the lay of the land a little.
The previous wave count was ruled out because of the depth of the decline in a possible fourth wave.
It is possible that the price is creating a series of bullish 1,2 waves off the triangle low at 107.65.
Todays big drop can be explained as a wave (c) of [ii] in that case.
If this is the case,
then we will have to see a large rebound tomorrow in five waves
to begin wave [iii] of ‘3’ to the upside.
This is a tall order now,
And if the price falls back below 108.27 again that will rule out the bullish case.
so I am looking at some alternate scenarios just in case.
Tomorrow;
Watch for wave [ii] to complete and wave (i) of [iii] begin.
A break of 112.22 again will signal wave [iii] has begun.
DOW JONES.
DOW 1hr.
DOW 4hr
DOW daily.
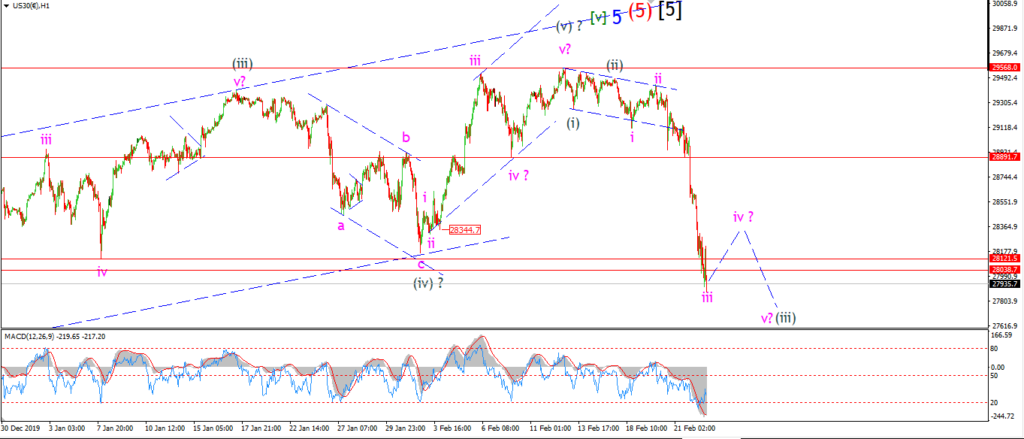
We were looking for an acceleration lower to raise the bearish case,
and boy dod we get it!
The low of the session today broke below 28000 again,
and broke the DOW back to unchanged for the year so far!
all in a couple of days trading!
Todays crash-like selloff,
was significant enough to turn full bearish in the shorter term.
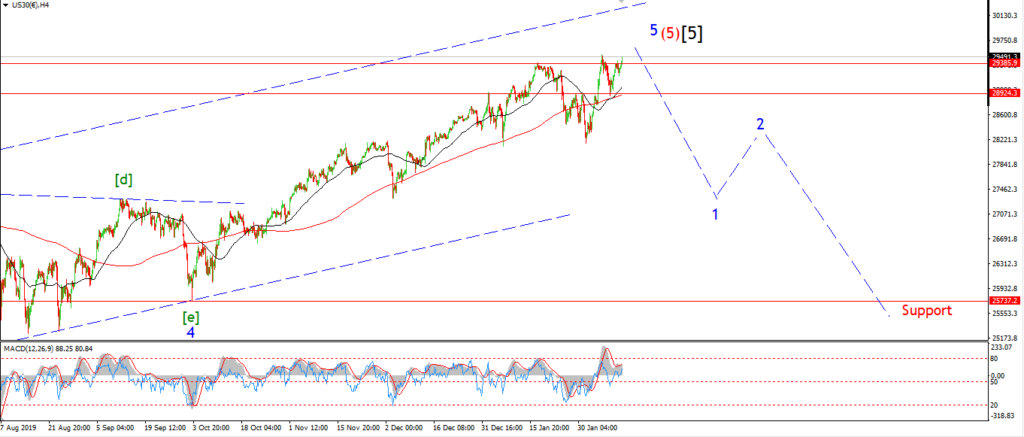
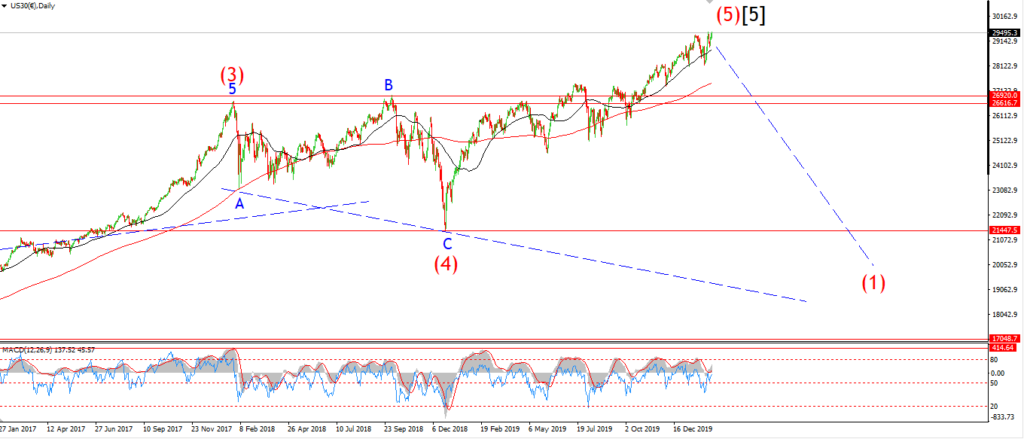
With the recent all time highs now marked as the final top of the bull market.
The major fly in the ointment now,
is the structure of the decline so far.
The drop can still be viewed as a three wave correction.
But,
it is possible that we are still building towards a larger five wave decline.
I will have to see another series of steps lower over the coming days
to complete a clear five wave pattern off the high.
So I will give the bearish side the benefit of the doubt this week.
Tomorrow;
The market has bottomed for now.
So this evenings bounce could be wave ‘iv’ of (iii) already underway.
I would like to see any rebound from this point
to be shallow and clearly corrective in three waves.
With a bit of luck,
we might get a solid five wave decline in the bag by the end of this week.
GOLD
GOLD 1hr.
GOLD 4hr.
GOLD daily.
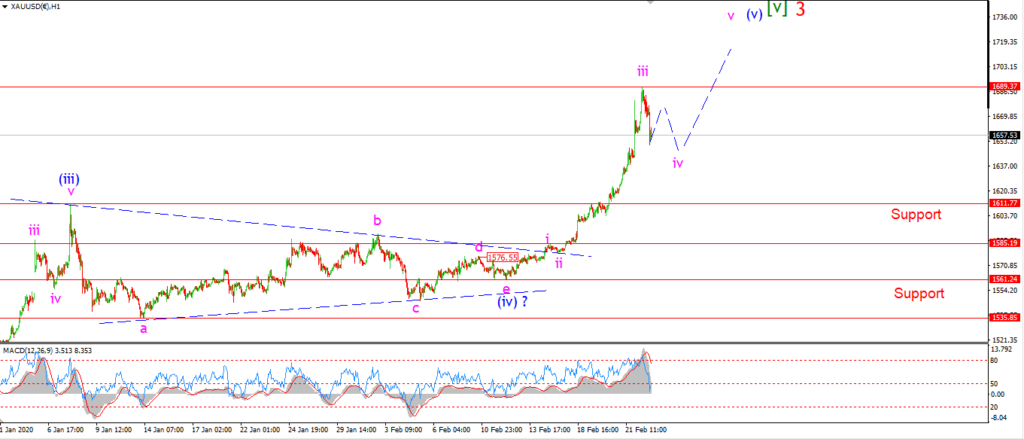
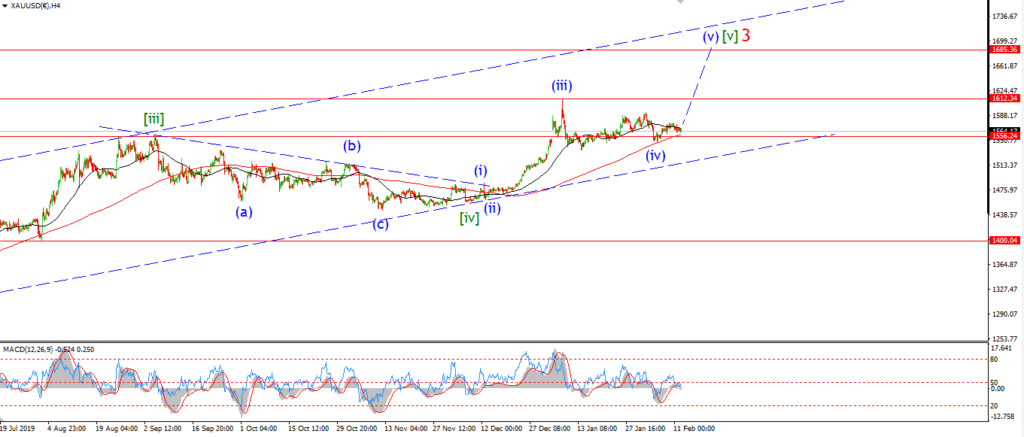
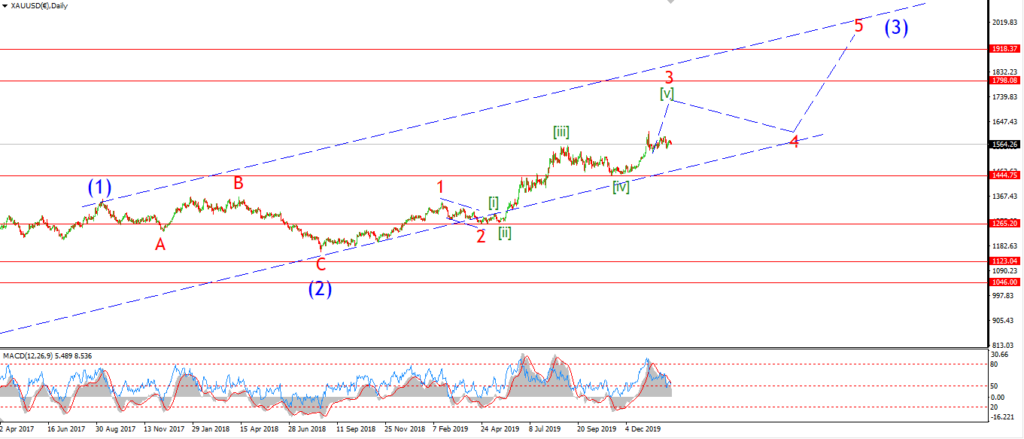
Gold hit a high today at 1689.37.
Not quite the 1700 I was looking for in wave (v) up,
so I am leaving the option open for another leg higher in wave ‘v’ of (v),
after a quick correction in wave ‘iv’ pink is complete.
If we go by the 4hr chart,
then wave (v) should hit a top up at the trend channel line,
this would happen at around 1740 or so.
Wave ‘iv’ should trace out three waves and complete above 1611 on the lower end.
If this is a fourth wave correction now underway off the high,
then I would not like to see it go down that low at all.
Tomorrow;
watch for wave ‘iv’ to trace out a three wave correction which should complete by midweek this week.
CRUDE OIL.
CRUDE OIL 1hr.

CRUDE OIL 4hr.

CRUDE OIL daily.
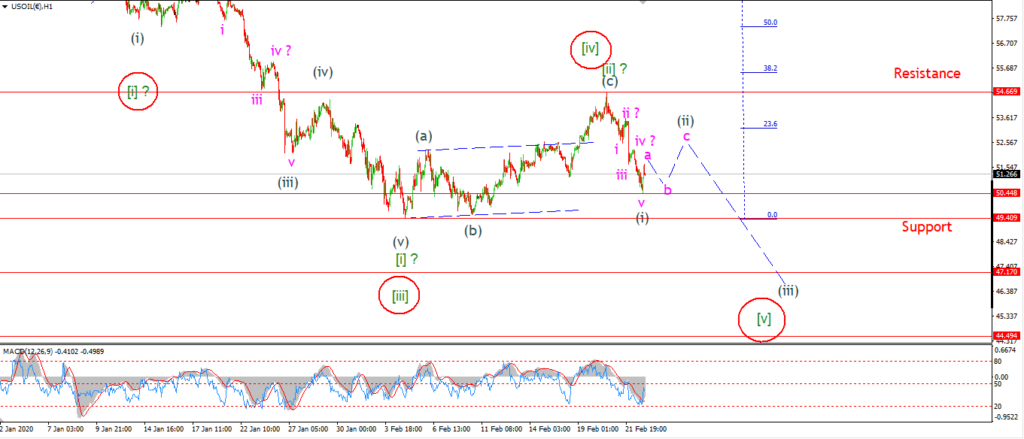
Crude may have completed five waves down off the wave [ii] high at this evenings lows.
The drop in wave (i) has not gone as far as I would hope,
but the internal pattern fits the bill so far.
The price is rebounding along with the stock market now.
This should be the beginning of wave (ii) up.
Wave (ii) should trace out three waves and complete below 54.66.
Tomorrow;
Watch for wave ‘a’ and ‘b’ to create a small higher low above 50.48.
S&P 500.
S&P 500 1hr
S&P 500 4hr
S&P 500 daily.
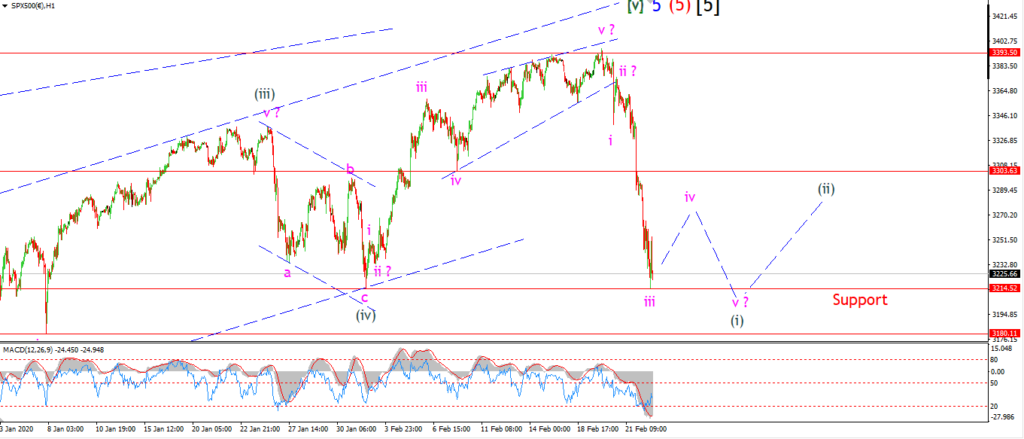
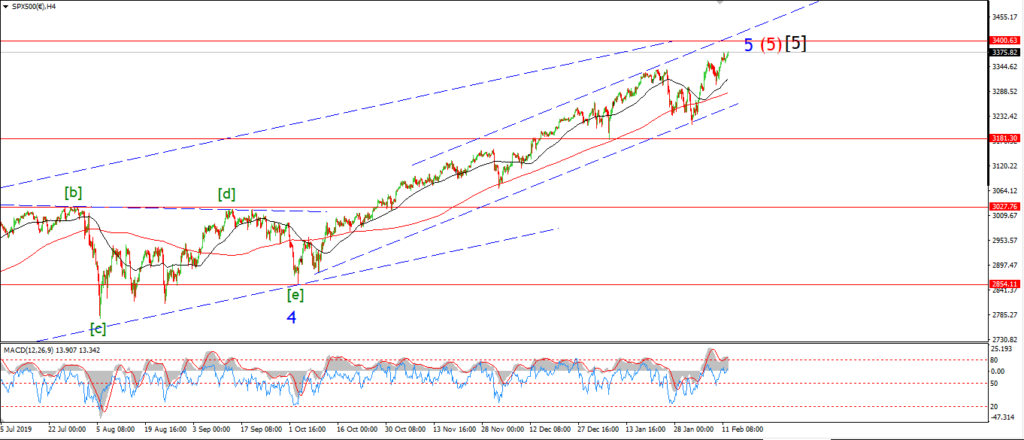
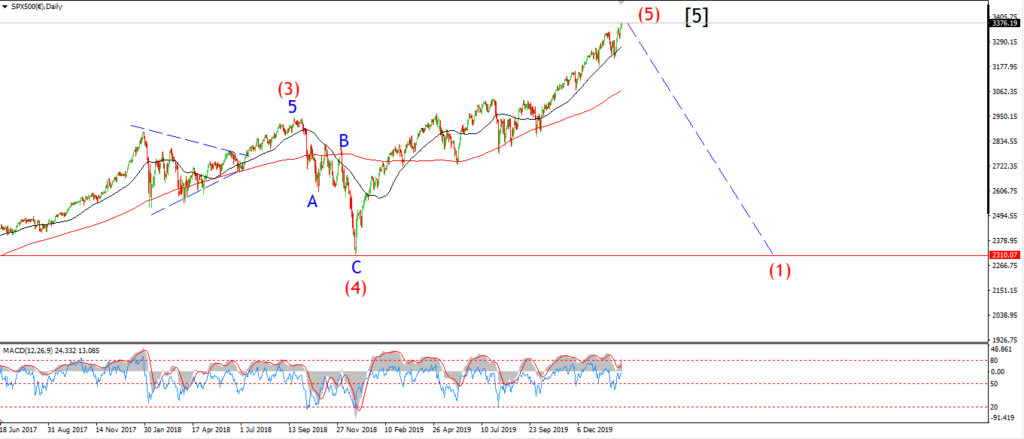
The S&P is now well on track to create a five wave structure lower off the all time high after todays plunge.
Things are beginning to look very dangerous for the market in the long term now.
If this is wave (i) down underway,
then we have seen the final highs for the market for a decade to come.
Firstly we must complete five waves down and a bearish lower high to get the ball rolling in this next bear market.
The S&P created an exact double bottom today with the previous wave (iv) low on the 2nd of Feb.
The price hit that low exactly,
and seems to have triggered some algo buying this evening.
I am labeling this rebound as a possible wave ‘iv’ of of (i).
Wave ‘iv’ should hold below 3300,
and then return lower in wave ‘v’ before the end of the week.
Tomorrow;
Watch for wave ‘iv’ to create a three wave correction over the coming days.
Wave ‘v’ should break the next lower support level at 3180 to complete wave (i).
SILVER.
SILVER 1hr
SILVER 4hr.
SILVER daily.
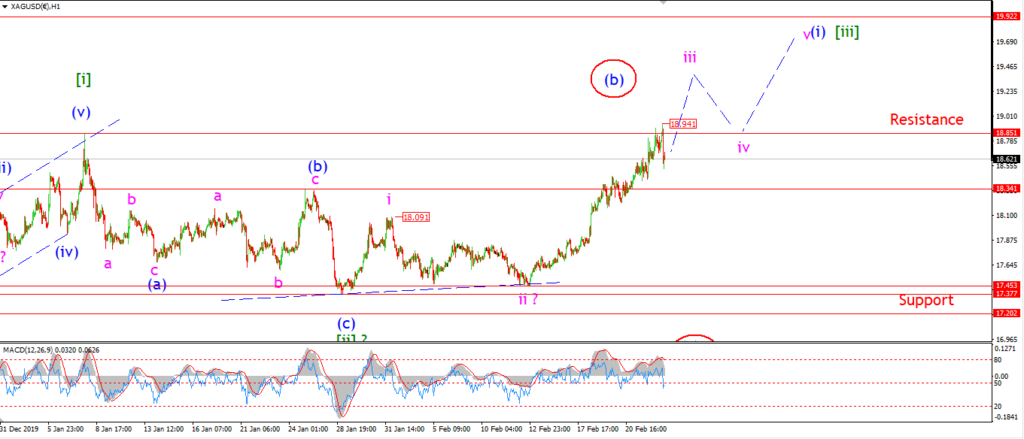
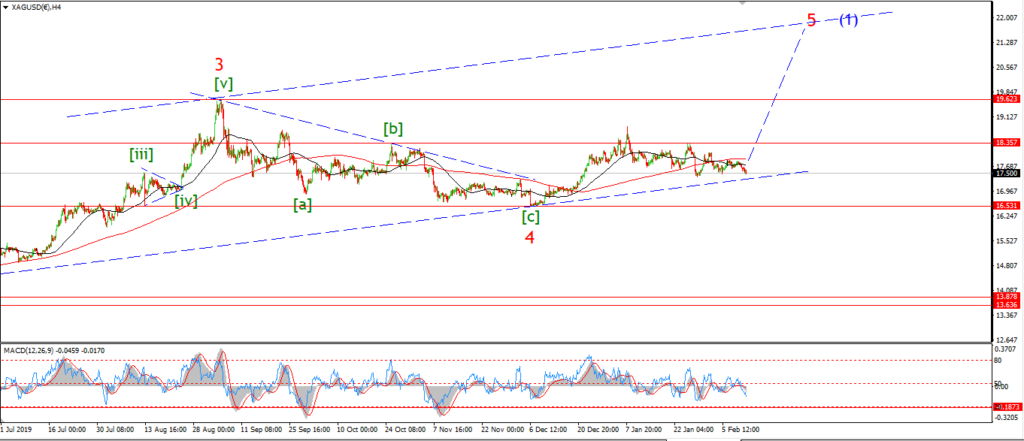
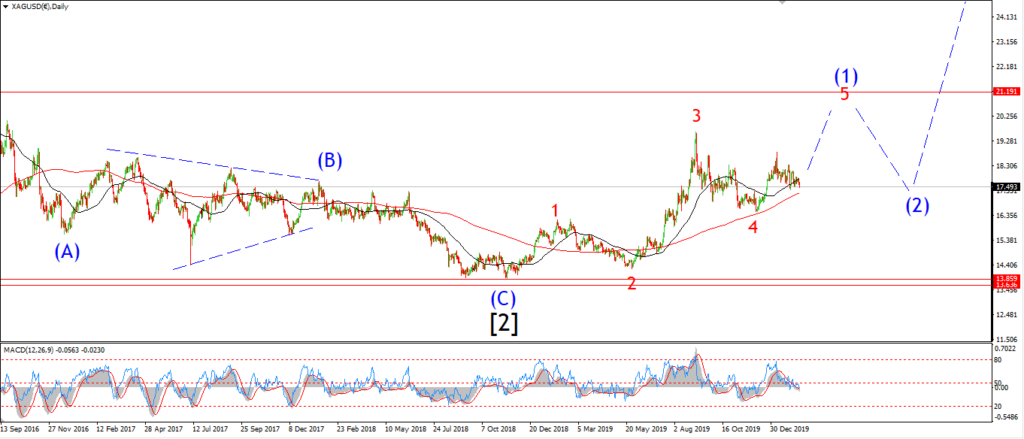
Silver broke above 18.85 today reaching a high at 18.94.
The price reversed quickly off that high and is holding above 18.60 now as we close.
I did expect some more upside in wave ‘iii’ before correcting in wave ‘iv’.
But it is possible that wave ‘iii’ is compelte at todays high
and wave ‘iv’ is now underway.
I will have to wait and see how this evenings correction plays out over the coming days.
in order to call a top in wave ‘iii’ now.
either way,
wave ‘v’ of (i) shold return higher by the end of the week.
Tomorrow;
a push back above 18.94 tomorrow will signal wave ‘iii’ is still inforce.
U.S 10YR.
US 10YR 1hr.
US 10YR 4hr.
US 10YR daily.
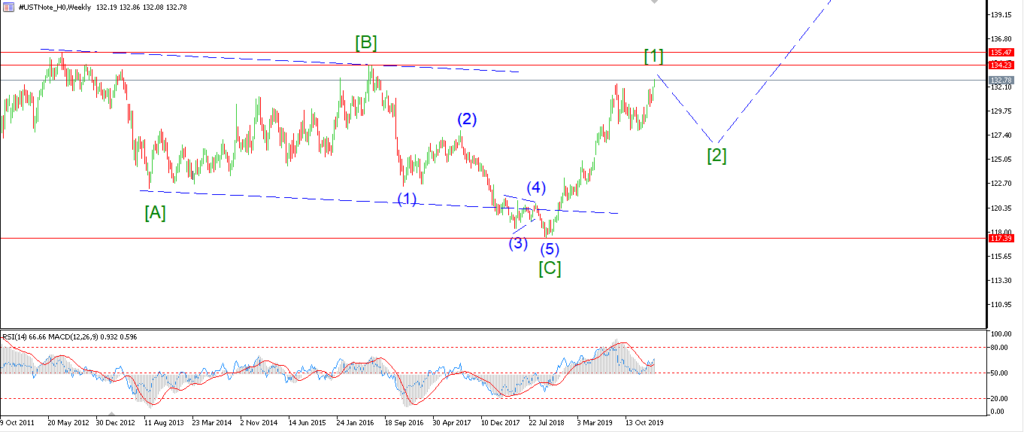
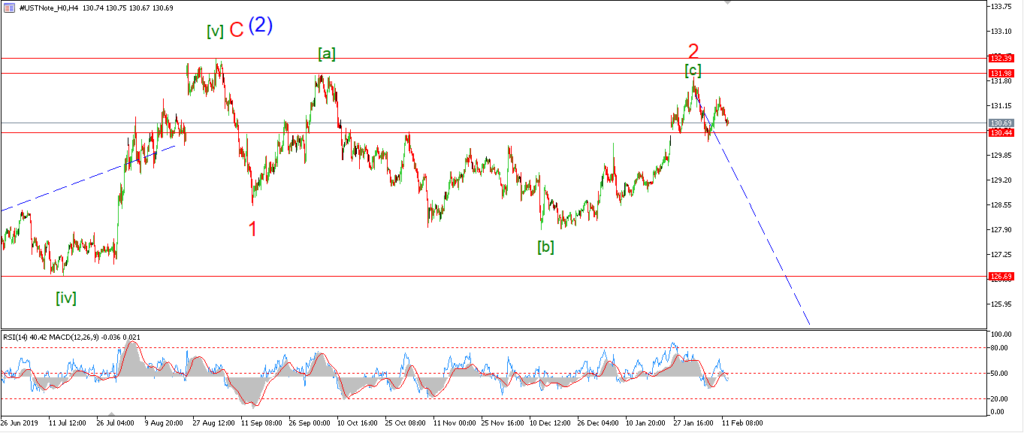
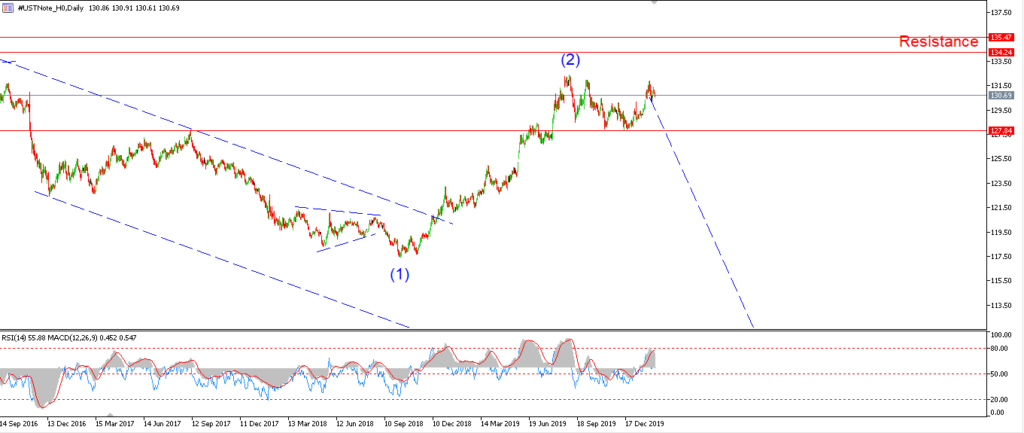
Well todays rally has broken through resistance as I feared,
and now we are in uncharted waters for the Bond market.
To explain my thoughts,
I have shown the weekly chart this evening as the main chart.
The decline off the July 2012 high was viewed as a series of 1,2 waves to begin a long term bear market.
It can also be viewed as a three wave pattern in a possible fourth wave correction.
If this count is correct,
then we may be on the verge of another long term binge in the bond market.
This might correlate well with a bear-market in the stock market.
But it is a completely different outcome than I had in mind.
For the moment,
I am going to let the short term chart develop a little before jumping to conclusions.