
Good evening folks, the Lord’s Blessings to you all.
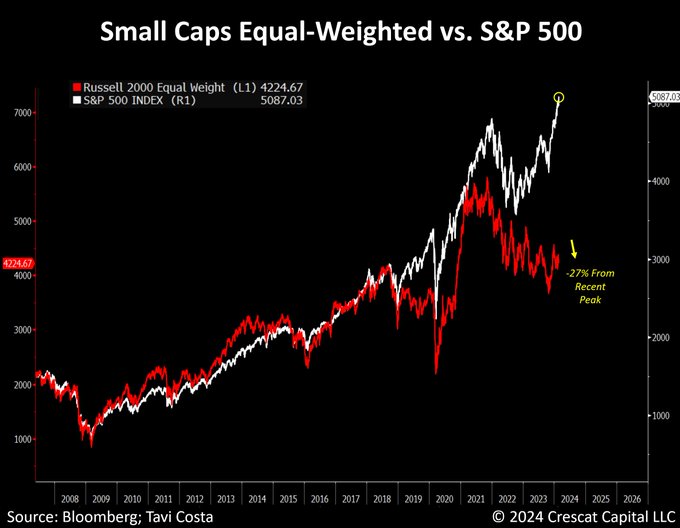
Below is Scott McNealy’s famous ‘What were you thinking?’ rant to investors for bidding Sun Microsystems’ stock price up to 10x sales during the DotCom bubble Keep in mind that $nvda is now trading at over 40x sales..


https://twitter.com/bullwavesreal
EURUSD.
EURUSD 1hr.
EURUSD 4hr.
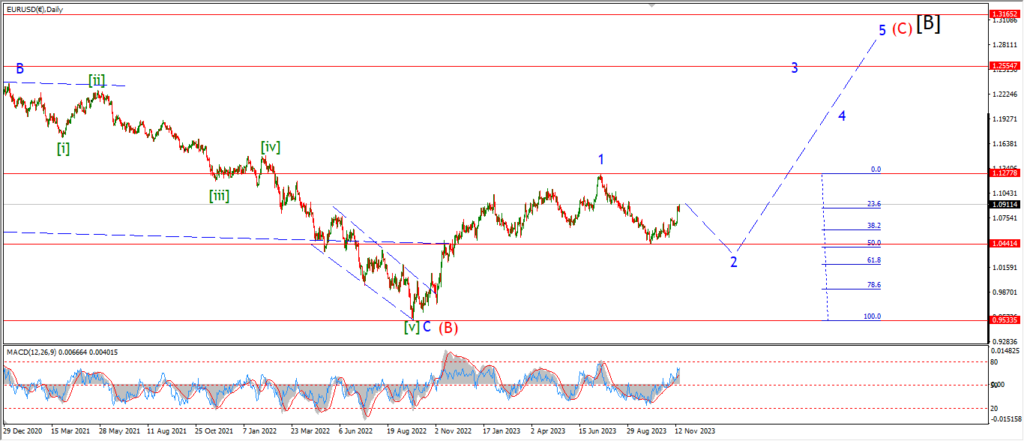
EURUSD daily.
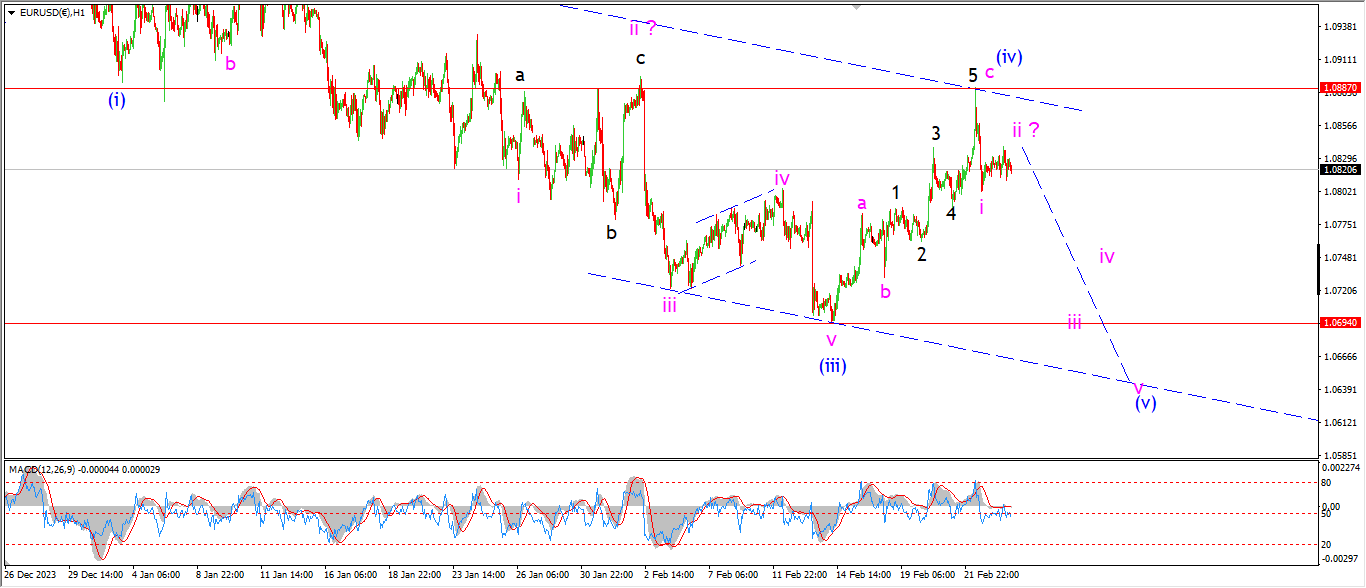
EURUSD is holding below the wave (iv) lows at 1.0887 again today.
The action is corrective today for sure,
and I am suggesting that wave ‘i’ and ‘ii’ of (v) is now underway off that high.
Wave (v) is expected to fall in five waves next week as usual.
and the minimum target lies at 1.0694 at the wave (iii) low.
but I do want to see a much lower low for that final wave (v) of [c].
The ideal target lies at 1.0440.
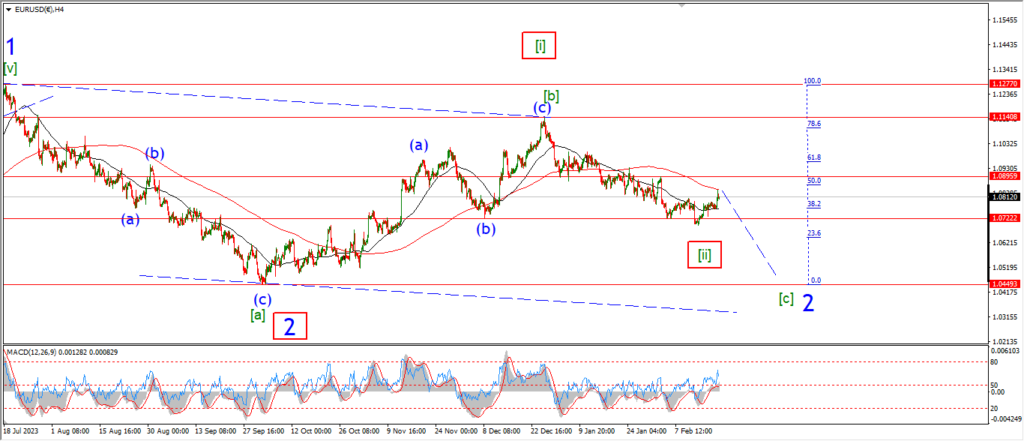
The main alternate count on the 4hr chart is still viable even now.
So I will be keeping an eye on that next week to see if there is a better fit developing.
Monday;
Wave (iv) must hold again.
And wave ‘iii’ of (v) should begin with a sharp drop into 1.0750.
GBPUSD
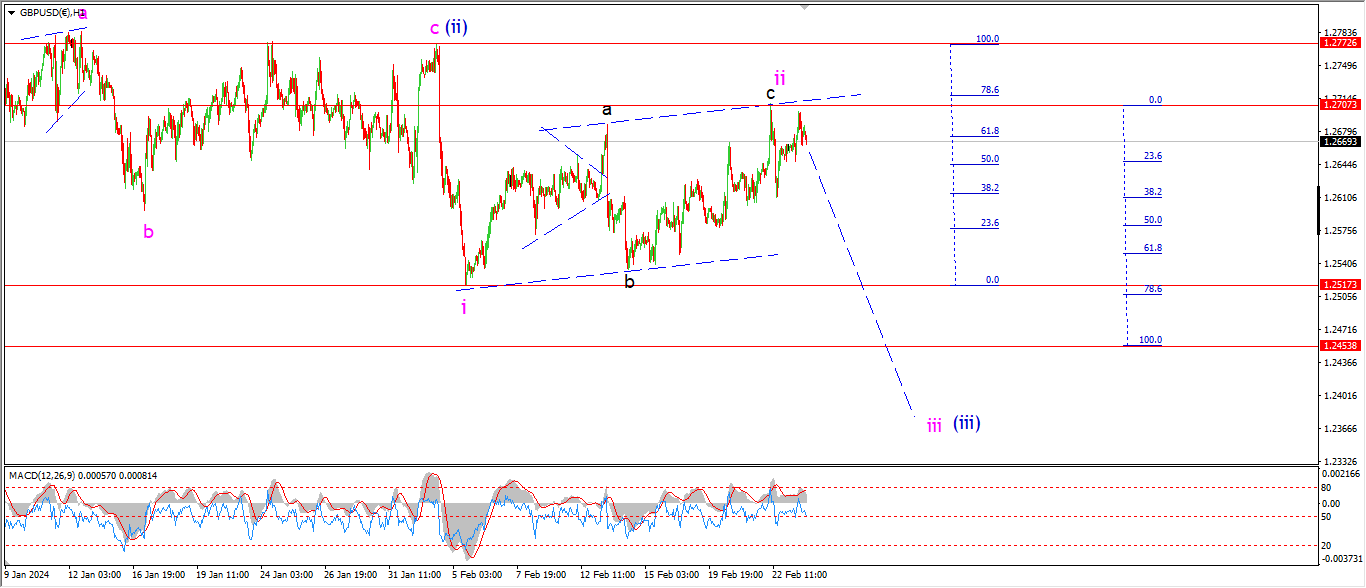
GBPUSD 1hr.
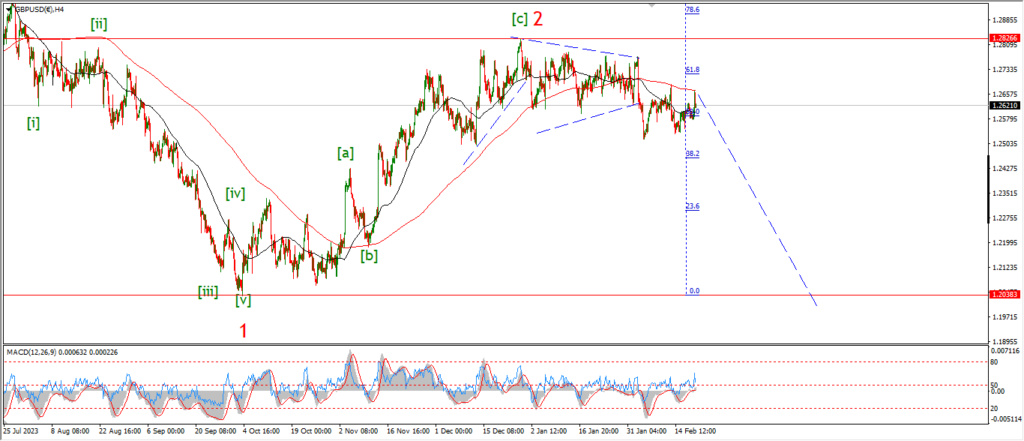
GBPUSD 4hr.
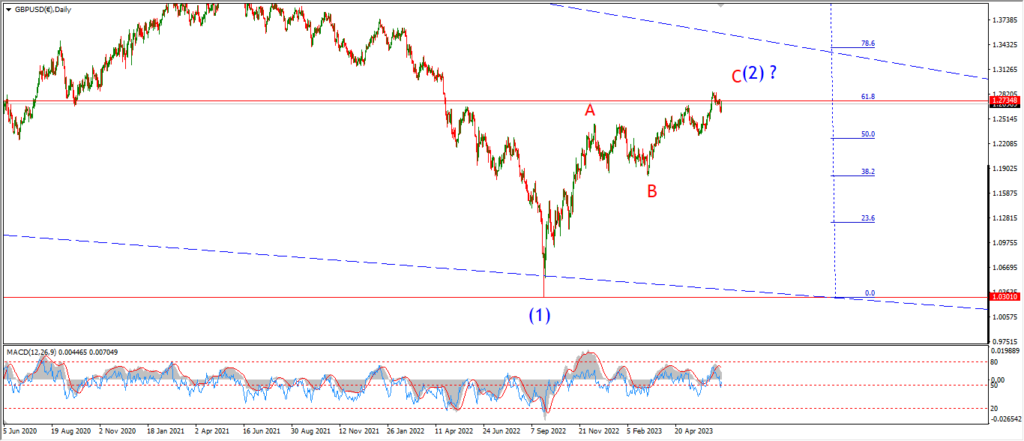
GBPUSD daily.
Cable is holding below the wave ‘ii’ high this evening,
but the price did threaten to break to a new high today.
At the moment it is still possible that wave ‘ii’ will get even more complex and complete another lower high below 1.2772.
That wave (ii) high must hold for this short term count to remain valid.
so I will be looking for a drop back into wave ‘iii’ of (iii) again next week to confirm the larger pattern.
Monday;
Watch for wave (ii) to hold at 1.2770.
Wave ‘iii’ of (iii) must turn lower pretty soon.
and wave ‘iii’ will be confirmed with a break of 1.2517.
USDJPY.
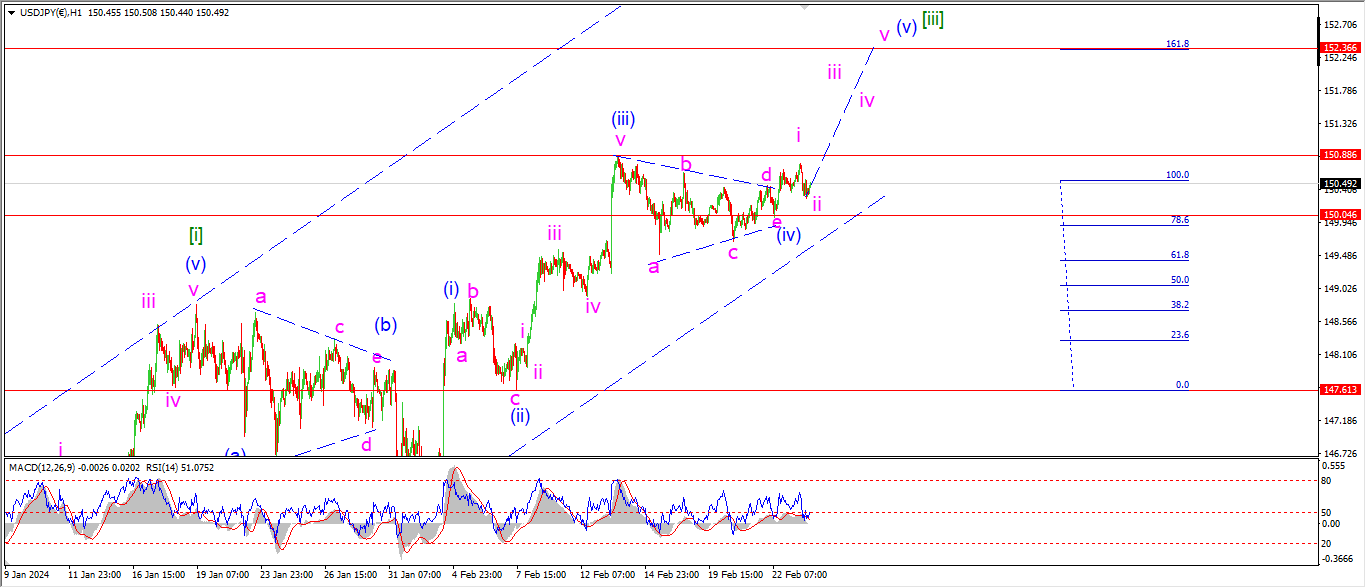
USDJPY 1hr.
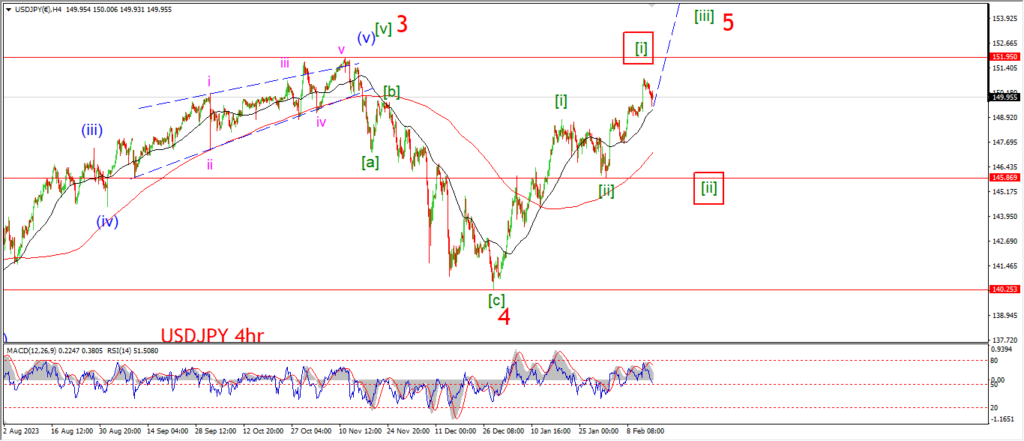
USDJPY 4hr.
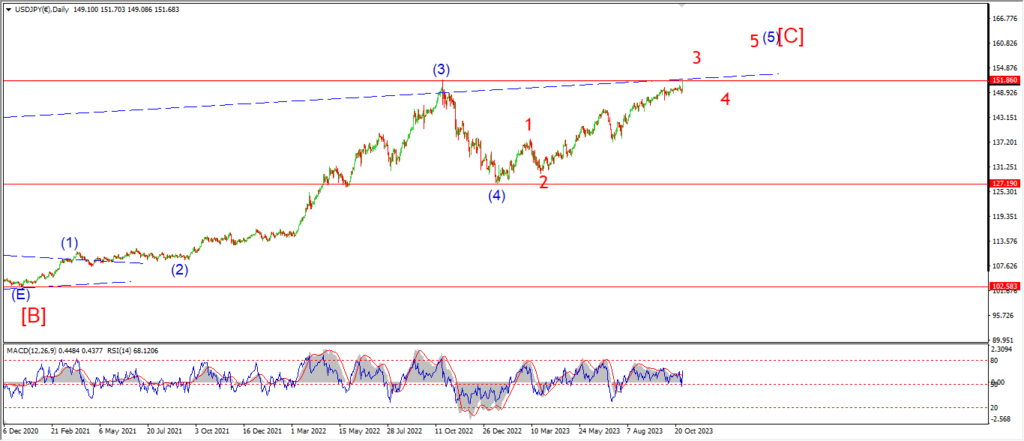
USDJPY daily.
USDJPY has ended the week within a few pips of the opening price on Monday morning.
This fact alone shows us a consolidation is underway here in wave (iv).
the only thing up for argument here is the pattern of that wave (iv) correction.
I am sticking with the triangle idea again tonight.
And if that pattern holds next week,
then we should see a continued rally into wave (v) blue over the coming days.
Monday;
Watch for wave ‘iii’ of (v) to rally into the 152.00 handle again.
I am suggesting a high for wave (v) of [iii] near 152.36.
that level is given by the Fibonacci extension of wave (i).
This level should be a standard target for wave (iii) blue,
but at the moment it seems USDJPY is running out of momentum so I will not ask for so much from the final move higher in wave [iii].
DOW JONES.
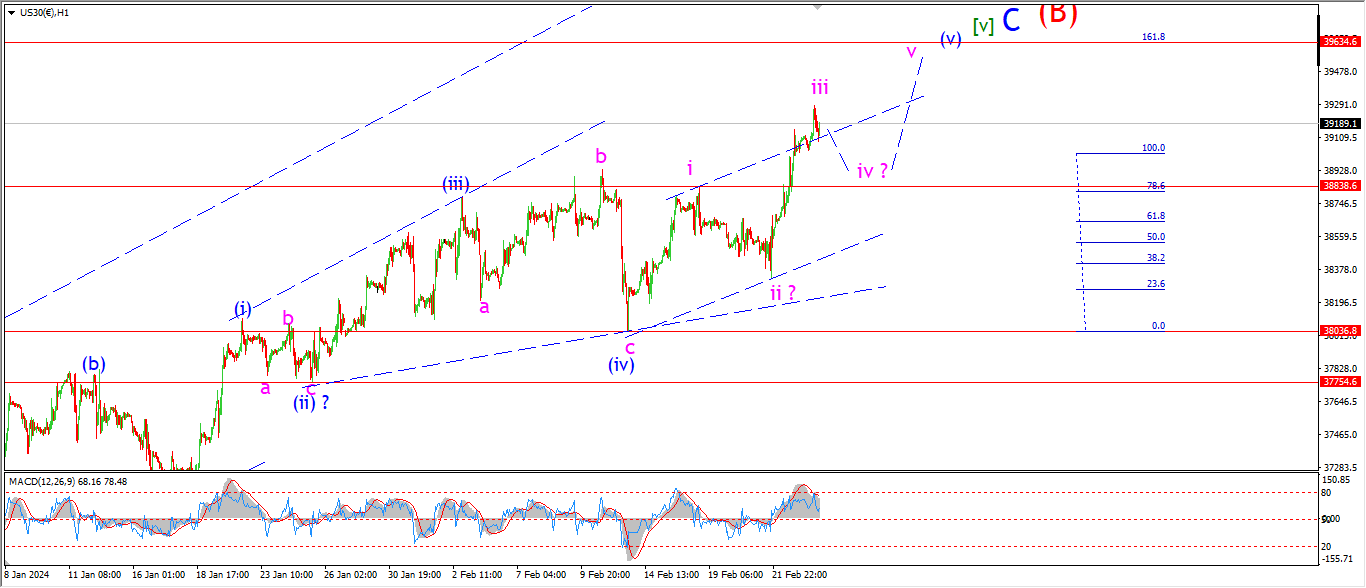
DOW 1hr.
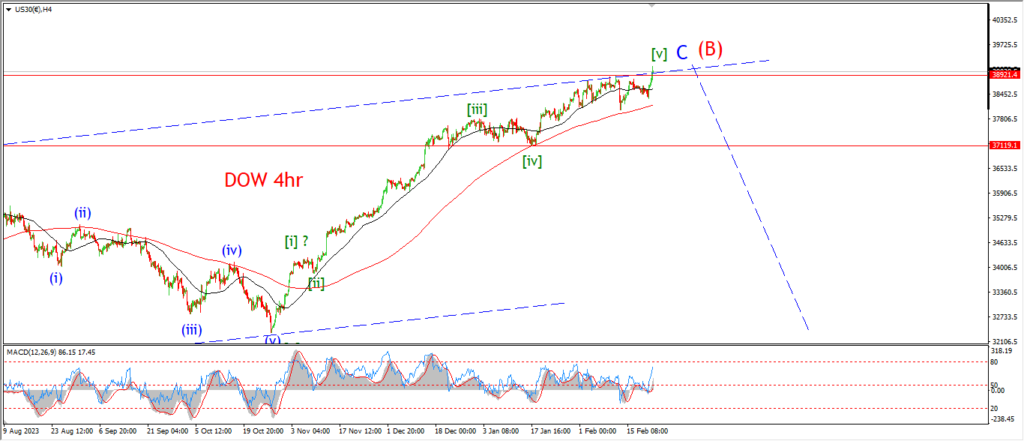
DOW 4hr
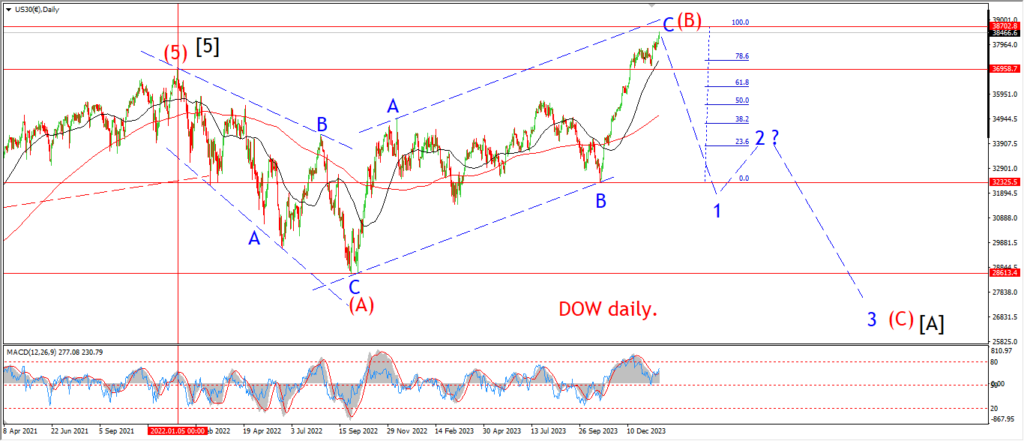
DOW daily.
The DOW is falling off the session highs this evening and that action may be closing out an internal wave of wave (v) now.
The pattern I am looking at for wave (v) of [v] now involves a standard five waves.
And todays highs tops out wave ‘iii’ of (v).
A correction into wave ‘iv’ of (v) is now underway,
and then a new,
and very un-welcome rally in wave is set for next week.
At this point it is easy suggest a new all time high will occur next week,
but to fit that possibility into a coherent pattern that involves all the previous action over the last year,
that is where things get difficult.
This pattern for wave [v] green is actually a standard five wave pattern now.
The internal run up in wave (iii) is not the longest wave of the pattern,
wave (v) will take that prize in this scenario.
And then the hunt begins for another possible reversal.
Monday;
Watch for wave (v) to complete a standard five wave pattern as shown next week.
Wave ‘iv’ m ust hold above the wave ‘i’ high must at 38838.
GOLD
GOLD 1hr.
GOLD 4hr.

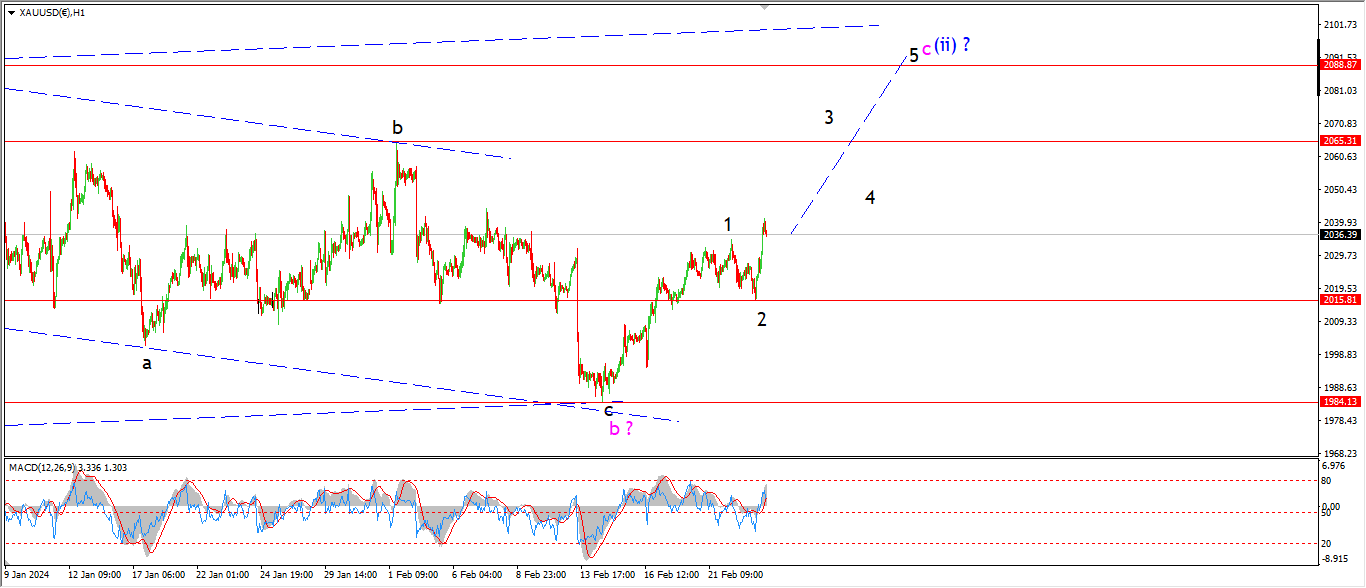
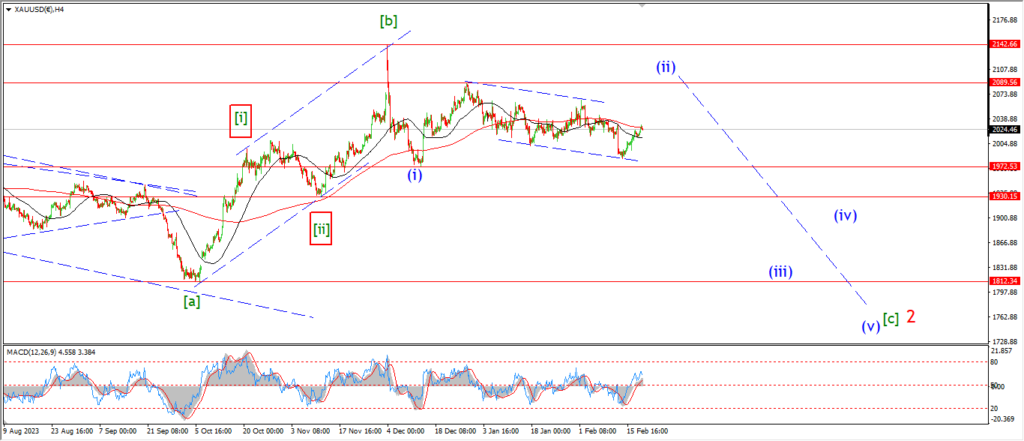
GOLD daily.
Gold has turned higher today after a short correction in wave ‘2’ completed this morning.
The price seems set for a rally in wave ‘3’ of ‘c’ early next week now.
and the minimum target for wave ‘3’ lies at the 2065 high at wave ‘b’.
Wave ‘c’ is expected to top out near the upper trend channel line near 2090 again.
And once this pattern completes,
then I will look lower again into wave (iii).
Monday;
Watch for wave ‘2’ to hold at 2015.80.
Wave ‘3’ must continue higher as shown.
CRUDE OIL.
CRUDE OIL 1hr.
CRUDE OIL 4hr.
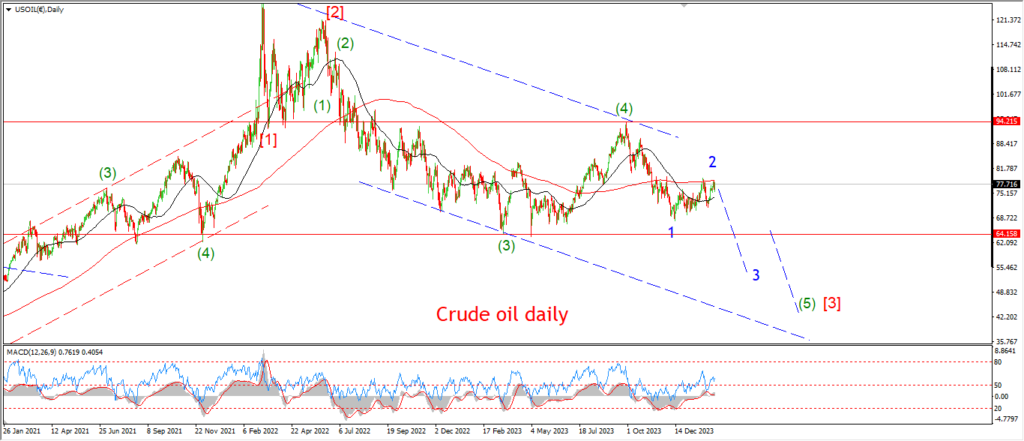
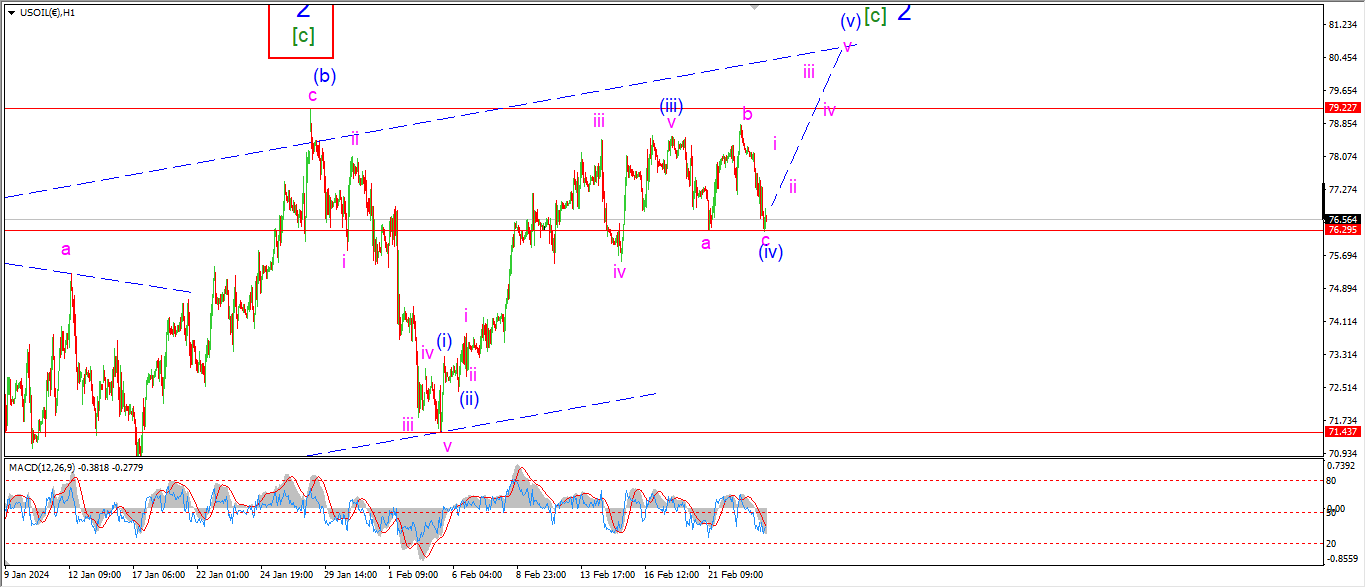
CRUDE OIL daily.
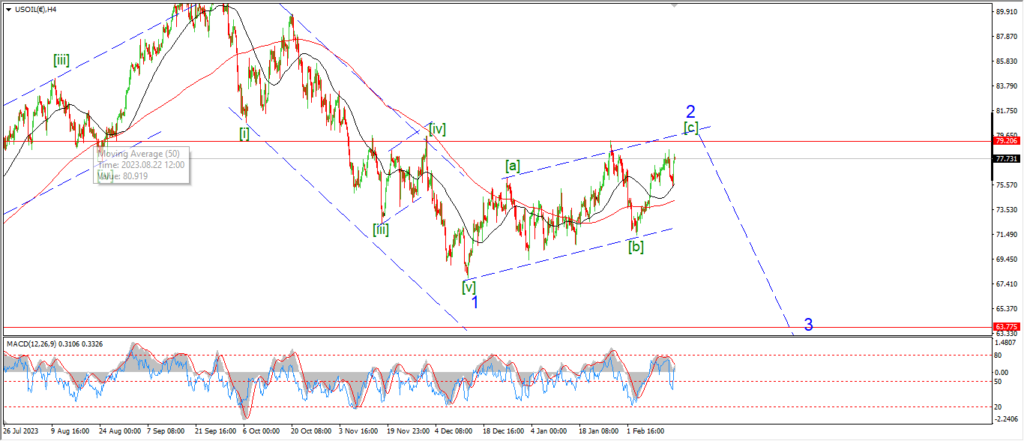
I am taking a little different tack on this weeks action in crude oil.
The price has gone sideways now for almost 2 weeks.
That action suggests a series of corrections as shown.
The lows this week are now labelled wave (iv) of [c].
And I am looking higher for next week into wave (v).
Wave (v) of [c] will top out near 81.00 in this scenario.
Monday;
Watch for wave (iv) to complete very soon.
Wave ‘i’ of (v) will spike up towards 78.00 and a five wave rally should complete by the end of next week.
S&P 500.
S&P 500 1hr
S&P 500 4hr
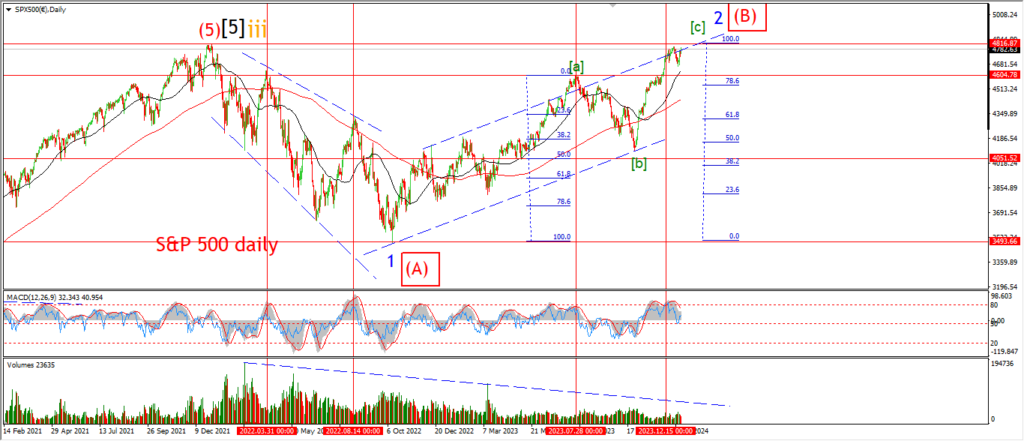
S&P 500 daily.
I am still chewing on the possibilities here for the S&P after this weeks new high.
I will start from the larger pattern tonight.
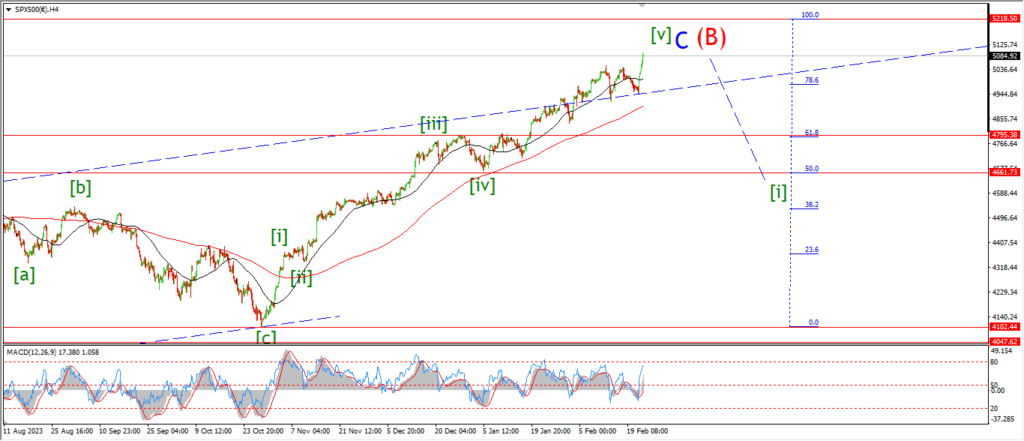
I am pretty certain about this new all time high occurring in a large (B) wave.
This classification fits with the reality on the ground.
ITs a fake new high on shaky foundations.
And that is where we stand.
Three waves up in wave (B) is completing now with wave ‘C’ blue topping off the pattern.
There is a possibility for wave ‘C’ to match the length of wave ‘A’.
and that gives a potential 5220 where wave ‘A’ and ‘C’ reach equality.
You can see this on the 4hr chart.
The internal pattern of wave ‘C’ is in five waves.
so there is no problem there.
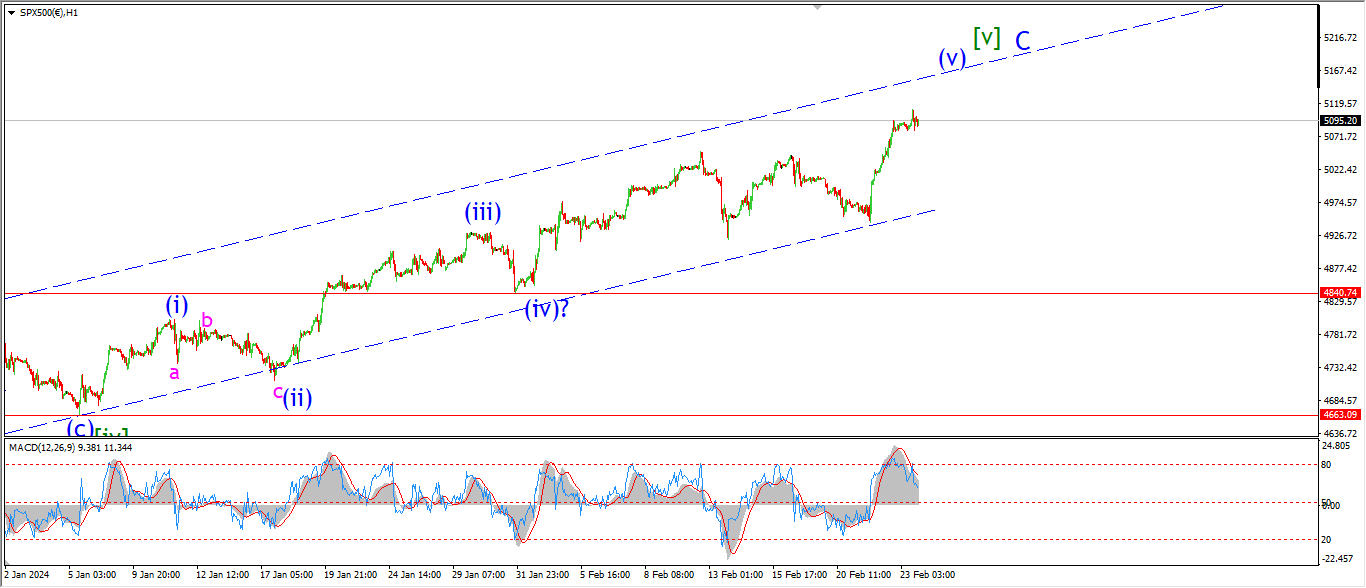
I do hit an issue onw with the internal pattern of wave [v] green on the hourly chart.
And that is what I am chewing on these days.
I no we are running higher in wave (v) of [v] now,
but I am not sure of the correct internal labelling of wave [v],
so that about sums it up.
The upper channel line is coming up fast here.
and a tag of that channel will probably coincide with 5220 also.
Lets see how that goes on Monday.
I have one last though to leave you with regarding the stock market.
What happens to the wider market when NVDA reports an actual slowing in revenues.
And that will happen this year.
What goes up,
must get smashed on the way back down.
SILVER.
SILVER 1hr
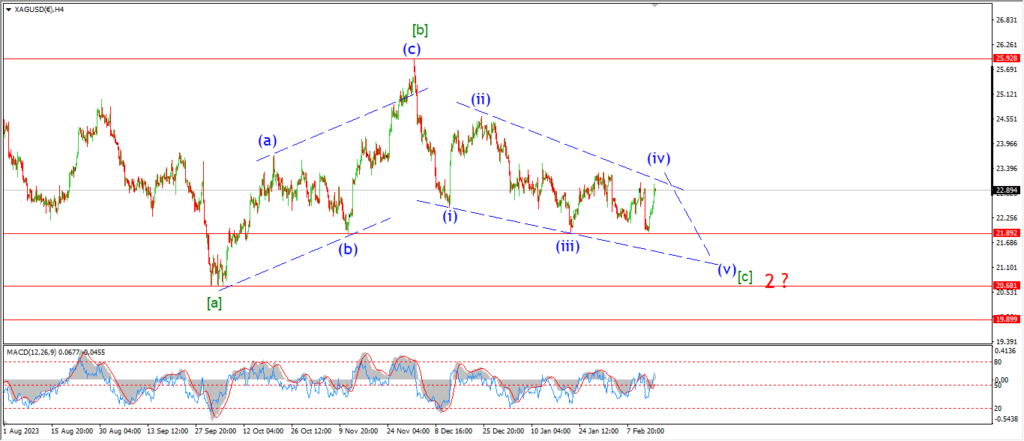
SILVER 4hr.
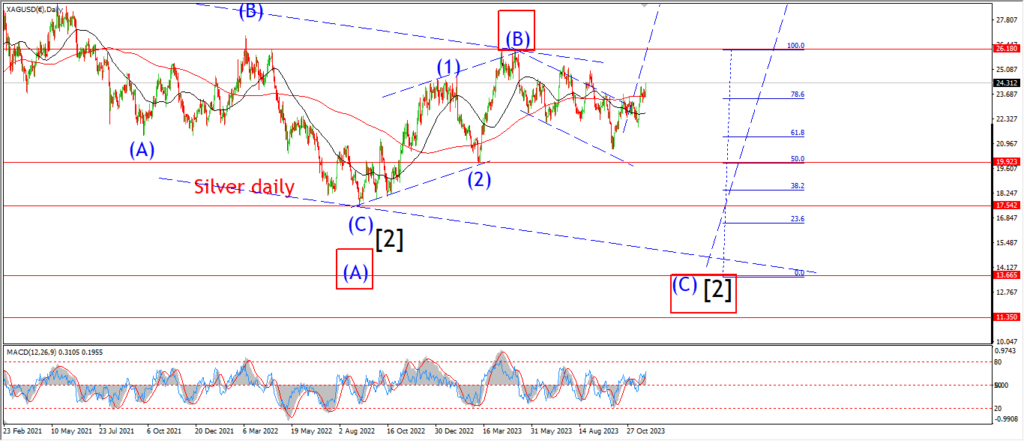
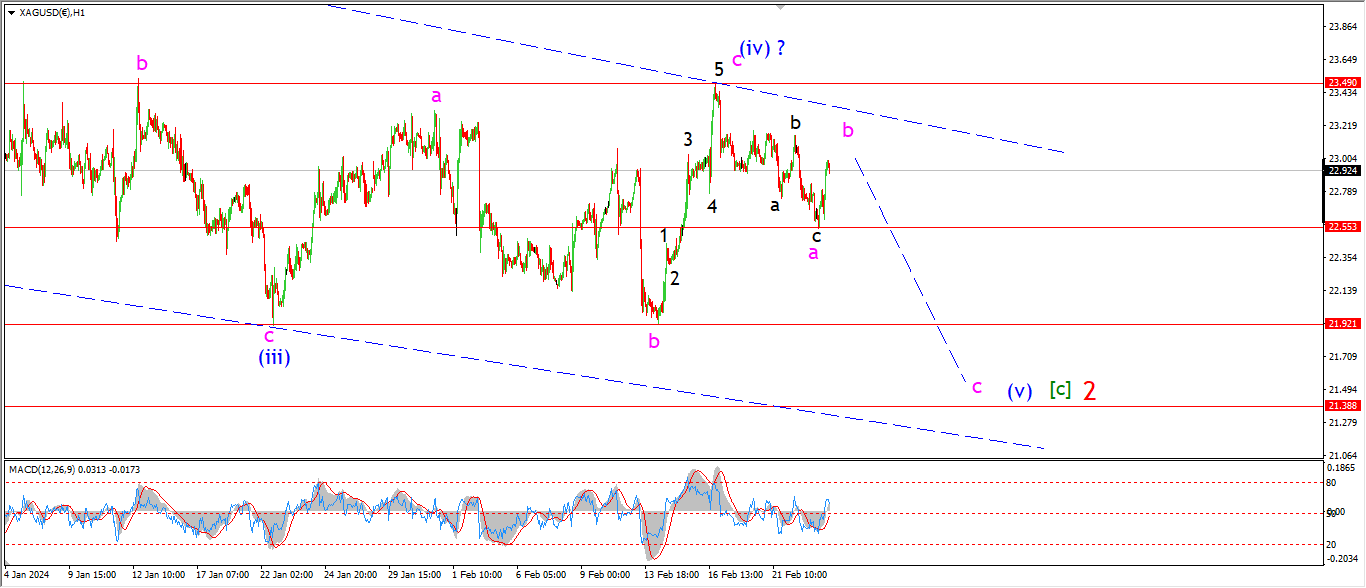
SILVER daily.
Wave ‘a’ has completed at todays lows of 22.55.
And now a rally in wave ‘b’ is underway.
Wave ‘b’ of (v) will trace out a three wave sideways pattern,
and then wave ‘c’ should turn lower again later next week.
Wave ‘c’ of (v) of [c] of ‘2’ has a minimum target at 21.90 and after that I am willing to look for a turn hgiher again.
Monday;
Watch for wave ‘b’ to top out below 23.49 and then turn lower into wave ‘c’ of (v).
BITCOIN
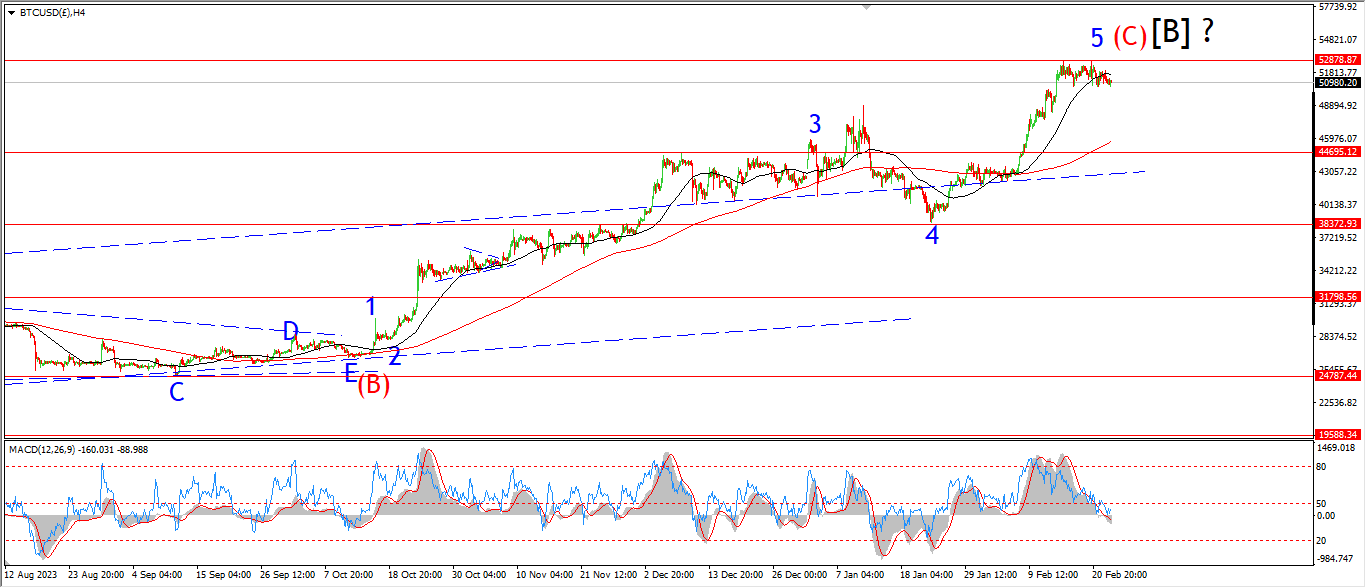
BITCOIN 1hr.
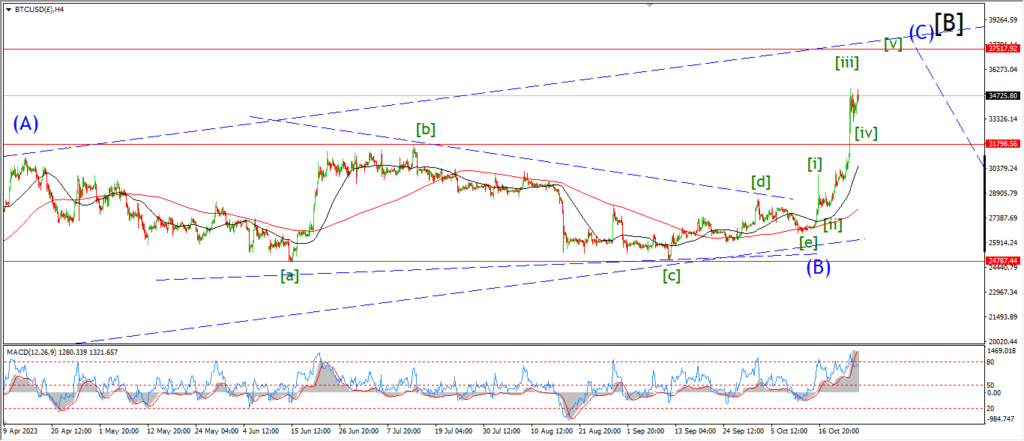
BITCOIN 4hr.
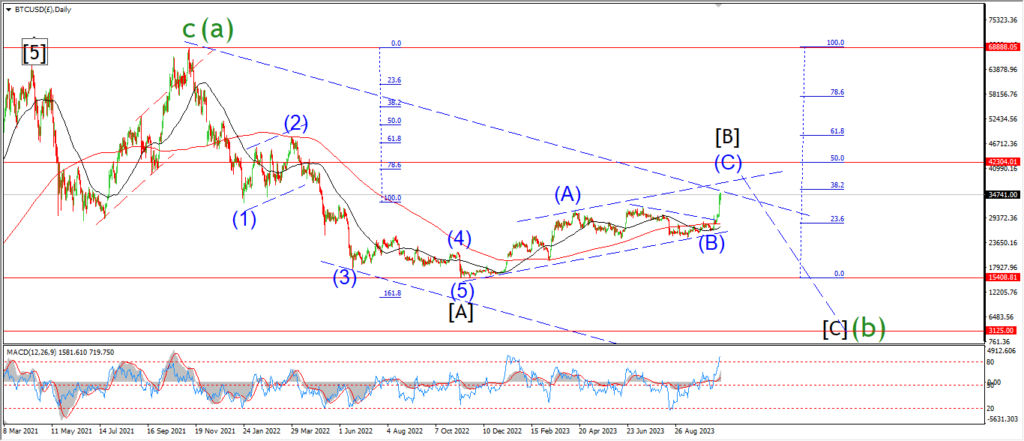
BITCOIN daily.
….
FTSE 100.
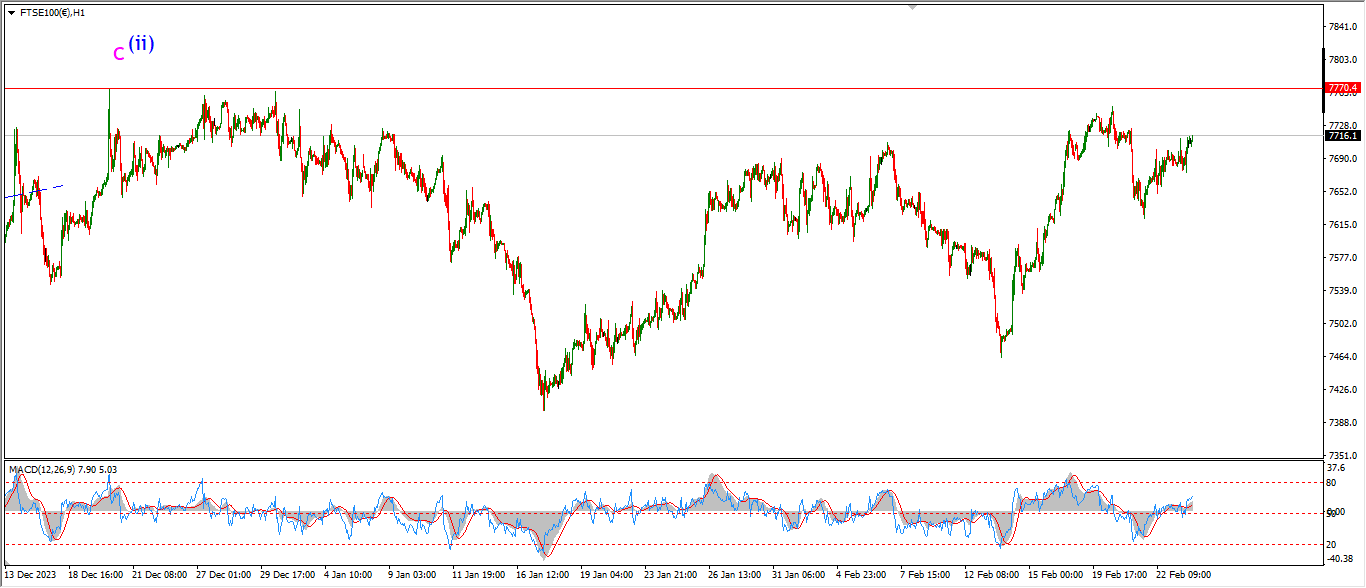
FTSE 100 1hr.

FTSE 100 4hr.

FTSE 100 daily.
….
DAX.
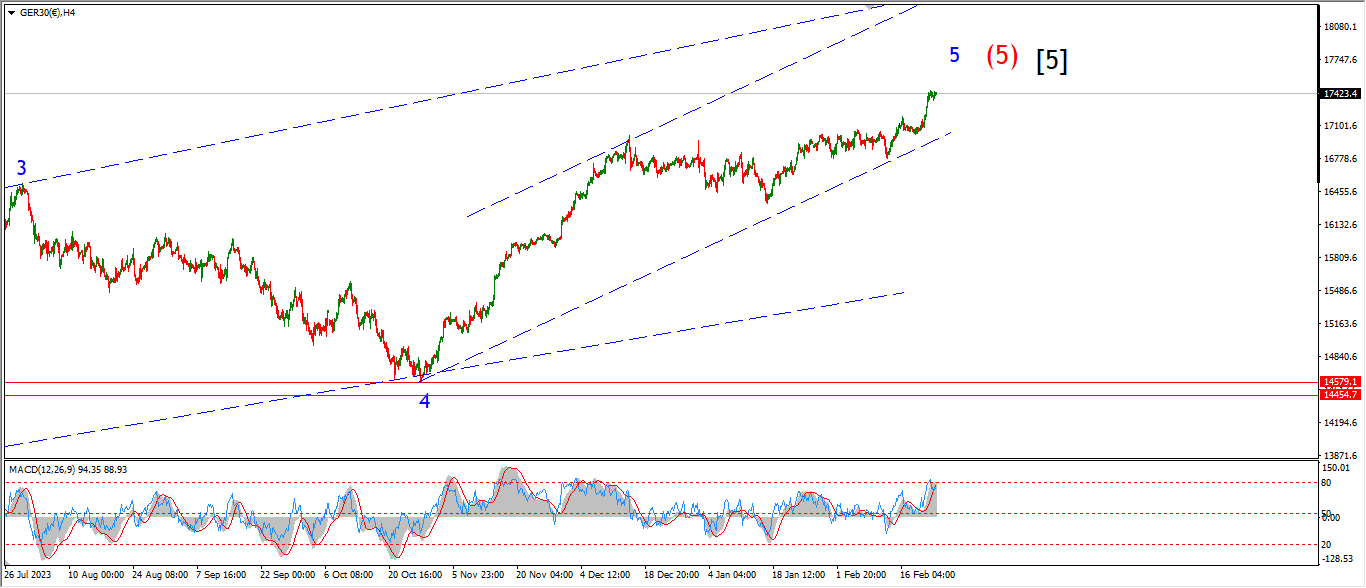
DAX 1hr

DAX 4hr

DAX daily.
….
NASDAQ 100.
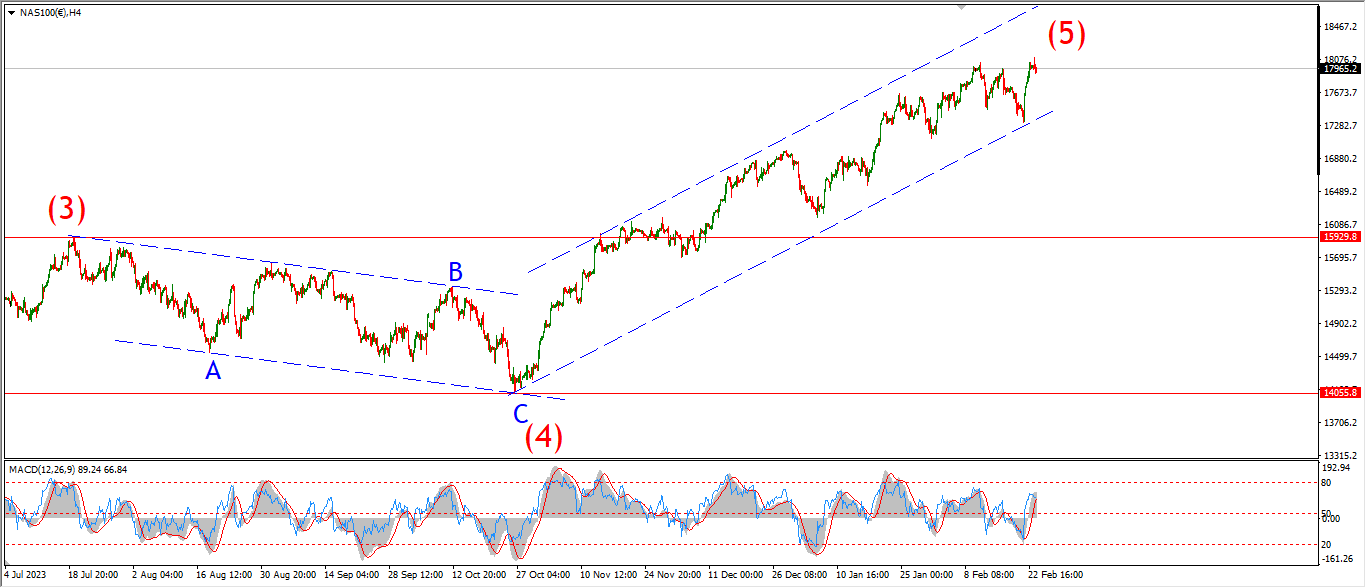
NASDAQ 1hr
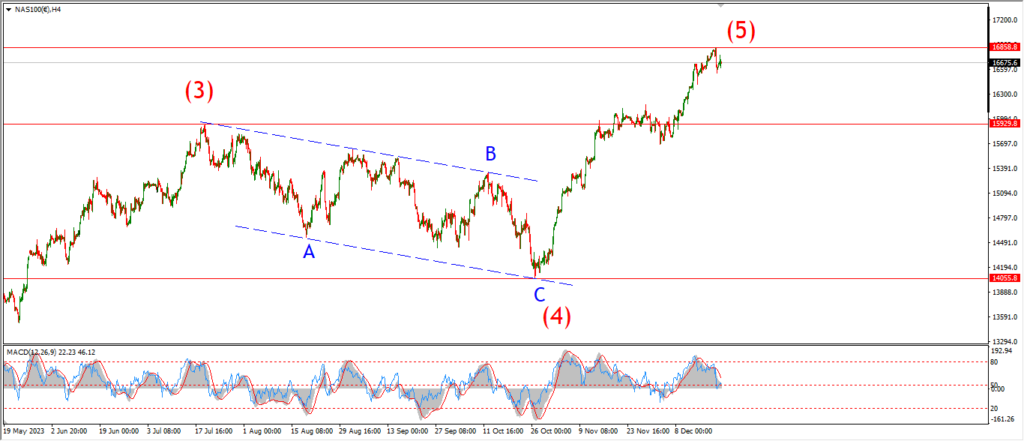
NASDAQ 4hr.
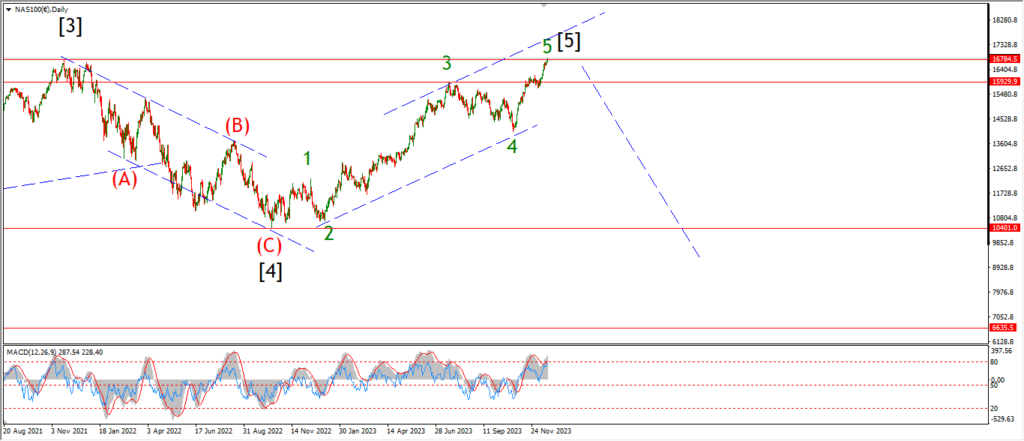
NASDAQ daily.
….