
[vc_row][vc_column][vc_separator border_width=”5″][/vc_column][/vc_row]
[vc_row][vc_column][vc_column_text]
Hi everyone.
I’m home thank God!
And with that another look at sentiment tonight,
this time the leaps put/call data courtesy of marketharmonics.com again.
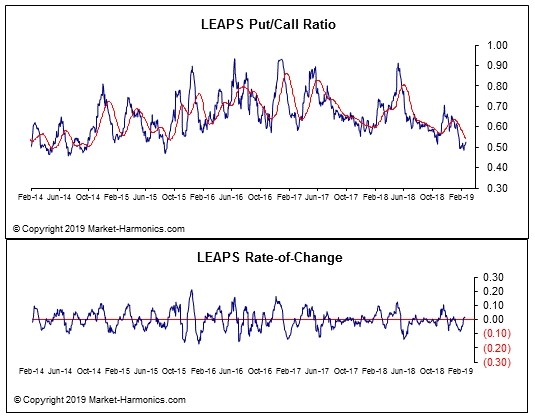
The ratio is now at an extreme in bullishness
This is particularly telling when you add in that fact that these options are long term plays on the market.
Which means traders are long term extreme bullish and at an extreme valuation point.
At a minimum,
this extreme reading will have to come back into the mid range with a selloff in wave ‘C’.
But the idea of a drop in wave ‘3’ of (3) is still a possibility!
[/vc_column_text][/vc_column][/vc_row]
[_s2If current_user_can(access_s2member_ccap_eurusd)]
[vc_row][vc_column][vc_separator border_width=”5″][/vc_column][/vc_row]
[vc_row][vc_column][vc_column_text]
EURUSD
[/vc_column_text][/vc_column][/vc_row]
[vc_row][vc_column][vc_separator border_width=”5″][/vc_column][/vc_row][vc_row][vc_column width=”2/3″][vc_custom_heading text=”1 hr” use_theme_fonts=”yes”][vc_column_text]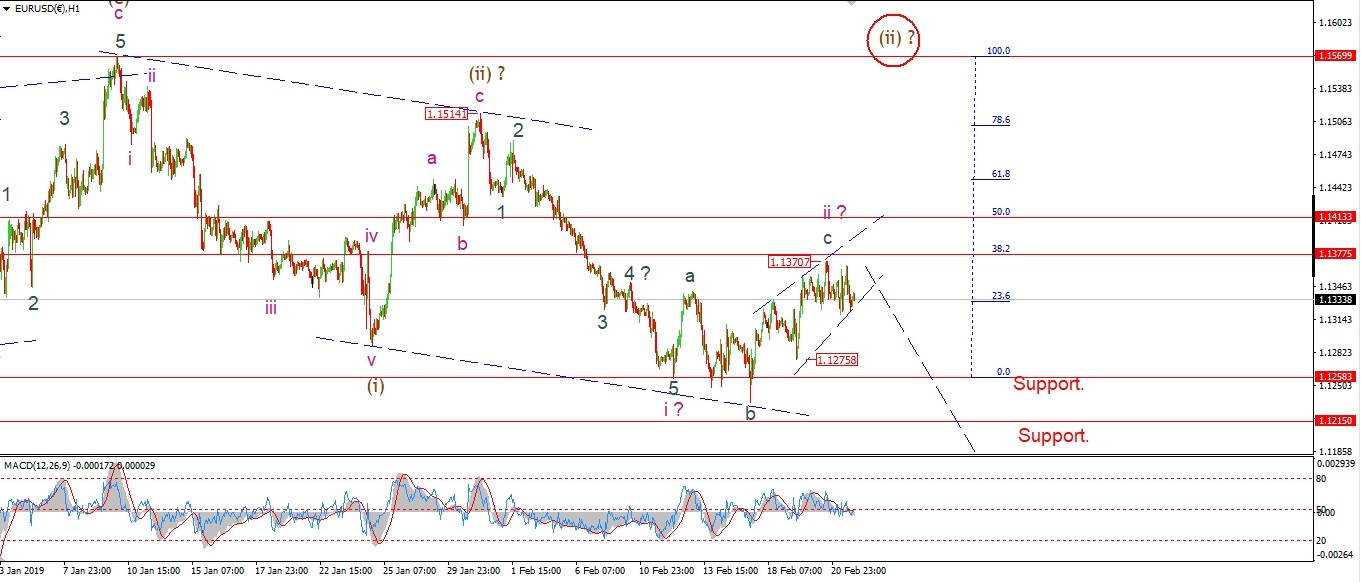 [/vc_column_text][/vc_column][vc_column width=”1/3″][vc_custom_heading text=”4 Hours” use_theme_fonts=”yes”][vc_column_text]
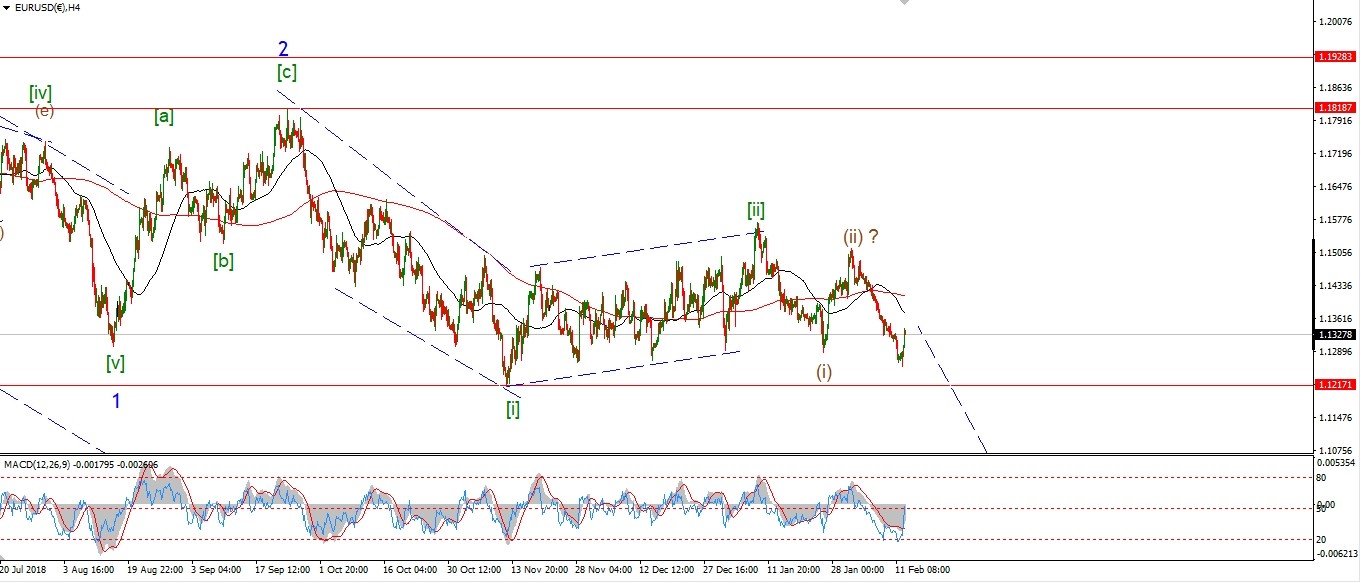 [/vc_column_text][vc_custom_heading text=”Daily” use_theme_fonts=”yes”][vc_column_text]
 [/vc_column_text][/vc_column][/vc_row]
[vc_row][vc_column][vc_column_text]
EURUSD is stuck in a tight trading range today,
this is indicative of a corrective wave form.
so wave ‘c’ of ‘ii’ could still be in operation and correcting in a fourth wave.
If the price breaks 1.1370 again tomorrow
then price will likely run up towards the 50% retracement level at 1.1413 to complete wave ‘ii’.
I am still keeping one eye on that alternate count as sentiment is fairly negative now on EURUSD,
so this could lead to a relief rally in a larger wave (c).
Tomorrow;
Wave ‘c’ could continue higher into the 50% retracement level.
Although a break of 1.1275 will signal that wave ‘ii’ has completed.
[/vc_column_text][/vc_column][/vc_row]
[/_s2If]
[_s2If current_user_can(access_s2member_ccap_gbpusd)]
[vc_row][vc_column][vc_separator border_width=”5″][/vc_column][/vc_row][vc_row][vc_column][vc_column_text]
GBPUSD
[/vc_column_text][/vc_column][/vc_row][vc_row][vc_column][vc_separator border_width=”5″][/vc_column][/vc_row][vc_row][vc_column width=”2/3″][vc_custom_heading text=”1 hr” use_theme_fonts=”yes”][vc_column_text]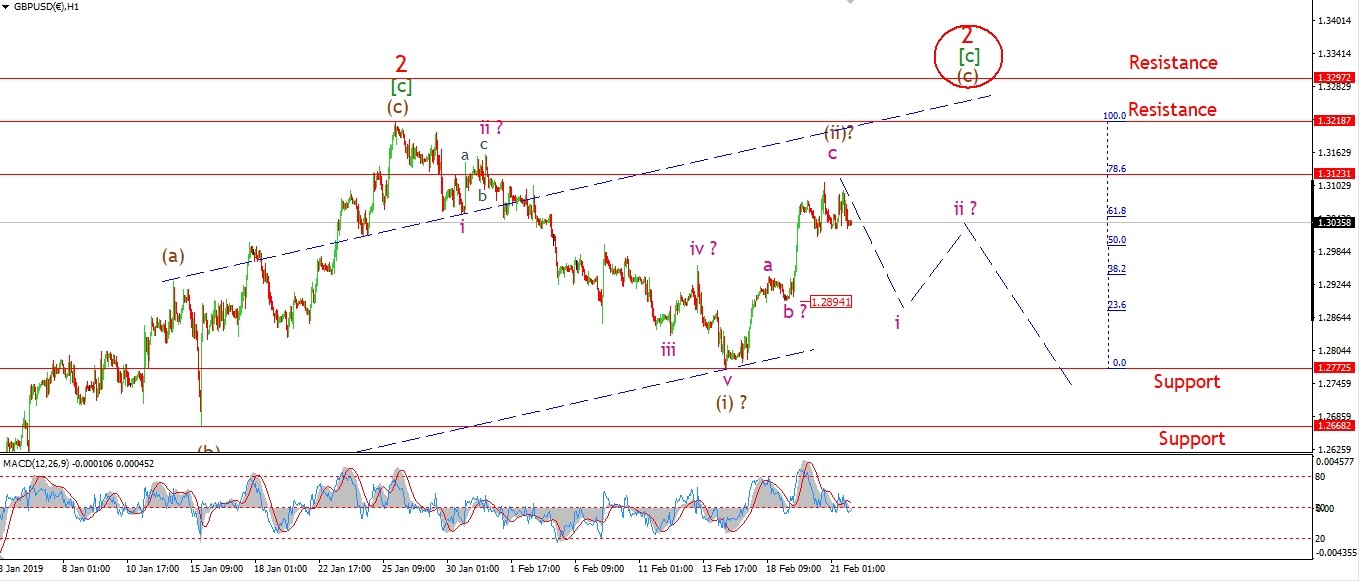 [/vc_column_text][/vc_column][vc_column width=”1/3″][vc_custom_heading text=”4 Hours” use_theme_fonts=”yes”][vc_column_text]
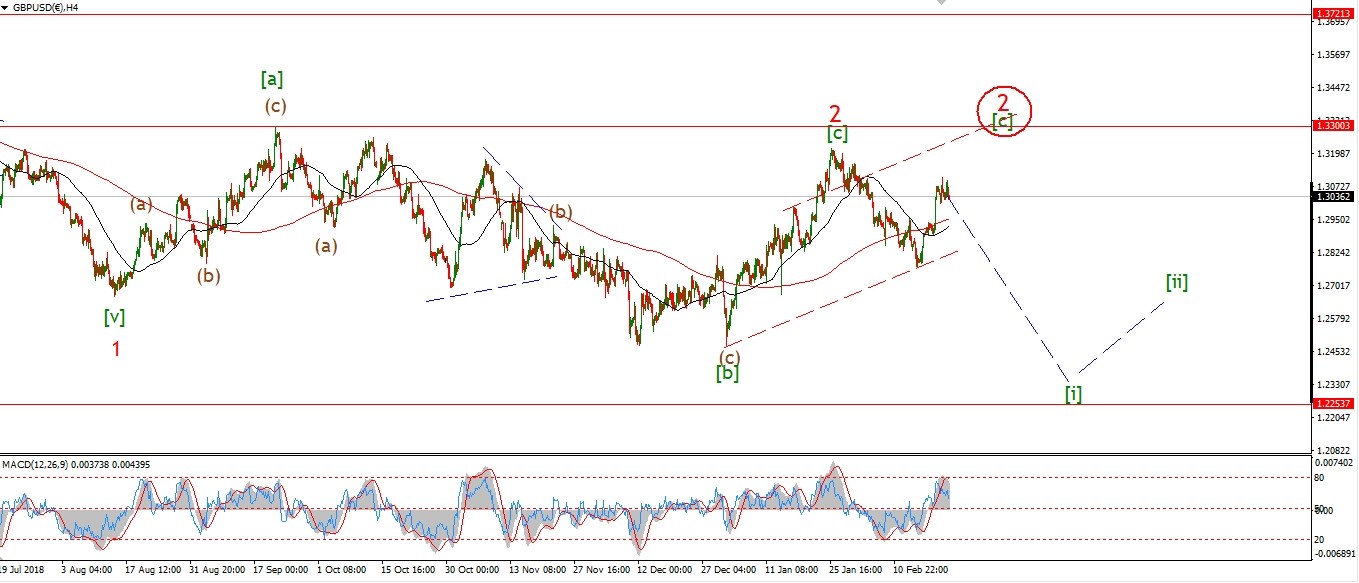 [/vc_column_text][vc_custom_heading text=”Daily” use_theme_fonts=”yes”][vc_column_text]
 [/vc_column_text][/vc_column][/vc_row]
[vc_row][vc_column][vc_column_text]
Cable has dropped off yesterdays highs today,
although the decline is weak so far.
I would like to see a break of that 1.2890 level labelled wave ‘b’
This would go a long way to ruling out the alternate count and signal that the market is turning lower in wave ‘i’ of (iii).
I have shown the alternate count on the 4hr chart tonight.
The central wave (b) is shown as a running flat
with wave (c) targeted to the upper trendline.
Tomorrow;
Watch for wave ‘i’ to continue lower to break 1.2894 and confirm the turn is in.
[/vc_column_text][/vc_column][/vc_row]
[/_s2If]
[_s2If current_user_can(access_s2member_ccap_usdjpy)]
[vc_row][vc_column][vc_separator border_width=”5″][/vc_column][/vc_row][vc_row][vc_column][vc_column_text]
USDJPY
[/vc_column_text][/vc_column][/vc_row][vc_row][vc_column][vc_separator border_width=”5″][/vc_column][/vc_row][vc_row][vc_column width=”2/3″][vc_custom_heading text=”1 hr” use_theme_fonts=”yes”][vc_column_text]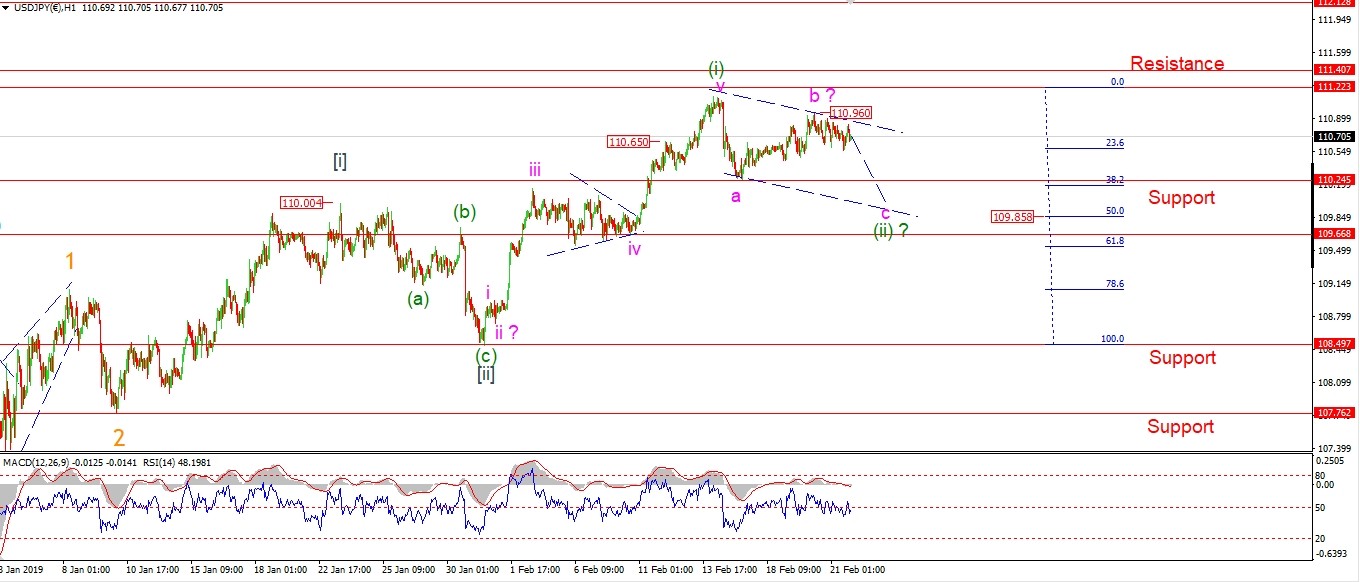 [/vc_column_text][/vc_column][vc_column width=”1/3″][vc_custom_heading text=”4 Hours” use_theme_fonts=”yes”][vc_column_text]
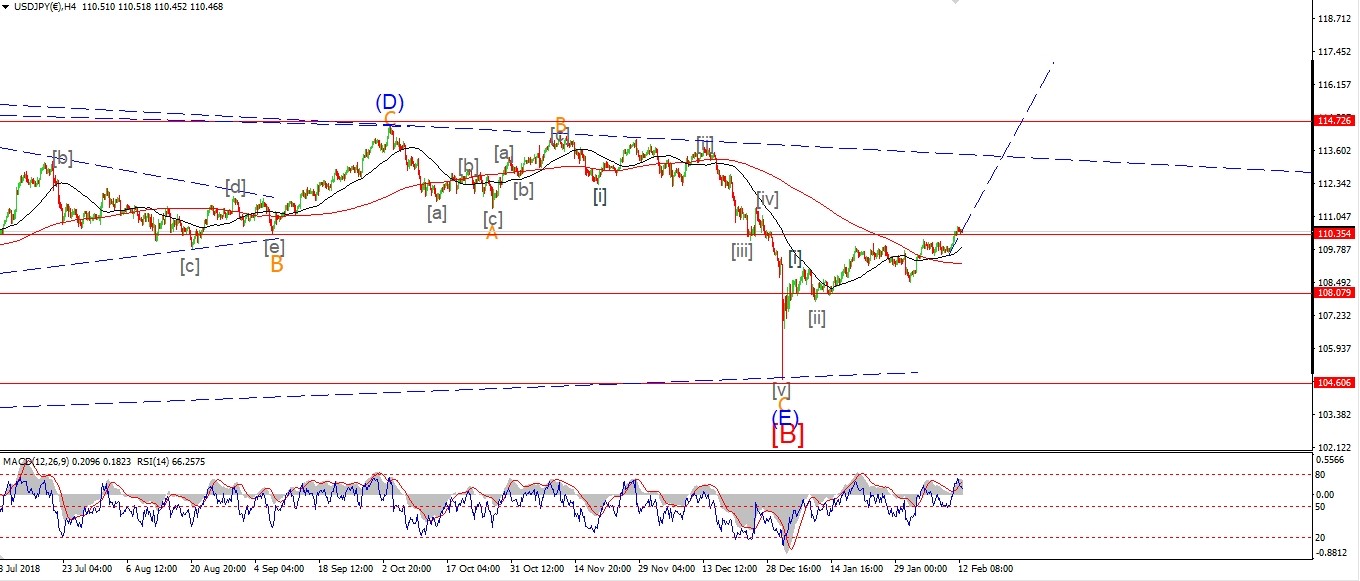 [/vc_column_text][vc_custom_heading text=”Daily” use_theme_fonts=”yes”][vc_column_text]
 [/vc_column_text][/vc_column][/vc_row]
[vc_row][vc_column][vc_column_text]
USDJPY is hanging on to the highs in wave ‘b’ so far today.
The action is corrective looking,
which does not favor a simple flat correction wave (ii).
we need to see a drop off in five waves to call this a flat.
So wave (ii) is more likely a complex flat, 3,3,3 formation.
The wave count still expects a drop in wave ‘c’
to complete wave (ii) with a minimum target of 110.24 at the wave ‘a’ low.
Tomorrow;
110.96 should continue to hold,
A three wave drop in wave ‘c’ would complete a complex wave (ii) below 110.24.
[/vc_column_text][/vc_column][/vc_row]
[/_s2If]
[_s2If current_user_can(access_s2member_ccap_dow_jones)]
[vc_row][vc_column][vc_separator border_width=”5″][/vc_column][/vc_row][vc_row][vc_column][vc_column_text]
DOW JONES INDUSTRIALS
[/vc_column_text][/vc_column][/vc_row][vc_row][vc_column][vc_separator border_width=”5″][/vc_column][/vc_row][vc_row][vc_column width=”2/3″][vc_custom_heading text=”1 hr” use_theme_fonts=”yes”][vc_column_text] [/vc_column_text][/vc_column][vc_column width=”1/3″][vc_custom_heading text=”4 Hours” use_theme_fonts=”yes”][vc_column_text]
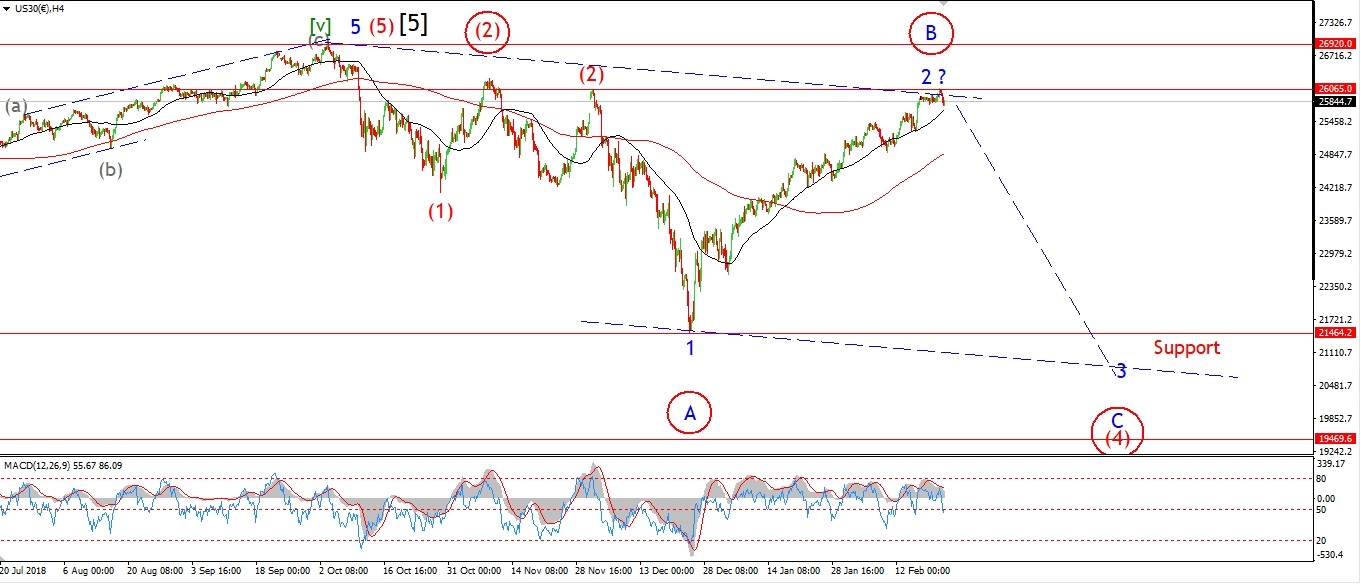 [/vc_column_text][vc_custom_heading text=”Daily” use_theme_fonts=”yes”][vc_column_text]
 [/vc_column_text][/vc_column][/vc_row]
[vc_row][vc_column][vc_column_text]
Todays decline is a start,
but we have a ways to go yet before wave (i) down can be confirmed.
Only a break of 24320 will confirm that the market has turned down in either wave ‘3’ or ‘C’.
While an Elliott wave signal will form before that
with a five wave decline in wave (i) and a three wave lower high in wave (ii).
The leaps data I showed earlier,
is commensurate with the most bearish interpretation of the current market pattern.
that is, a wave ‘2’ high with a large third wave down expected.
I am keeping wave ‘2’ as the main count.
With a little wiggle room allowed for the larger wave (2),
shown on the 4hr chart.
But it is a clear 50/50 between the wave ‘2’ or ‘B’ high.
Either way,
the next leg down should be pretty epic!
Tomorrow;
Lets see if we can continue this drop to complete a clear five waves down over the coming sessions.
[/vc_column_text][/vc_column][/vc_row]
[/_s2If]
[_s2If current_user_can(access_s2member_ccap_gold)]
[vc_row][vc_column][vc_separator border_width=”5″][/vc_column][/vc_row][vc_row][vc_column][vc_column_text]
GOLD
[/vc_column_text][/vc_column][/vc_row][vc_row][vc_column][vc_separator border_width=”5″][/vc_column][/vc_row][vc_row][vc_column width=”2/3″][vc_custom_heading text=”1 hr” use_theme_fonts=”yes”][vc_column_text]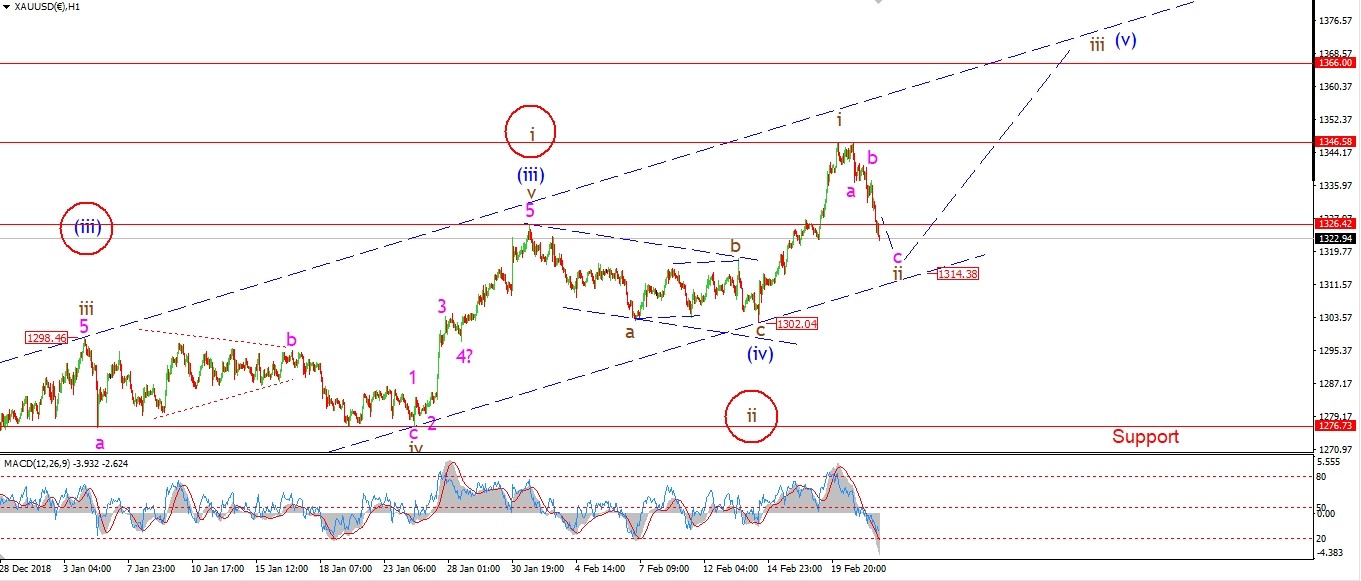 [/vc_column_text][/vc_column][vc_column width=”1/3″][vc_custom_heading text=”4 Hours” use_theme_fonts=”yes”][vc_column_text]
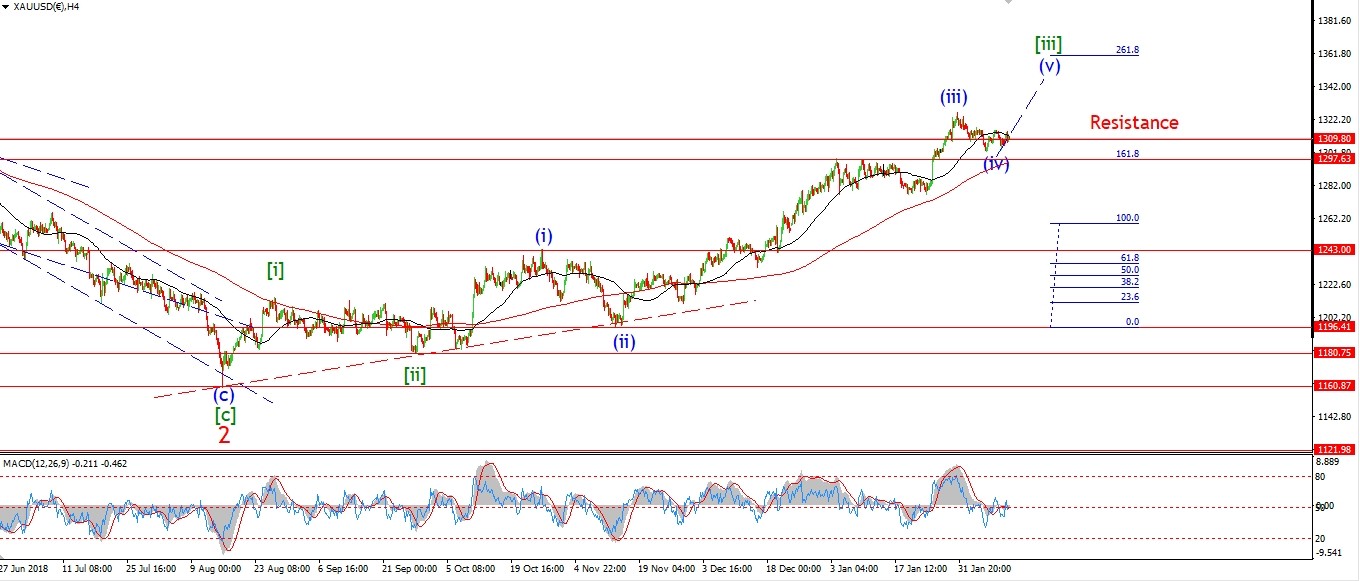 [/vc_column_text][vc_custom_heading text=”Daily” use_theme_fonts=”yes”][vc_column_text]
 [/vc_column_text][/vc_column][/vc_row]
[vc_row][vc_column][vc_column_text]
Gold continued lower in wave ‘ii’ today,
with a possible wave ‘a’ and ‘b’ complete.
Wave ‘c’ of ‘ii’ has dropped to initial support at 1326.
We have three waves in play,
but the decline does not look complete yet.
The lower trend channel line at 1314 is more likely now.
Tomorrow;
watch for wave ‘c’ of ‘ii’ to complete at about 1314.
A break of 1346 again will confirm wave ‘iii’ up has begun.
[/vc_column_text][/vc_column][/vc_row]
[/_s2If]
[_s2If current_user_can(access_s2member_ccap_crude)]
[vc_row][vc_column][vc_separator border_width=”5″][/vc_column][/vc_row][vc_row][vc_column][vc_column_text]
U.S CRUDE OIL
[/vc_column_text][/vc_column][/vc_row][vc_row][vc_column][vc_separator border_width=”5″][/vc_column][/vc_row][vc_row][vc_column width=”2/3″][vc_custom_heading text=”1 hr” use_theme_fonts=”yes”][vc_column_text]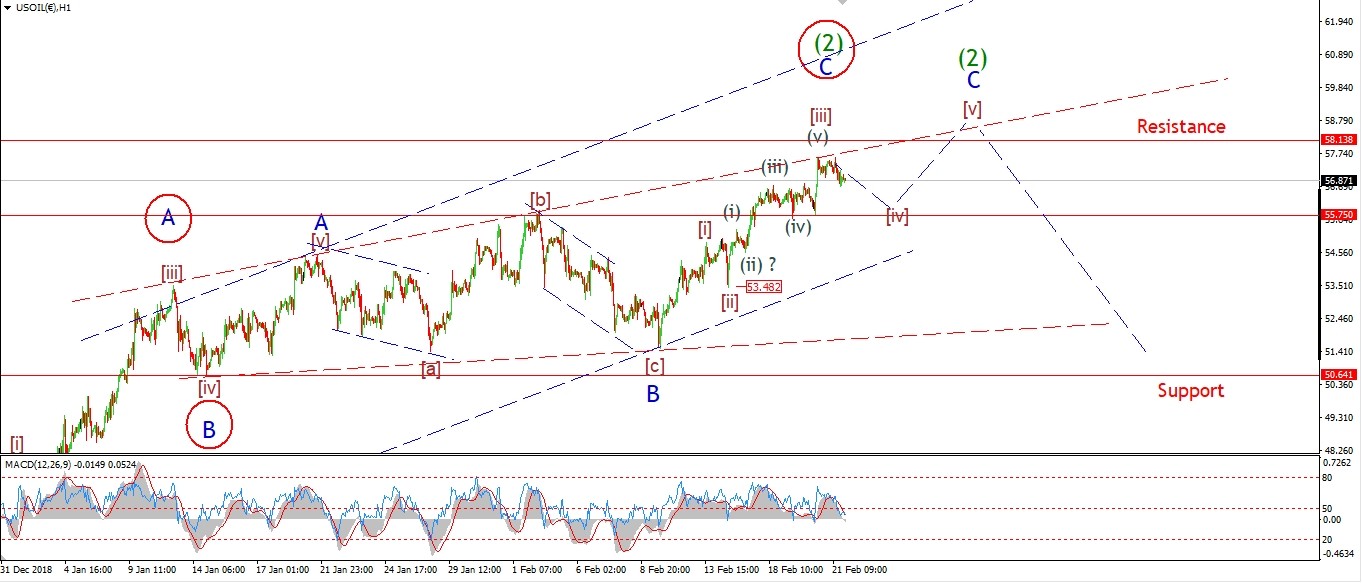 [/vc_column_text][/vc_column][vc_column width=”1/3″][vc_custom_heading text=”4 Hours” use_theme_fonts=”yes”][vc_column_text]
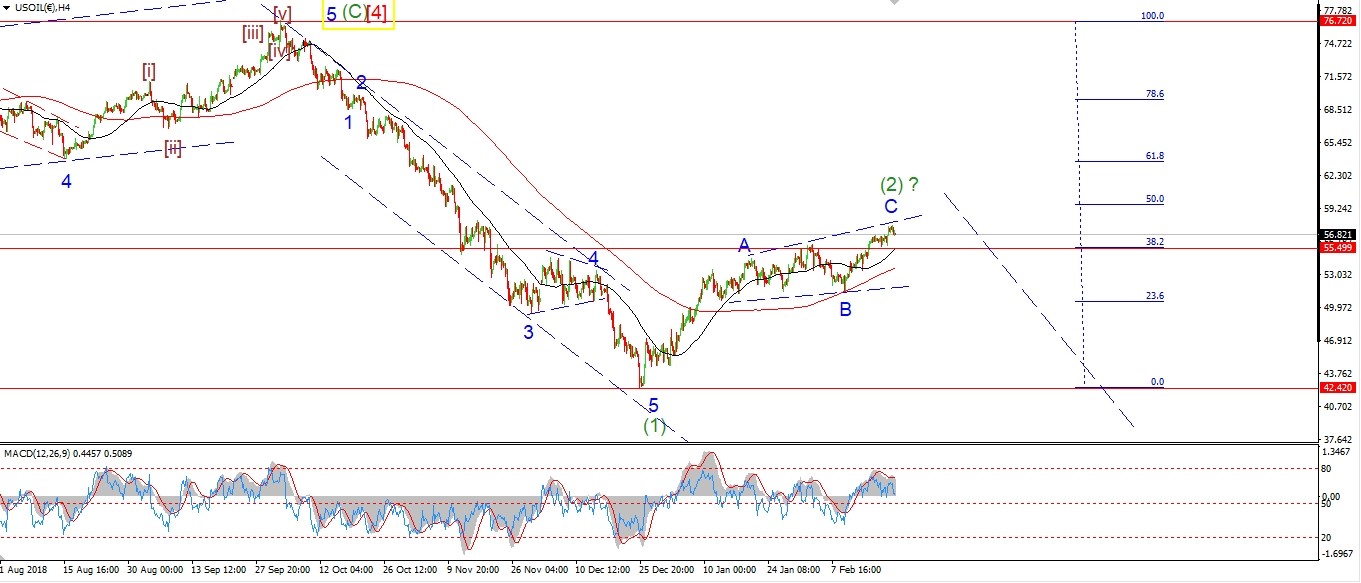 [/vc_column_text][vc_custom_heading text=”Daily” use_theme_fonts=”yes”][vc_column_text]
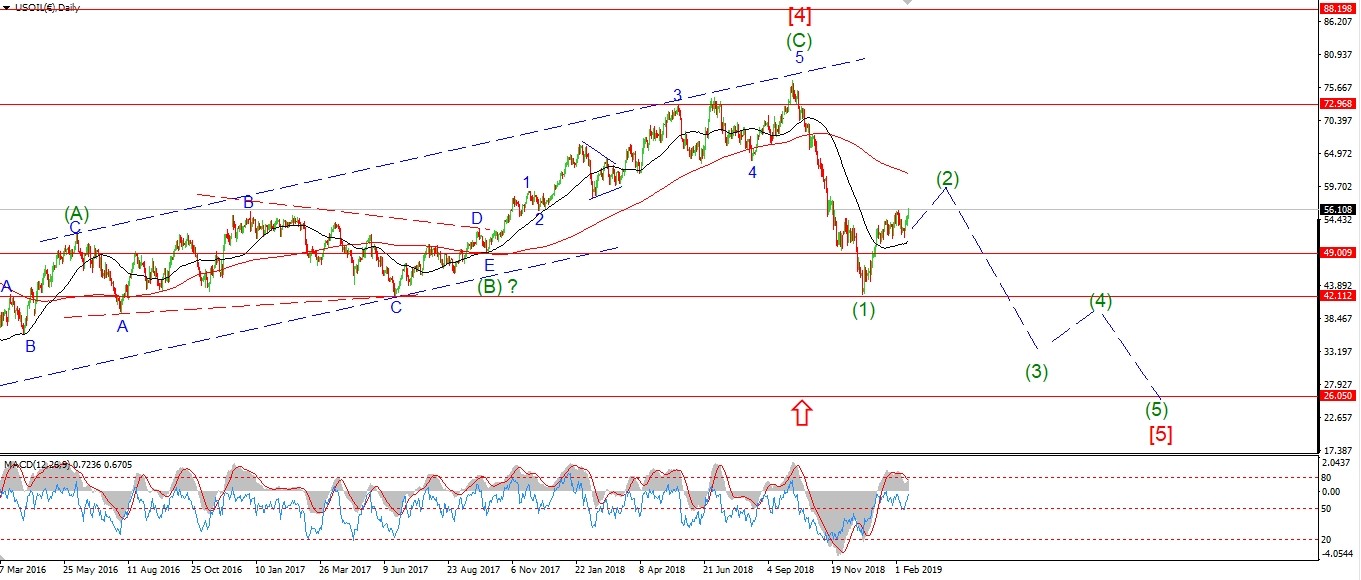 [/vc_column_text][/vc_column][/vc_row]
[vc_row][vc_column][vc_column_text]
The price has so far corrected off the recent high in three waves.
This drop is labelled as wave [iv] of ‘C’,
with a further high expected for wave [v] of ‘C’ if this pattern plays out.
Interestingly enough,
the rally in wave ‘C’ has reached 50% the length of the wave ‘A’ at this weeks highs.
This is a reasonable relationship between both waves.
So I would not be at all surprised if the price turns lower into wave (3) sooner rather than later.
If the price does turn down again and break 53.48,
this will signal that wave (2) is done and wave (3) down has begun.
Tomorrow;
Watch for support to hold at 55.70 again as wave [iv] completes.
[/vc_column_text][/vc_column][/vc_row]
[/_s2If]
[_s2If current_user_can(access_s2member_ccap_us10yr)]
[vc_row][vc_column][vc_separator border_width=”5″][/vc_column][/vc_row][vc_row][vc_column][vc_column_text]
US 10 yr Treasuries.
[/vc_column_text][/vc_column][/vc_row][vc_row][vc_column][vc_separator border_width=”5″][/vc_column][/vc_row][vc_row][vc_column width=”2/3″][vc_custom_heading text=”1 hr” use_theme_fonts=”yes”][vc_column_text]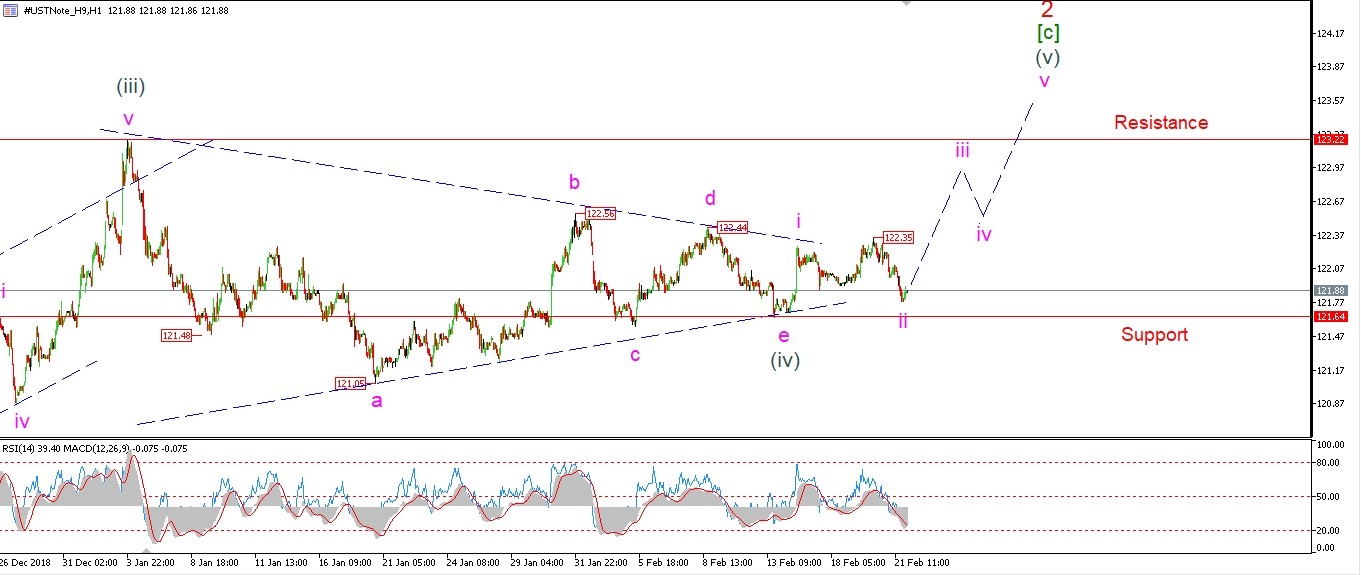 [/vc_column_text][/vc_column][vc_column width=”1/3″][vc_custom_heading text=”4 Hours” use_theme_fonts=”yes”][vc_column_text]
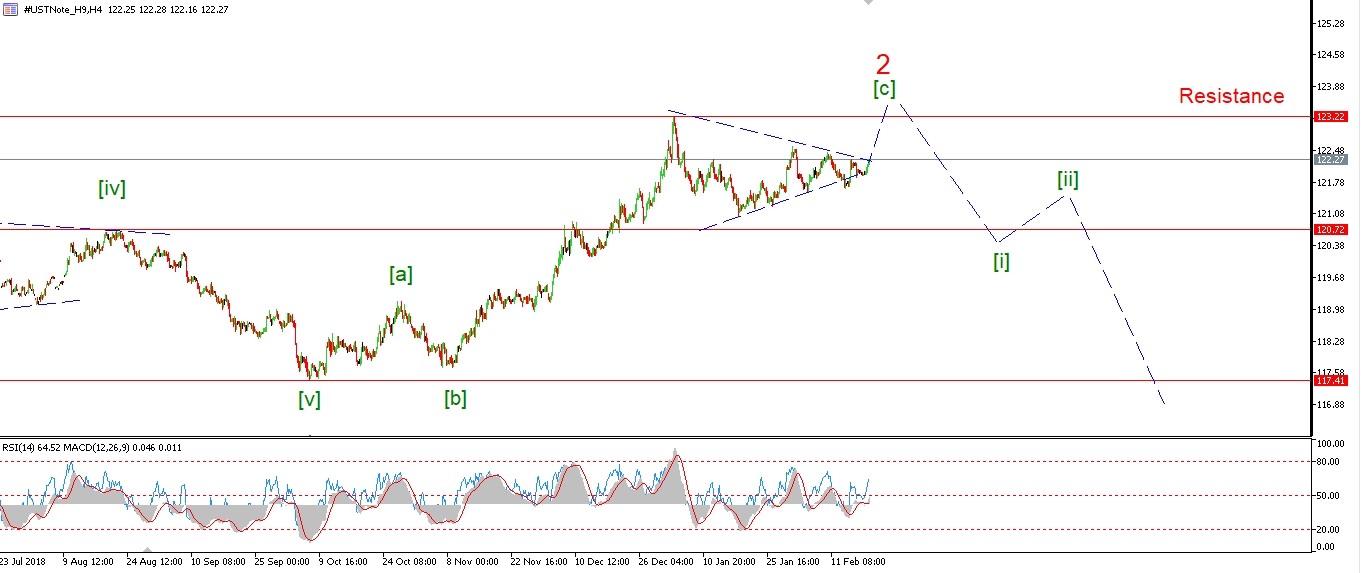 [/vc_column_text][vc_custom_heading text=”Daily” use_theme_fonts=”yes”][vc_column_text]
 [/vc_column_text][/vc_column][/vc_row]
[vc_row][vc_column][vc_column_text]
After expecting a rally in wave ‘iii’ of (v) today,
todays decline came as a surprise!
It is possible that wave ‘ii’ is completing as a flat.
A return higher with a break of 122.35 will confirm that view.
121.64 must hold to stay with the current count.
The fact that the market continues to make lower highs is perking my interest a bit.
Is this a series of smaller 1,2 waves off the high?
We will see soon enough.
Tomorrow;
A break of 121.64 will rule out the current count.
Watch for wave ‘ii’ to find a low above that level
and then turn higher in wave ‘iii’ of (v).
[/vc_column_text][/vc_column][/vc_row]
[/_s2If]
[_s2If current_user_can(access_s2member_ccap_silver)]
[vc_row][vc_column][vc_separator border_width=”5″][/vc_column][/vc_row][vc_row][vc_column][vc_column_text]
SILVER
[/vc_column_text][/vc_column][/vc_row][vc_row][vc_column][vc_separator border_width=”5″][/vc_column][/vc_row][vc_row][vc_column width=”2/3″][vc_custom_heading text=”1 hr” use_theme_fonts=”yes”][vc_column_text]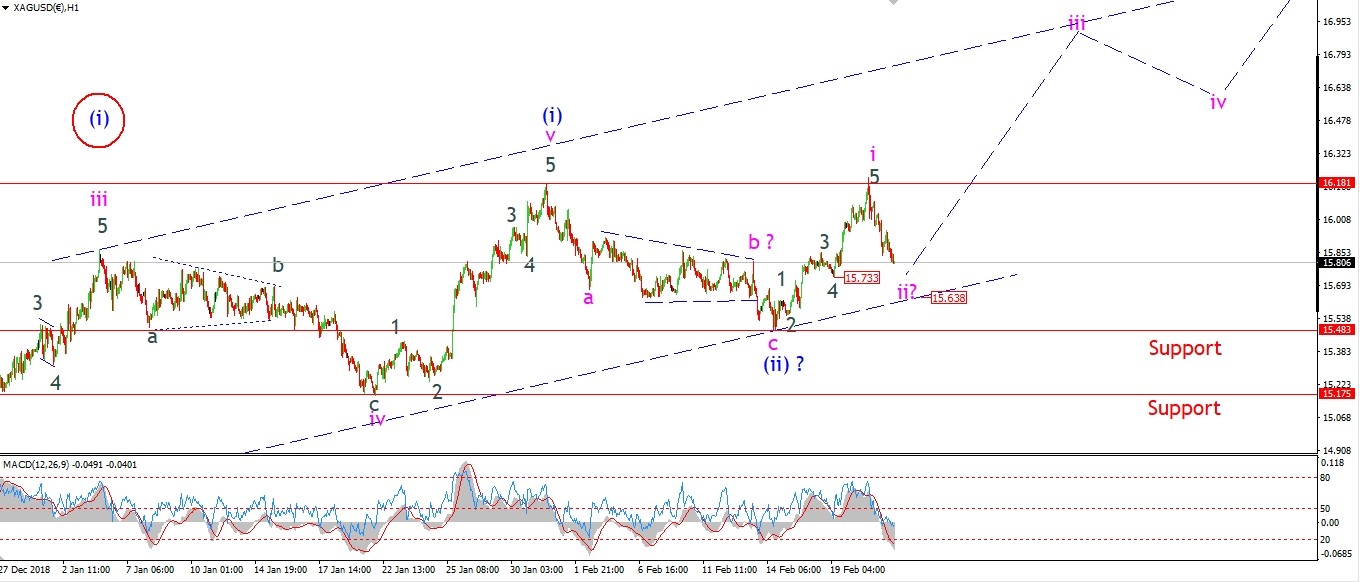 [/vc_column_text][/vc_column][vc_column width=”1/3″][vc_custom_heading text=”4 Hours” use_theme_fonts=”yes”][vc_column_text]
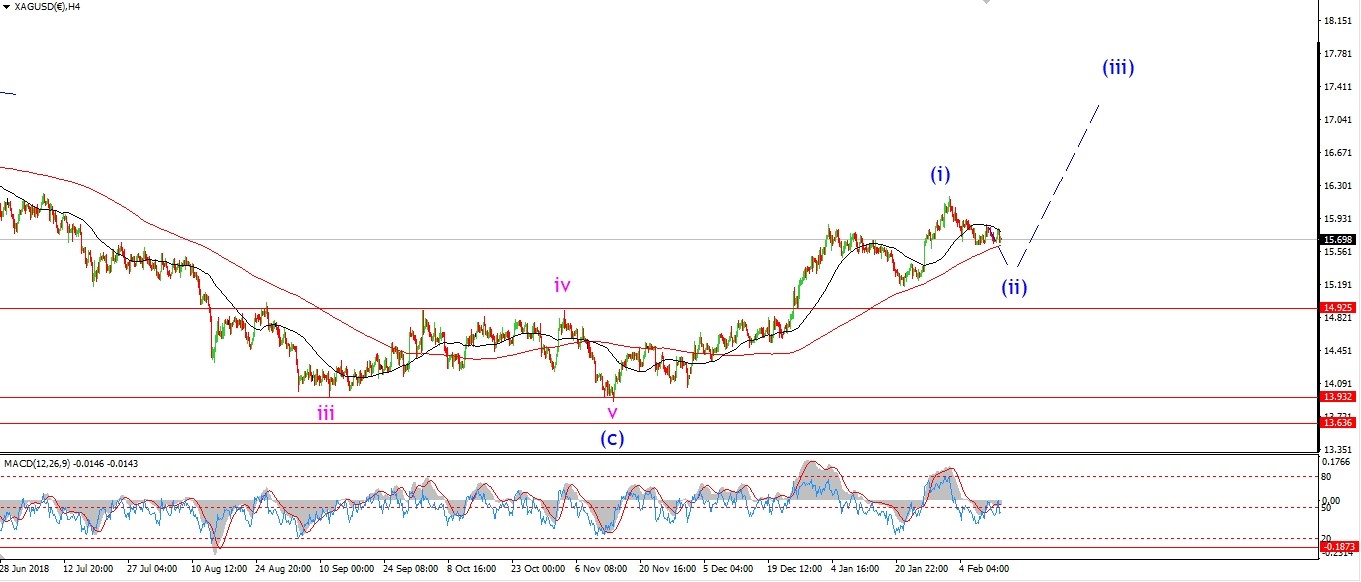 [/vc_column_text][vc_custom_heading text=”Daily” use_theme_fonts=”yes”][vc_column_text]
 [/vc_column_text][/vc_column][/vc_row]
[vc_row][vc_column][vc_column_text]
Price has hit the 15.80 wave ‘b’ high this evening.
It is hard to make out the pattern of wave ‘ii’
but I can’t make out three waves down yet,
so we need a little more downside I think to complete wave ‘ii’.
The previous wave ‘4’ comes in at 15.73,
the price could find support there also.
Tomorrow;
Watch for wave ‘ii’ to complete between 15.73 and 15.63 at the lower trend channel line.
[/vc_column_text][/vc_column][/vc_row]
[/_s2If]
[_s2If current_user_can(access_s2member_ccap_sp500)]
[vc_row][vc_column][vc_separator border_width=”5″][/vc_column][/vc_row][vc_row][vc_column][vc_column_text]
S&P 500.
[/vc_column_text][/vc_column][/vc_row][vc_row][vc_column][vc_separator border_width=”5″][/vc_column][/vc_row][vc_row][vc_column width=”2/3″][vc_custom_heading text=”1 hr” use_theme_fonts=”yes”][vc_column_text] [/vc_column_text][/vc_column][vc_column width=”1/3″][vc_custom_heading text=”4 Hours” use_theme_fonts=”yes”][vc_column_text]
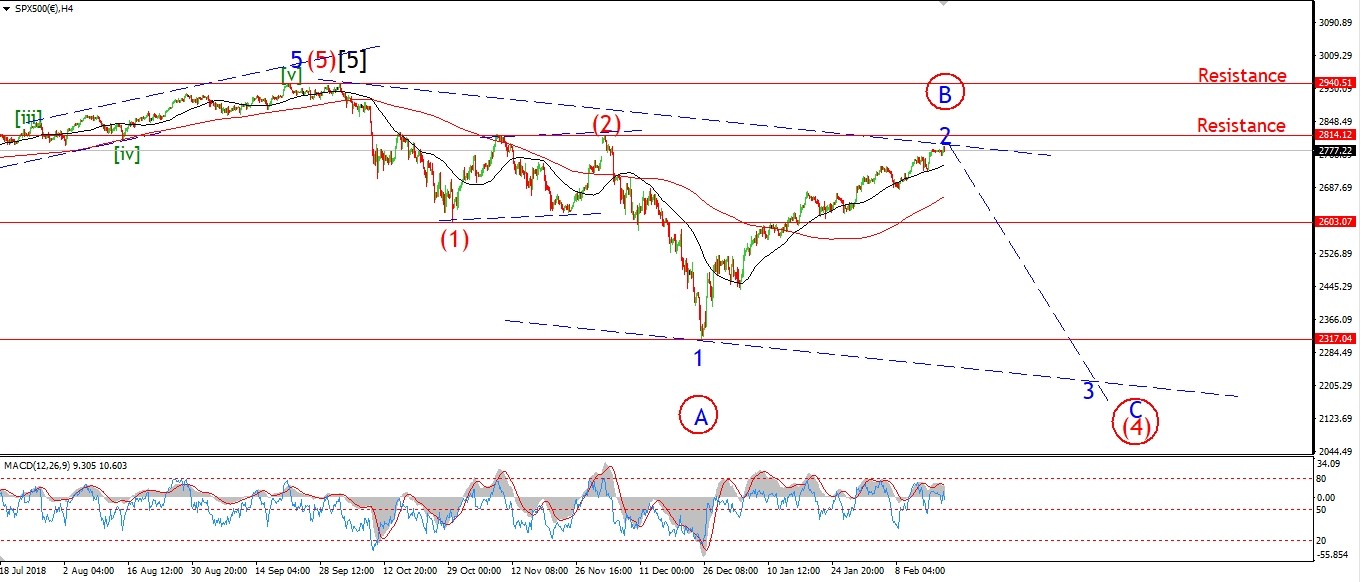 [/vc_column_text][vc_custom_heading text=”Daily” use_theme_fonts=”yes”][vc_column_text]
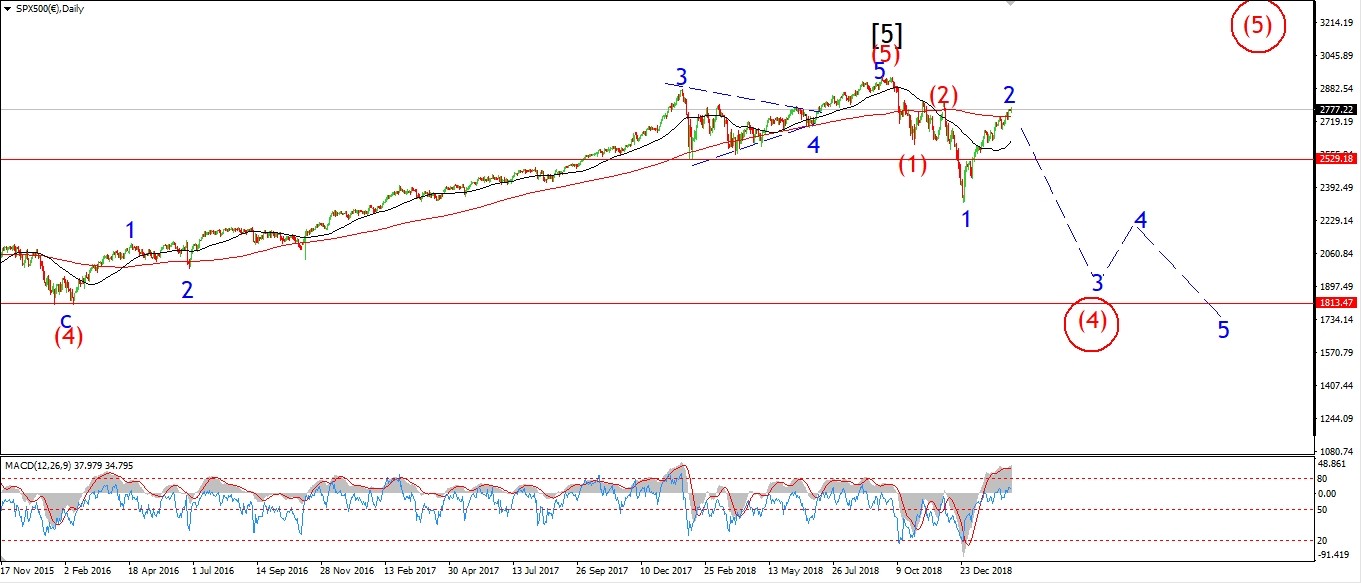 [/vc_column_text][/vc_column][/vc_row]
[vc_row][vc_column][vc_column_text]
The S&P did reach that upper trendline of the ending diagonal today
before turning lower in a possible five wave decline.
I think a break of 2675 over the coming week will signal that the market is turning lower for the longer term.
A break of 2629 will confirm it.
As that will break the wave (iv) low
and in turn, rule out an impulse pattern off that wave (iv) low.
But it is early days and I am getting ahead of myself!
I am glad that the market held below 2816 and the wave ‘2’ interpretation is still safe for now.
But we must see this decline develop into something bigger first.
Tomorrow;
I wonder if waves ‘i’ and ‘ii’ have already completed off the high.
If the price lurches lower tomorrow,
that will signal a third wave down.
A break of 2728 will be a step in the right direction.
[/vc_column_text][/vc_column][/vc_row]
[/_s2If]
[vc_row][vc_column][vc_column_text]
[/vc_column_text][/vc_column][/vc_row]
[vc_row][vc_column][vc_separator border_width=”5″][/vc_column][/vc_row]