
Good evening to one and all.
The Lord’s Blessing’s to you all again tonight.
Monday the 20th is a public holiday in the U.S so the markets will be closed and as a result, I will be closed also, so Tuesday will be the first update next week.
https://twitter.com/bullwavesreal
EURUSD.
EURUSD 1hr.
EURUSD 4hr.

EURUSD daily.
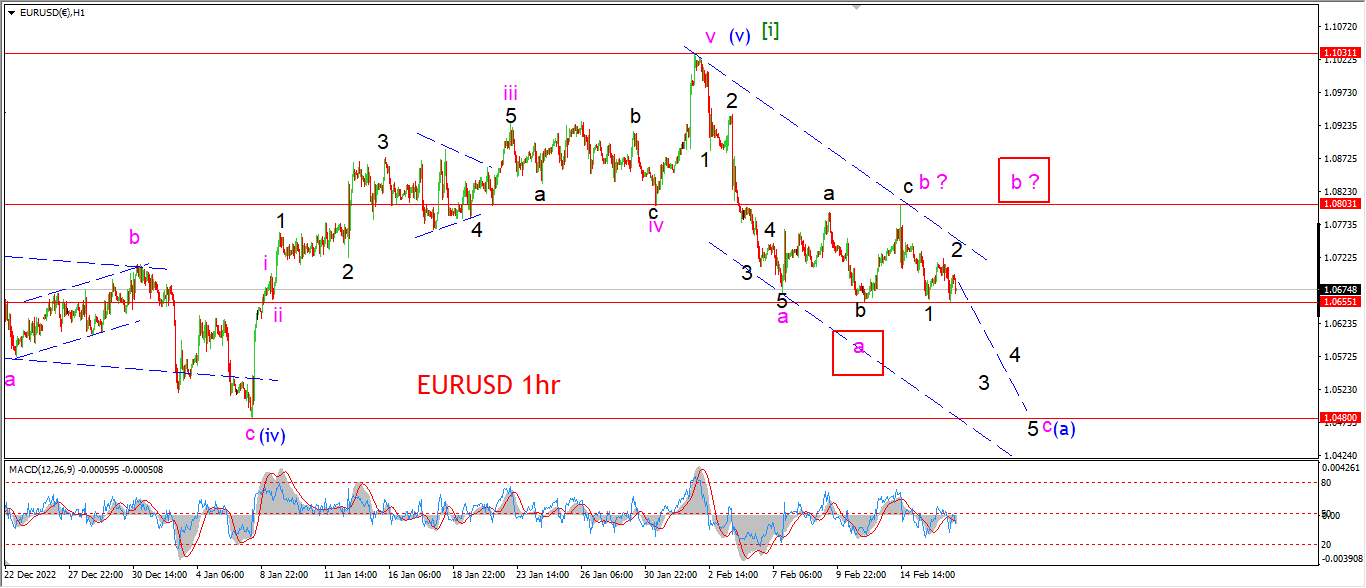
Even though the price is holding at the lows of the week tonight,
I am still concerned that we will see a rally to trigger the alternate wave ‘b’ count.
The fact that wave ‘c’ of (a) has not accelerated lower today is a hint that something else may be brewing here for wave ‘b’.
At the moment, I am willing to give the count for wave ‘c’ another day to see if a further decline begins as suggested.
Tomorrow;
Wave ‘c’ of (a) will be confirmed if we see a break below 1.0650 again.
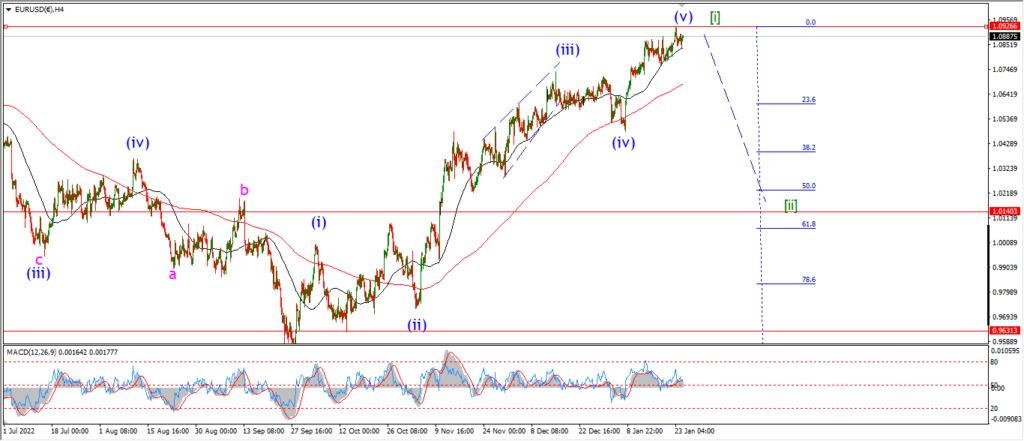
The decline should continue towards 1.05 again to complete three waves down in wave (a).
GBPUSD
GBPUSD 1hr.
GBPUSD 4hr.

GBPUSD daily.
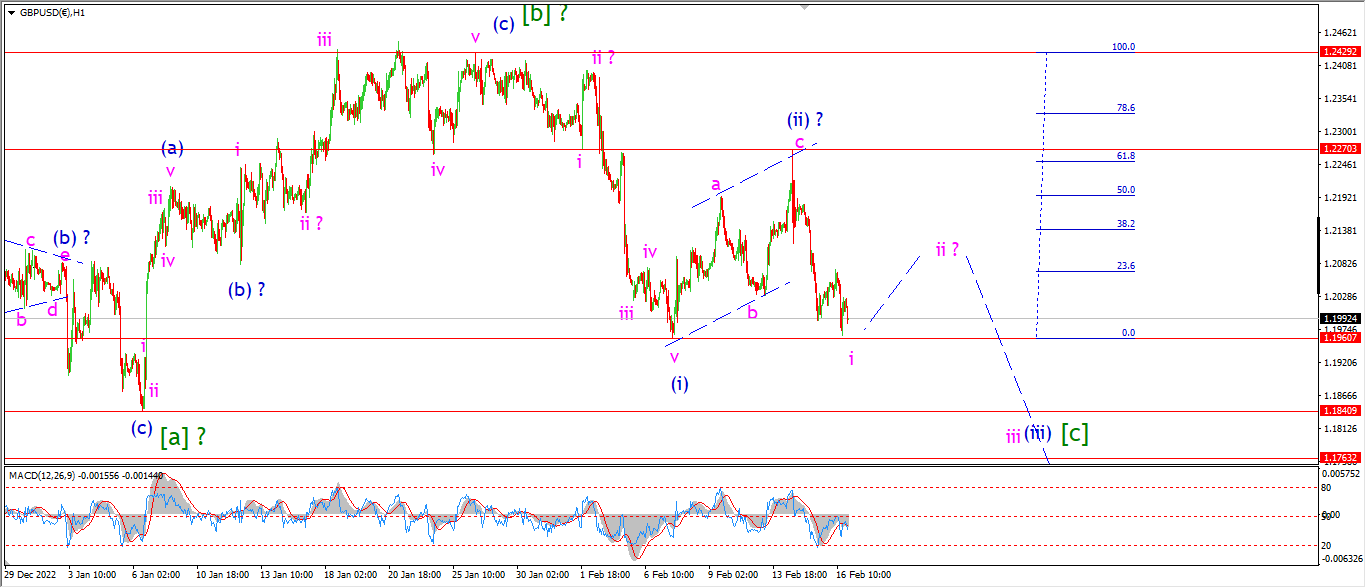
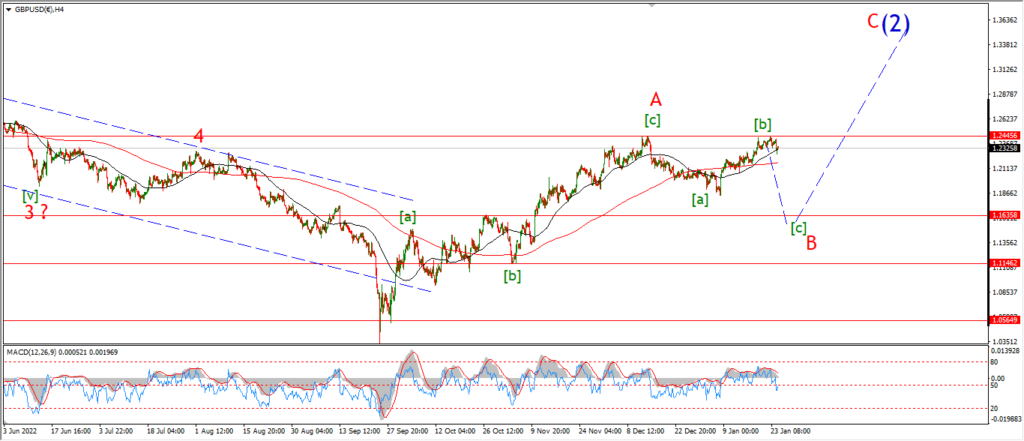
We do have a five wave pattern in place now off that wave (ii) high.
So the probability that wave (iii) is underway is quite high.
The only issue I have here is that wave (i) blue has not been broken yet.
It would be better to see a break of that level to be sure that wave (iii) has started.
But so far so good.
Tomorrow;
if wave ‘i’ of (iii) is now complete at today’s lows,
then we should see a correction higher in three waves in wave ‘ii’ beginning now.
Watch for correction action to move higher in wave ‘ii’ with a target near the 1.2150 area.
USDJPY.
USDJPY 1hr.
USDJPY 4hr.

USDJPY daily.
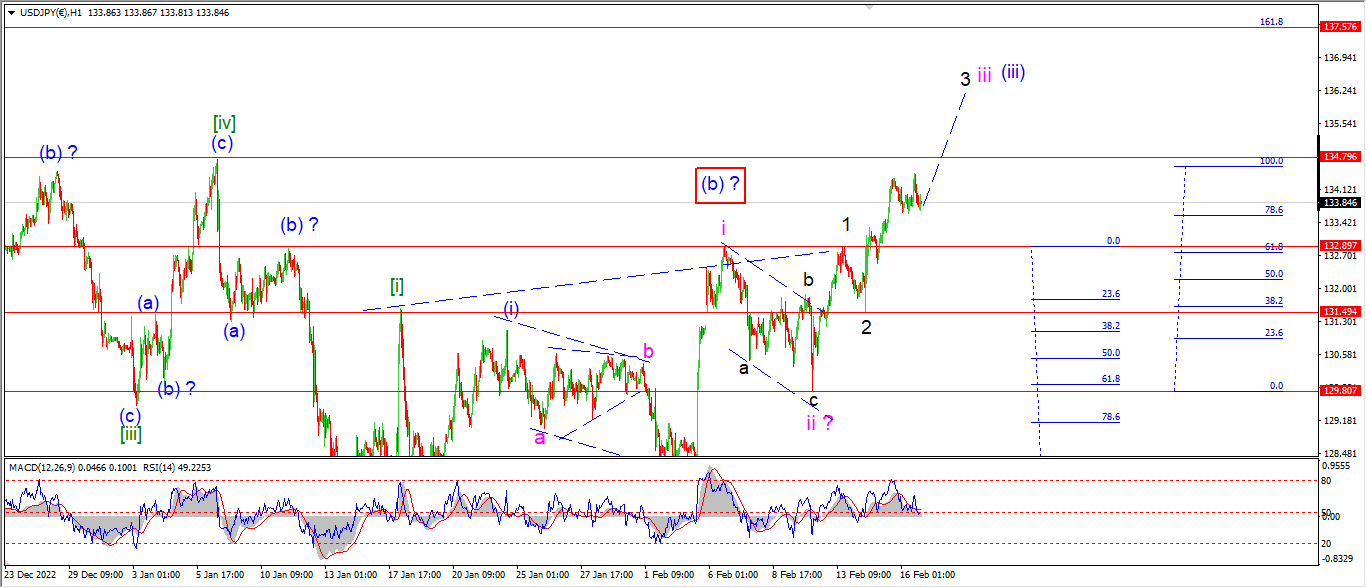
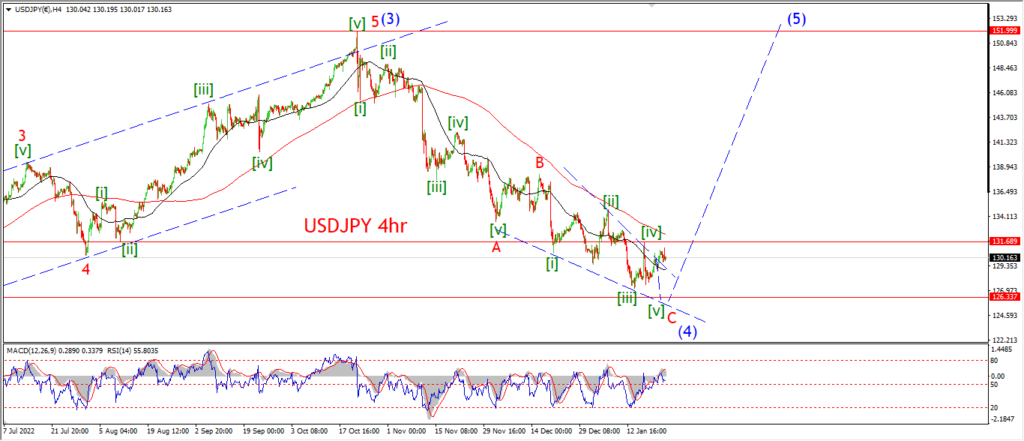
The action today is holding near the highs of the rebound rally and is quite corrective looking overall.
I am suggesting that today’s sideways move is a small three wave correction within wave ‘3’ of ‘iii’.
And if this is correct,
then we should see a rally resume from here to complete wave ‘3’ of ‘iii’ above 135.00.
If the price drops below 132.90 again then I will have to reconsider this count.
But for the moment,
I think we can continue to look higher in wave ‘3’ of ‘iii’.
Tomorrow;
132.90 must hold.
Wave ‘3’ should complete five waves up with a break of 135.00 again.
DOW JONES.
DOW 1hr.
DOW 4hr
DOW daily.
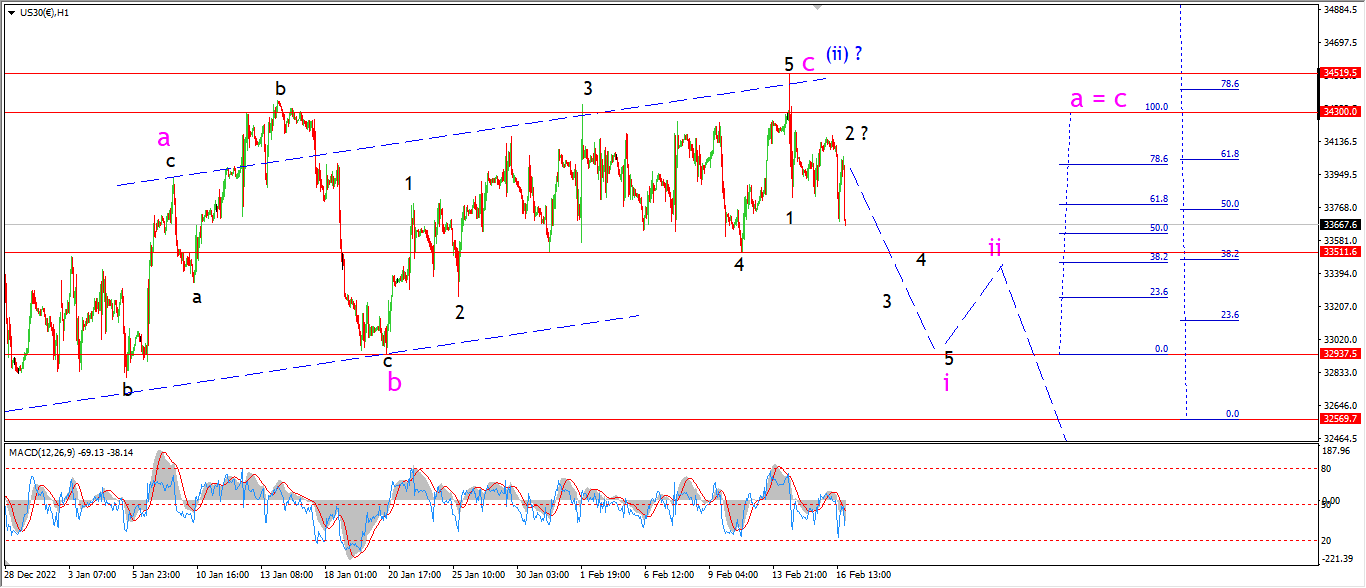
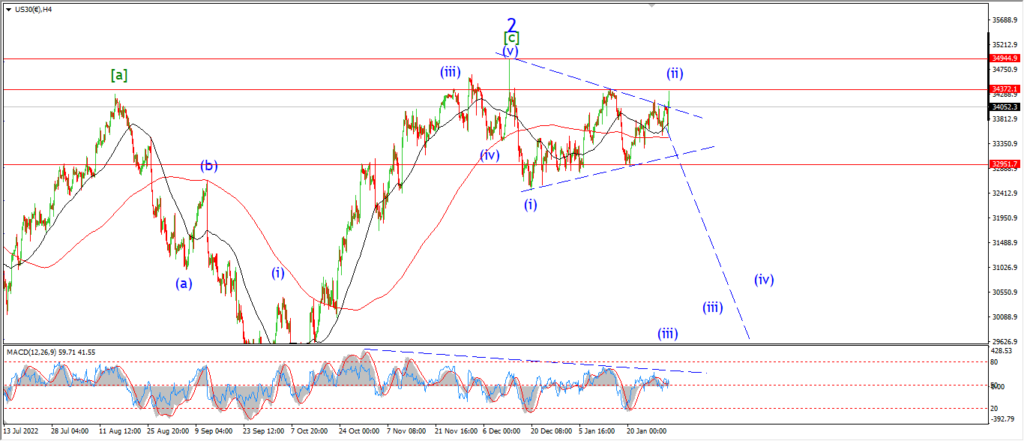
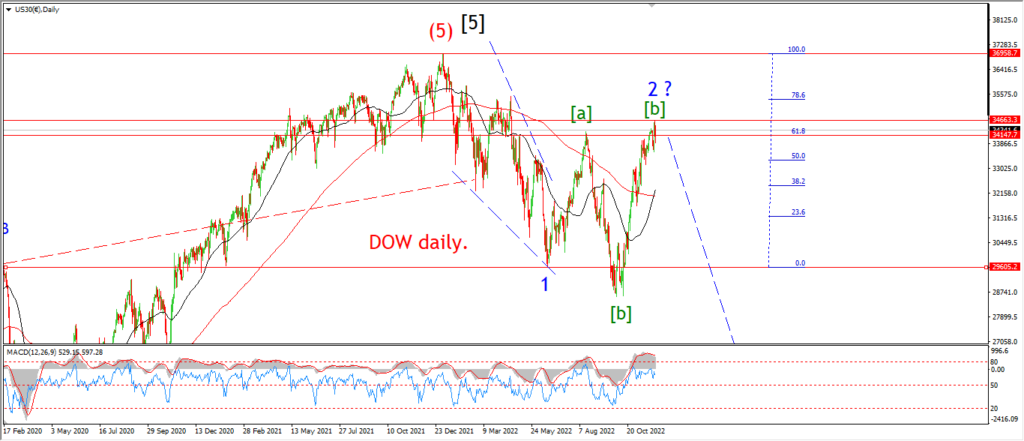
A sharp drop and rebound today, is just continuing the range bound trade that has been in force since the beginning of the year.
The market has actually traded basically flat since January 27th,
But while this has been a frustrating and boring market overall this month,
now there is something interesting happening this week.
The market has now put in two consecutive lower highs this week and the close this evening is again weaker.
Also we have a series of sharp moves to the downside again which is reversing a previous trend from the last few weeks.
The wave count has been hard to pin down over the last few weeks,
but I am looking now at the possibility of an initial impulsive drop in wave ‘1’ black,
followed by a running flat correction in wave ‘2’ today.
If this count is correct here,
then we should see a turn lower again tomorrow into wave ‘3’ of ‘i’ as shown.
Tomorrow;
Watch for wave ‘3’ to fall and break support at 33500 again.
If that happens I will be much happier about the bearish possibilities here.
GOLD
GOLD 1hr.
GOLD 4hr.

GOLD daily.
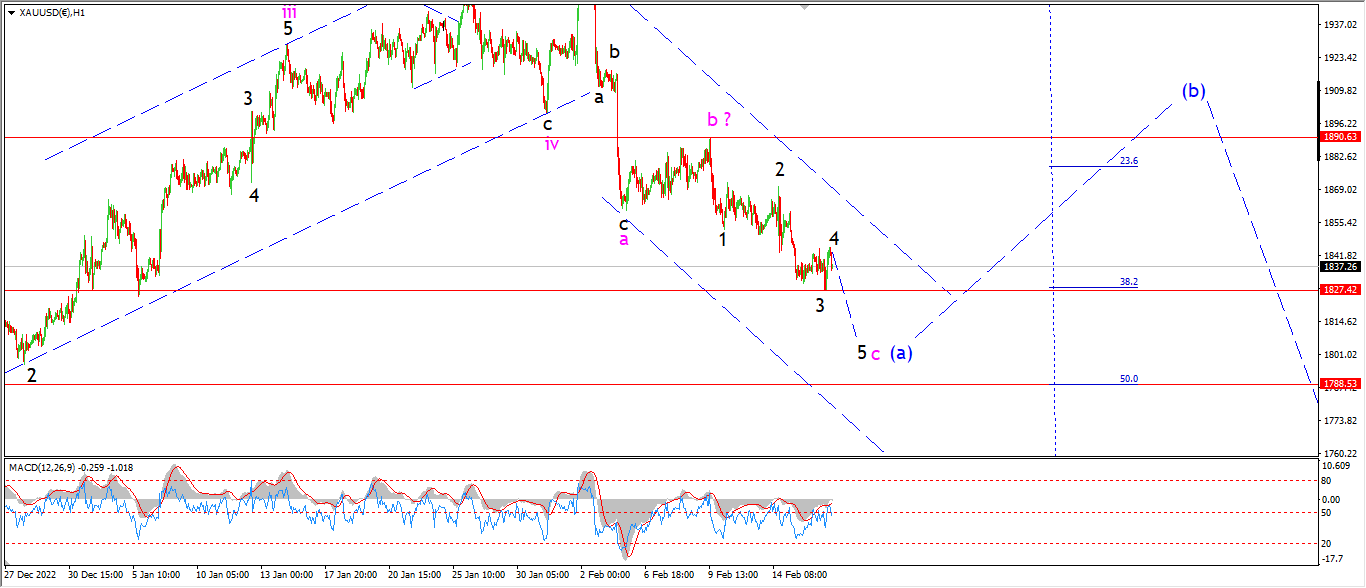
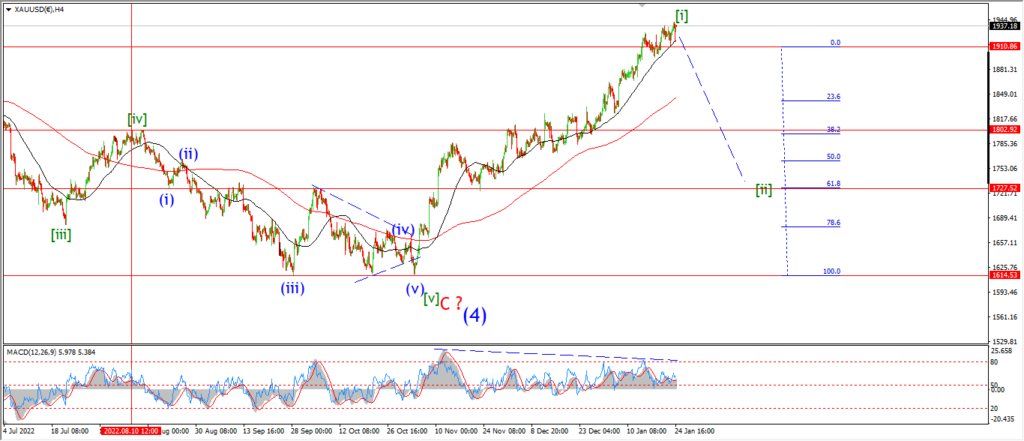
I am trimming down my expectations for wave ‘c’ this evening,
the price has failed to accelerate lower as expected in wave ‘c’.
But I am looking at another possibility here.
There is a five wave pattern developing lower now and it may simply be a wedge pattern playing out in wave ‘5’.
The slowing downside momentum is a result of this pattern.
One more drop below 1827 again will complete wave ‘c’ of (a).
and then next week we can look for a correction higher to begin in wave (b).
Tomorrow;
Watch for wave ‘5’ of ‘c’ to fall below 1827 to complete the pattern off the top for wave (a).
CRUDE OIL.
CRUDE OIL 1hr.
CRUDE OIL 4hr.
CRUDE OIL daily.
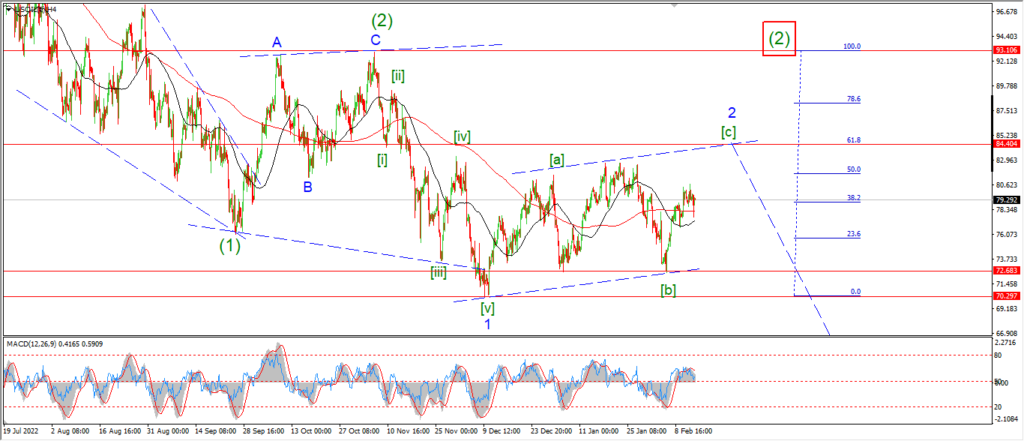
My first thought tonight is what a slow day in the markets it has been!
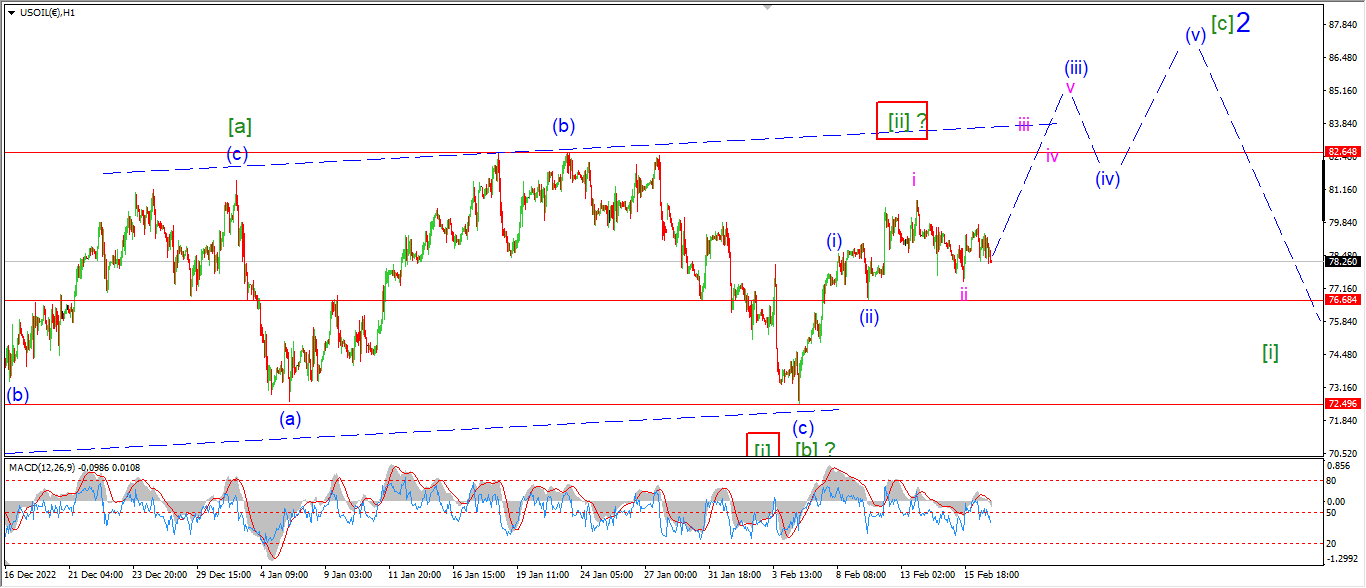
There is very little to add here apart from the fact that crude is pretty flat today.
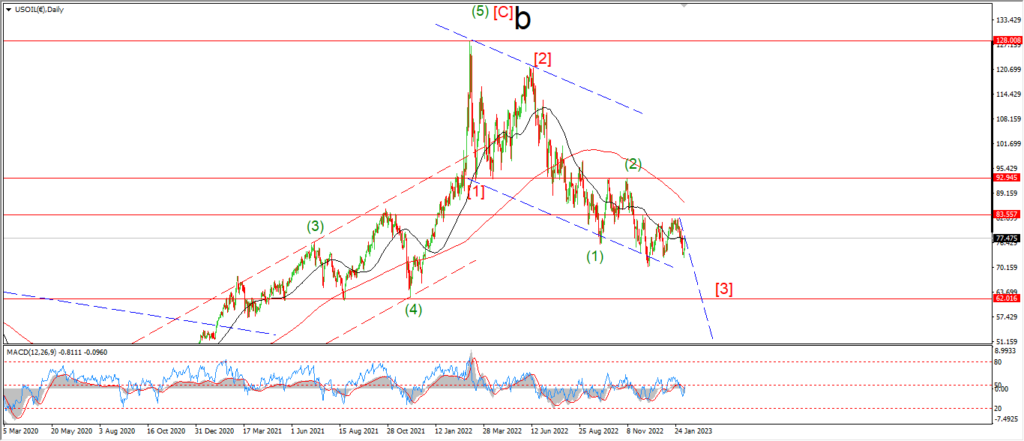
The price is still holding above the wave (ii) low at 76.68 so the main count is holding for now.
But I have to say there is very little in today’s action that backs up the idea of an acceleration higher in wave (iii) of [c] now.
We will see soon enough,
but if that support level breaks at wave (ii),
then I will be forced to think again about this wave ‘2’ count.
We are at one of those ‘make or break’ moments for this pattern.
Tomorrow;
Watch for wave (ii) to hold at 76.68.
Wave ‘iii’ of (iii) must turn higher tomorrow to confirm this count.
A failure to do so will be a blow to this short term pattern.
S&P 500.
S&P 500 1hr
S&P 500 4hr
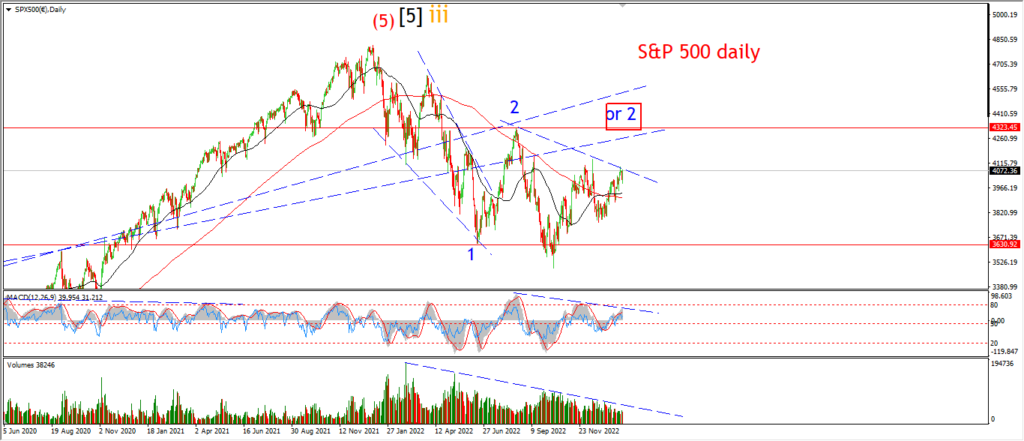
S&P 500 daily.
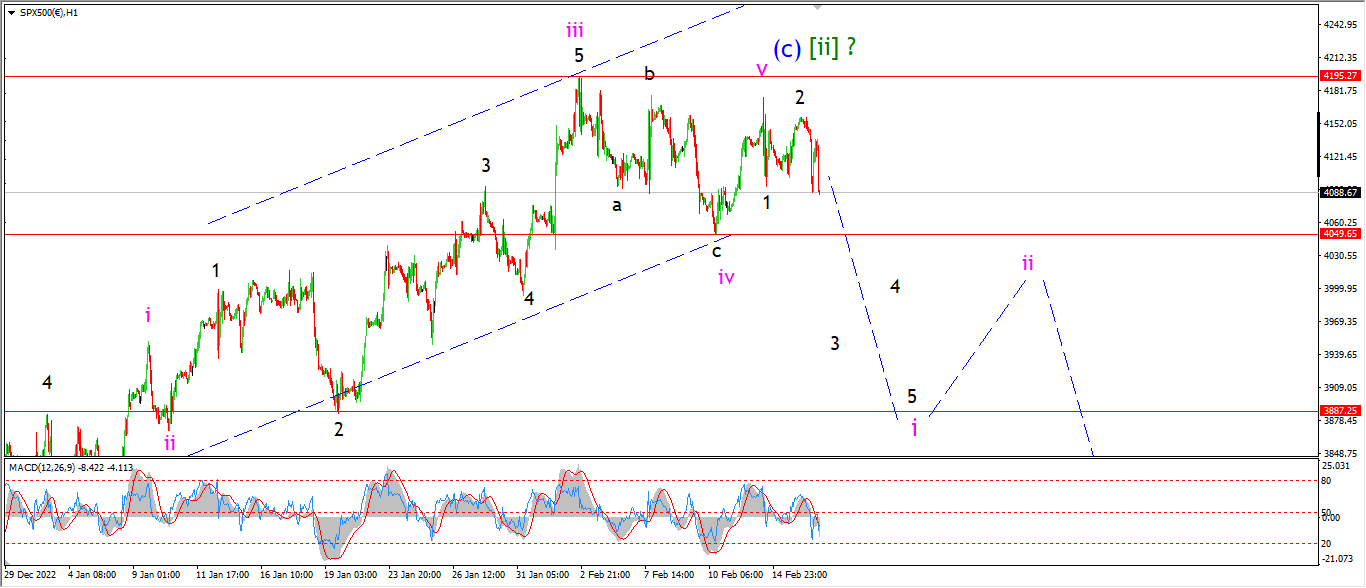
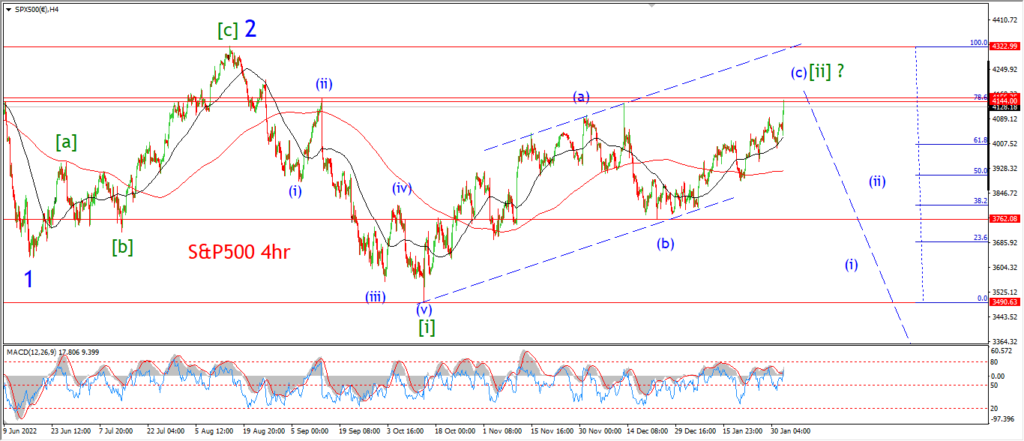
The main pattern on the hourly chart is a complicated one for sure,
the very fact that I am suggesting a failed fifth wave to top out wave [ii] at a lower high is……
Let’s say,
non-standard at the very least.
Some might say that idea is stupid.
I am willing to be proved wrong on this.
After an initial spike lower in wave ‘1’ black,
then wave ‘2’ traced out three waves up and created a lower high yesterday evening.
That pattern is being reinforced this evening with another sharp drop into the close.
So for the moment the short term pattern for wave [ii] is holding.
The price really needs to start breaking support levels in order to confirm that the top is in here for wave [ii].
I am looking for a break of wave ‘iv’ pink at 4049 again to boost the probability of this count here.
And I would like to see wave ‘i’ pink retrace most of the rally we saw in wave ‘iii’.
That gives us a target for wave ‘i’ near the previous wave ‘ii’ low at 3890 or there about.
There is work to do here to confirm the top is in again.
Tomorrow;
Watch for wave ‘3’ of ‘i’ to take over and fall back below wave ‘iv’ at 4049 at a minimum.
SILVER.
SILVER 1hr
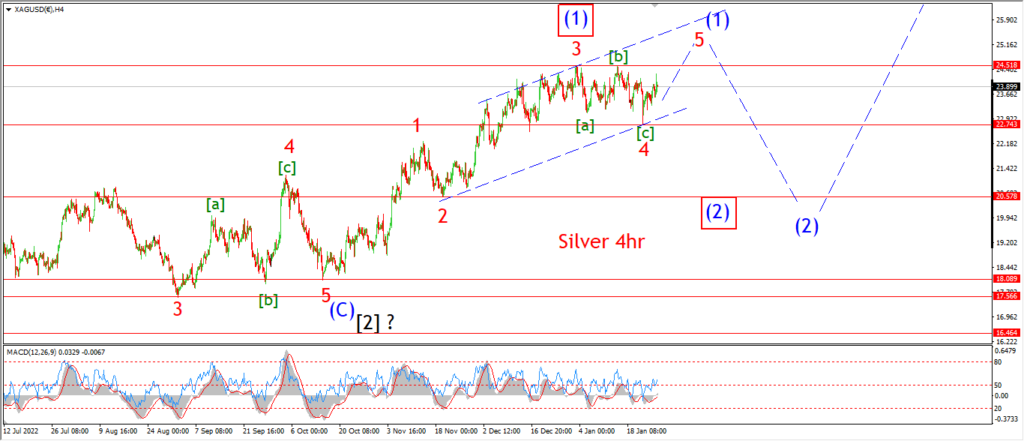
SILVER 4hr.
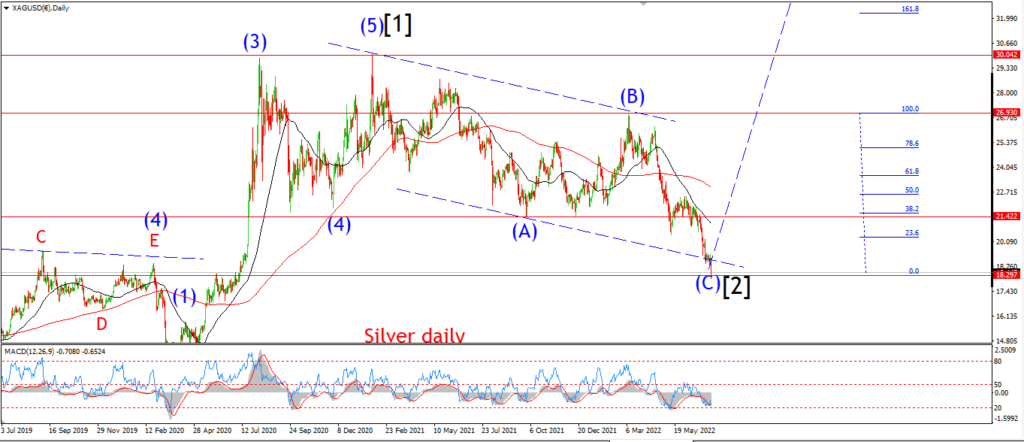
SILVER daily.
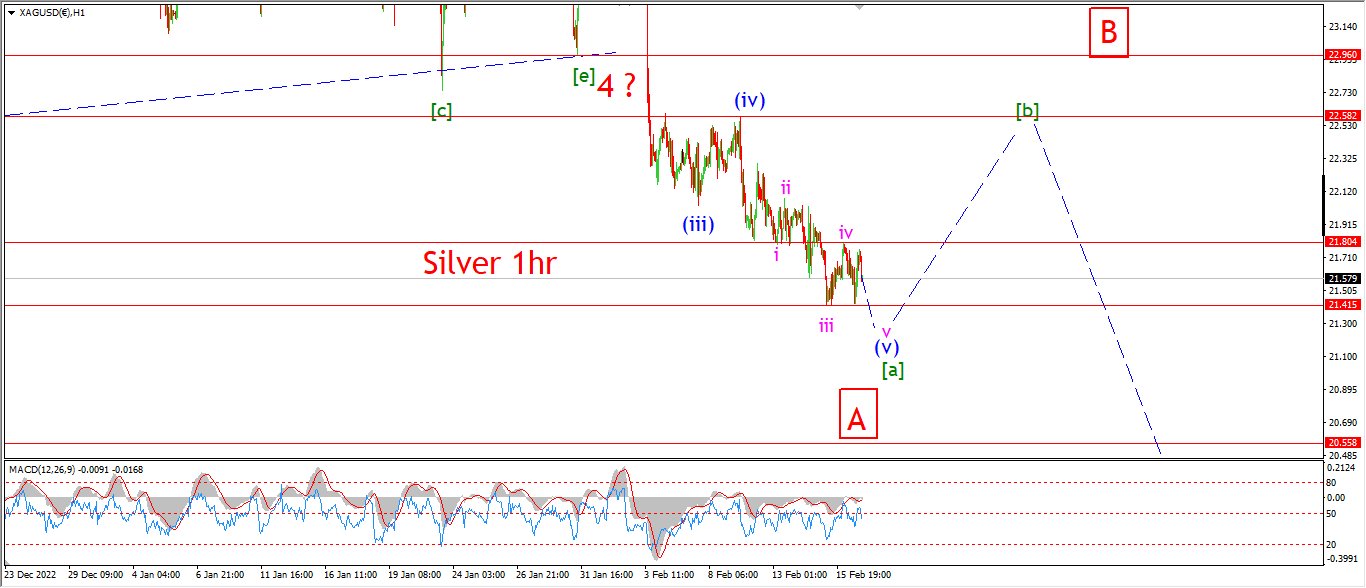
So far the upside action has been corrective today and now we see another retest of the lows again this evening.
I am looking at another possibility for wave [a] now because of that action.
The pattern in wave (v) of [a] is shown as a five wave pattern dropping into today’s lows.
The internal action in wave (v) is not ideal to be honest,
but there is a possible ending diagonal pattern underway in the midst of all that choppy overlapping movement.
Another low in wave ‘v’ of (v) will complete the larger wave [a].
and then I will look higher again into wave [b] next week.
Tomorrow;
Watch for wave ‘v’ to complete with a break of 21.40 again.
A break above 21.80 again will signal wave [a] is complete.
BITCOIN
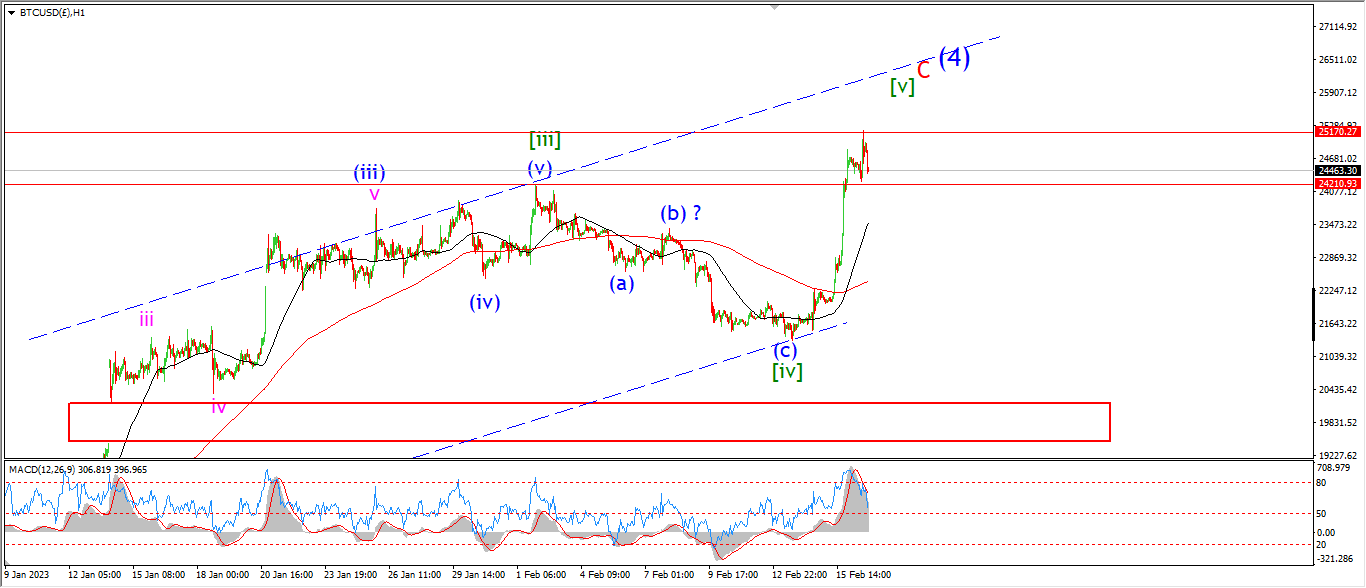
BITCOIN 1hr.

BITCOIN 4hr.
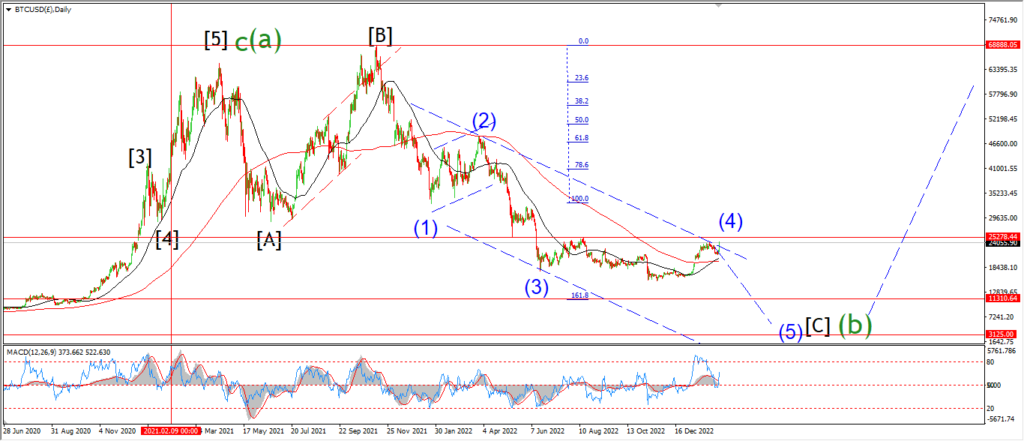
BITCOIN daily.
….
FTSE 100.
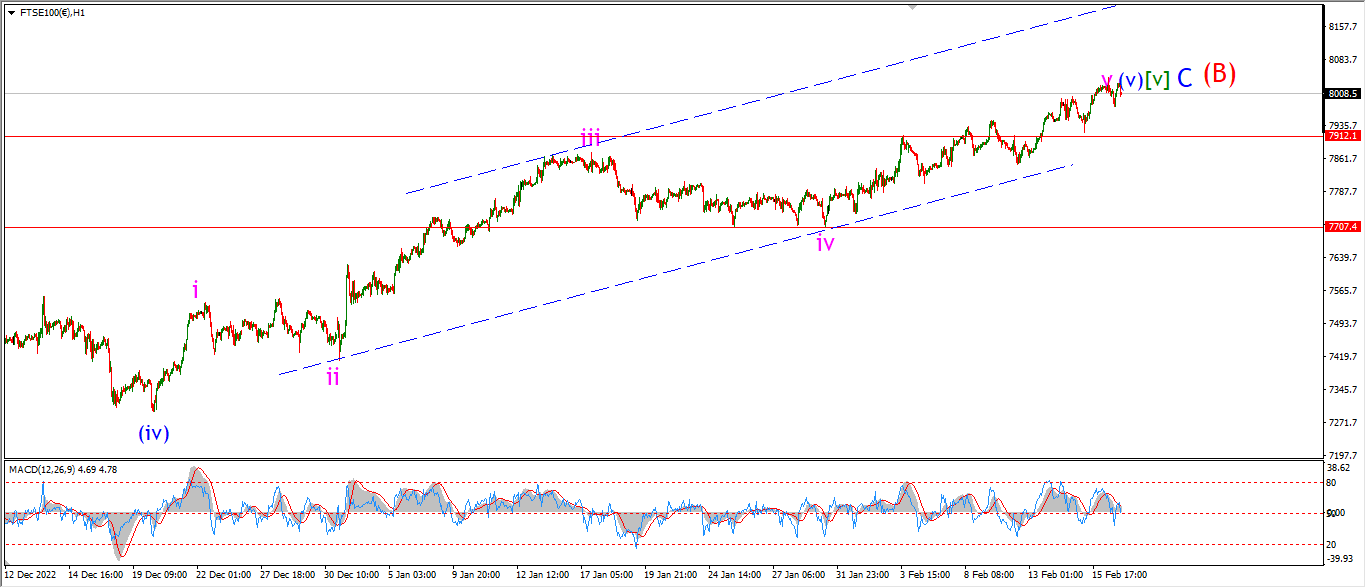
FTSE 100 1hr.
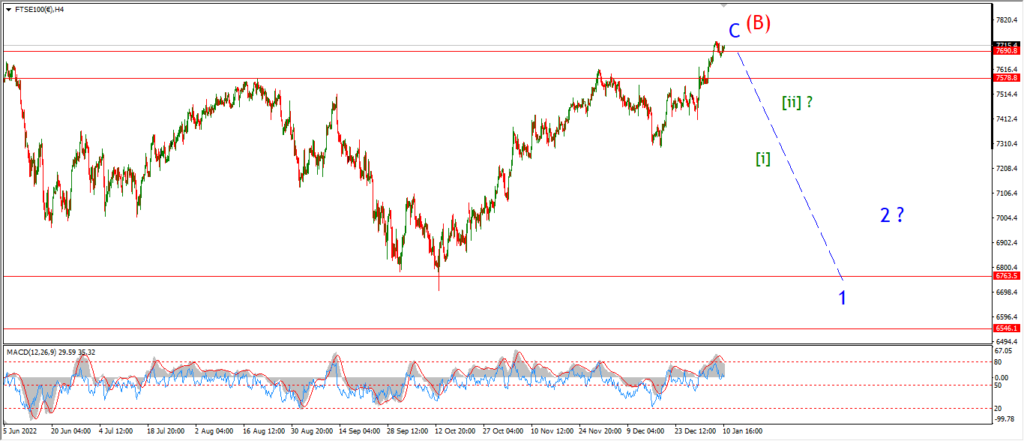
FTSE 100 4hr.

FTSE 100 daily.
….
DAX.
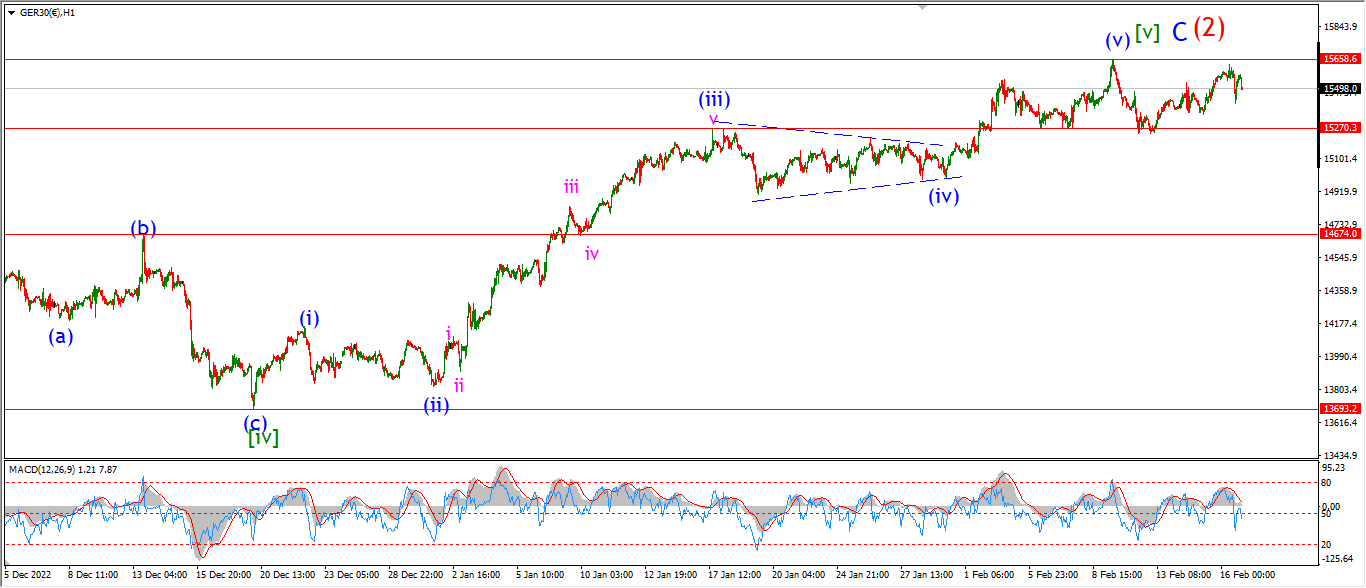
DAX 1hr
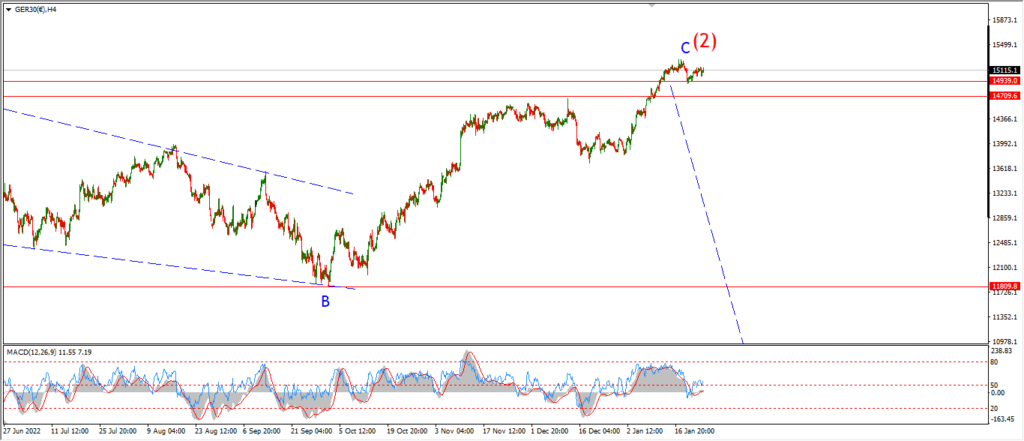
DAX 4hr

DAX daily.
….
NASDAQ 100.
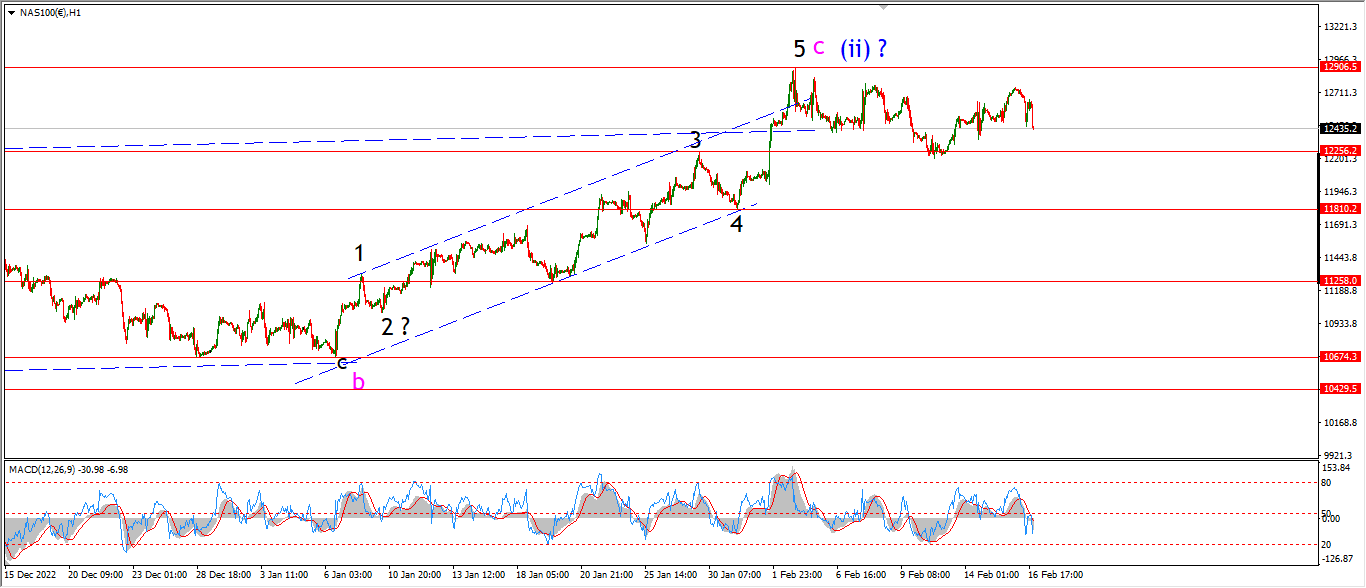
NASDAQ 1hr
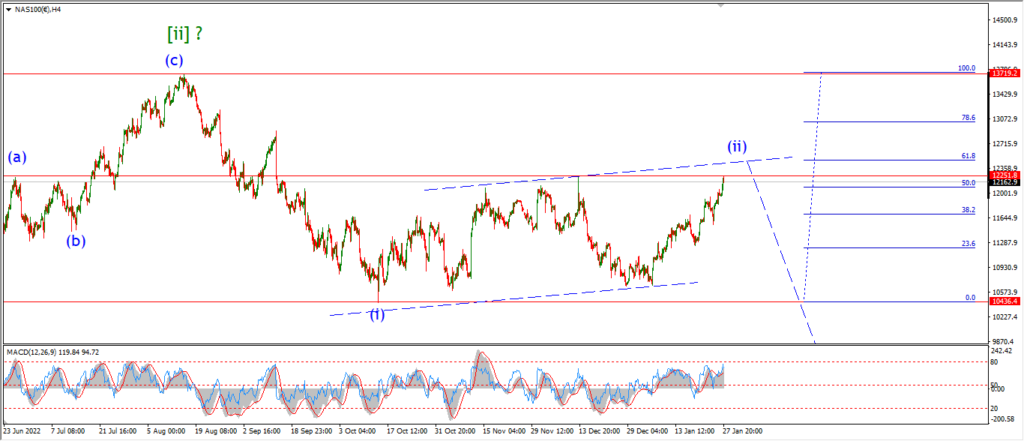
NASDAQ 4hr.

NASDAQ daily.
….