
[vc_row][vc_column][vc_separator border_width=”5″][/vc_column][/vc_row]
[vc_row][vc_column][vc_column_text]
Hi everyone,
another update on the sentiment figures in the stock market.
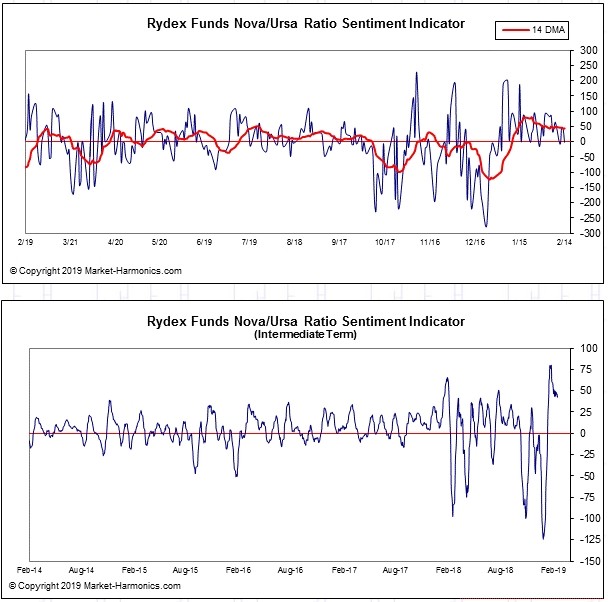
NOVA fund is a bullish mutual fund, Ursa is a bearish fund.
The ratio of the flow of funds into either of these funds creates the sentiment indicator below.
this indicator is now diverging in a bearish fashion at the current lower high.
And this signals that momentum in Sentiment is turning again.
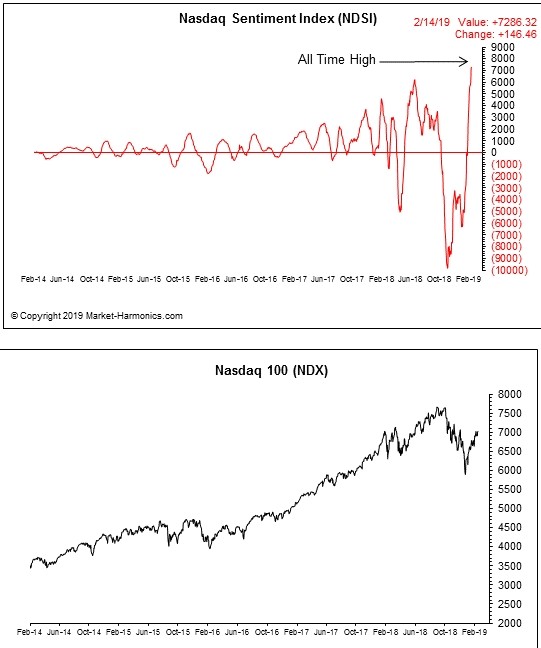
The Nasdaq sentiment data is simply breath taking at the moment.
A new all time high in sentiment this week.
And of course the lower high in the market indicates the usual extreme in optimism at the second wave lower high.
You can find this data and more a http://www.market-harmonics.com
Ok, lets get into this.
[/vc_column_text][/vc_column][/vc_row]
[_s2If current_user_can(access_s2member_ccap_eurusd)]
[vc_row][vc_column][vc_separator border_width=”5″][/vc_column][/vc_row]
[vc_row][vc_column][vc_column_text]
EURUSD
[/vc_column_text][/vc_column][/vc_row]
[vc_row][vc_column][vc_separator border_width=”5″][/vc_column][/vc_row][vc_row][vc_column width=”2/3″][vc_custom_heading text=”1 hr” use_theme_fonts=”yes”][vc_column_text]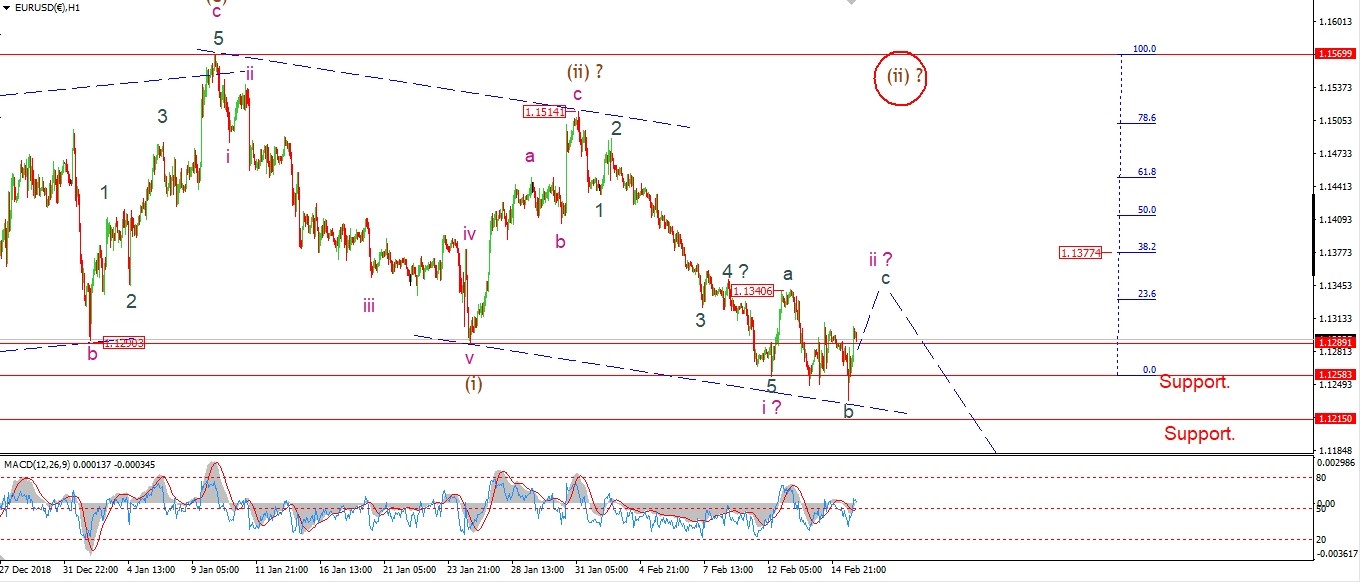 [/vc_column_text][/vc_column][vc_column width=”1/3″][vc_custom_heading text=”4 Hours” use_theme_fonts=”yes”][vc_column_text]
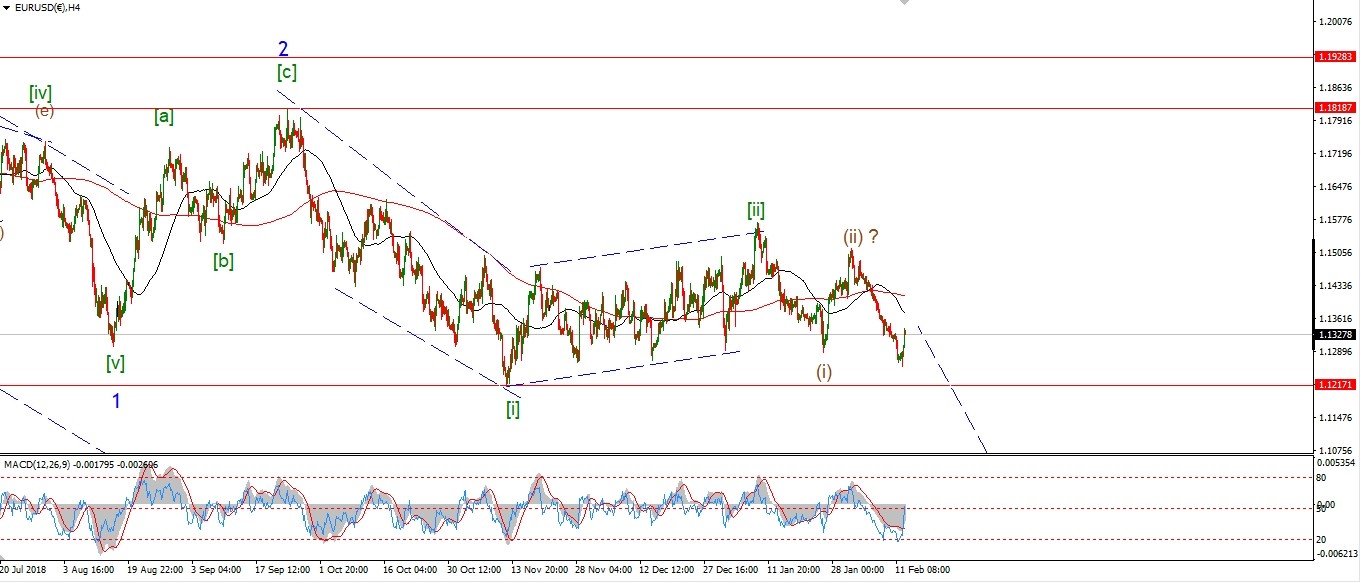 [/vc_column_text][vc_custom_heading text=”Daily” use_theme_fonts=”yes”][vc_column_text]
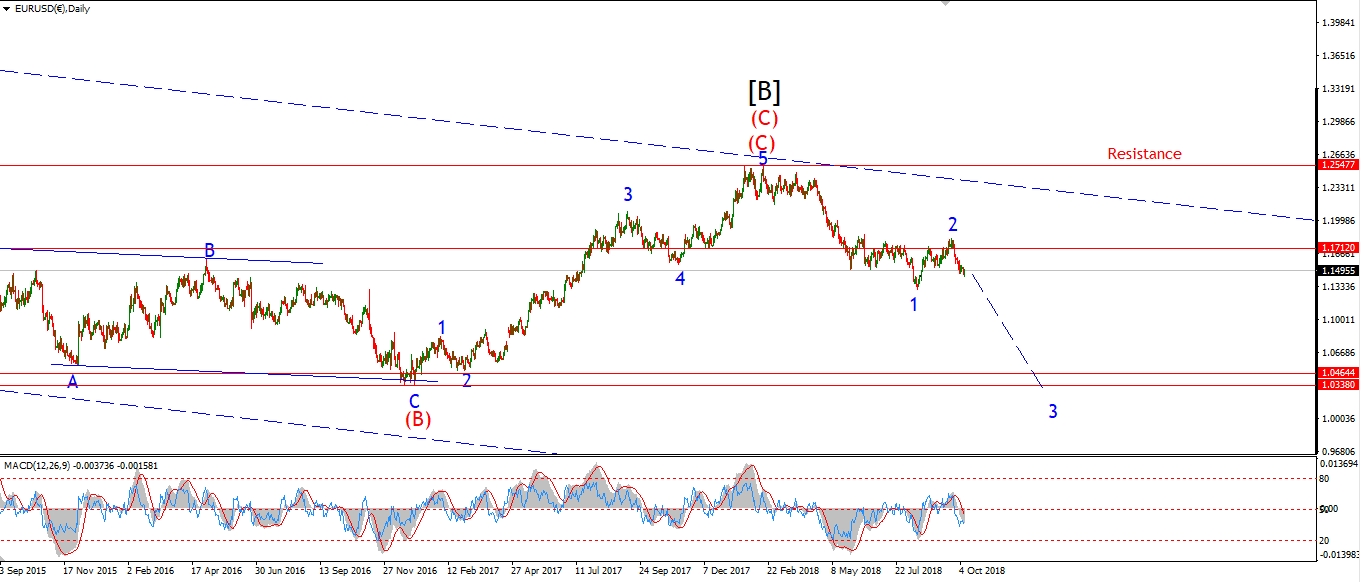 [/vc_column_text][/vc_column][/vc_row]
[vc_row][vc_column][vc_column_text]
EURUSD dropped in three waves off the wave ‘a’ high over the last few days.
this drop has been retraced by about half this evening with that spike higher over the last few hours.
Wave ‘c’ of ‘ii’ is now underway.
and wave ‘ii’ itself is likely tracing out an expanded flat pattern.
Once wave ‘ii’ completes we will have another bearish signal in place for EURUSD,
Monday;
watch for wave ‘c’ to hit the wave ‘a’ high at 1.1340 before completing.
[/vc_column_text][/vc_column][/vc_row]
[/_s2If]
[_s2If current_user_can(access_s2member_ccap_gbpusd)]
[vc_row][vc_column][vc_separator border_width=”5″][/vc_column][/vc_row][vc_row][vc_column][vc_column_text]
GBPUSD
[/vc_column_text][/vc_column][/vc_row][vc_row][vc_column][vc_separator border_width=”5″][/vc_column][/vc_row][vc_row][vc_column width=”2/3″][vc_custom_heading text=”1 hr” use_theme_fonts=”yes”][vc_column_text]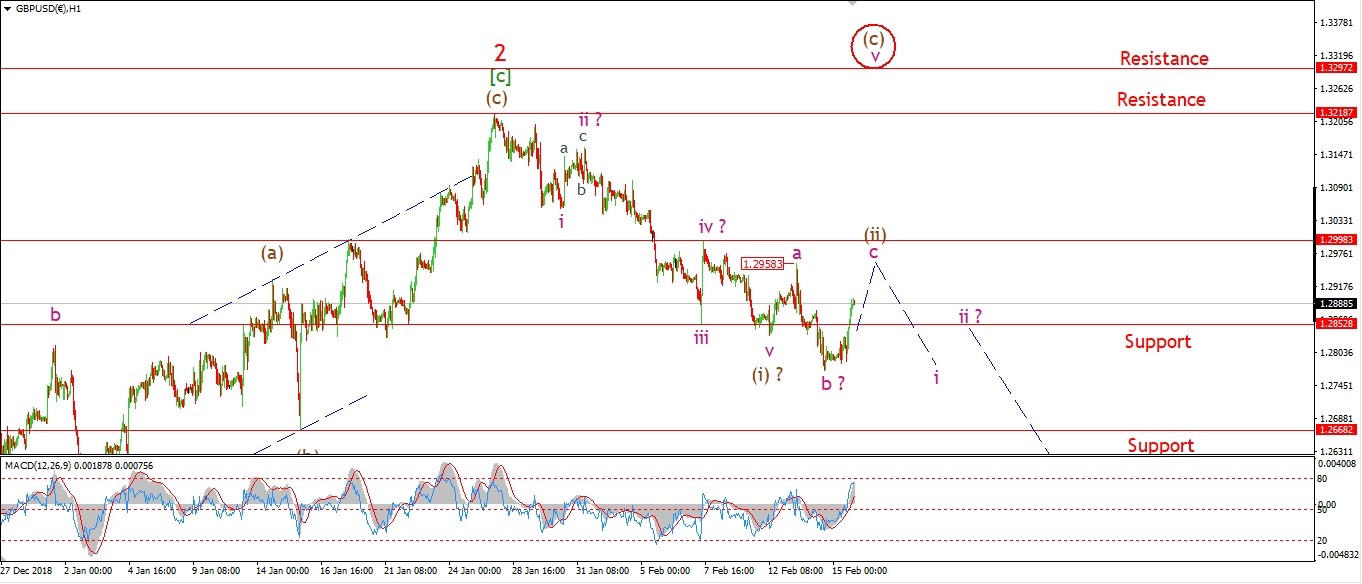 [/vc_column_text][/vc_column][vc_column width=”1/3″][vc_custom_heading text=”4 Hours” use_theme_fonts=”yes”][vc_column_text]
 [/vc_column_text][vc_custom_heading text=”Daily” use_theme_fonts=”yes”][vc_column_text]
 [/vc_column_text][/vc_column][/vc_row]
[vc_row][vc_column][vc_column_text]
A very similar pattern is on display in cable tonight.
The drop off the wave ‘a’ high at 1.2958 is in three waves.
even though a new low was reached,
this is more likely a wave ‘b’ low.
Wave ‘c’ has rallied this evening and should hit that wave ‘a’ high again before completing.
Monday;
Wave ‘c’ should continue higher to complete wave (ii).
[/vc_column_text][/vc_column][/vc_row]
[/_s2If]
[_s2If current_user_can(access_s2member_ccap_usdjpy)]
[vc_row][vc_column][vc_separator border_width=”5″][/vc_column][/vc_row][vc_row][vc_column][vc_column_text]
USDJPY
[/vc_column_text][/vc_column][/vc_row][vc_row][vc_column][vc_separator border_width=”5″][/vc_column][/vc_row][vc_row][vc_column width=”2/3″][vc_custom_heading text=”1 hr” use_theme_fonts=”yes”][vc_column_text]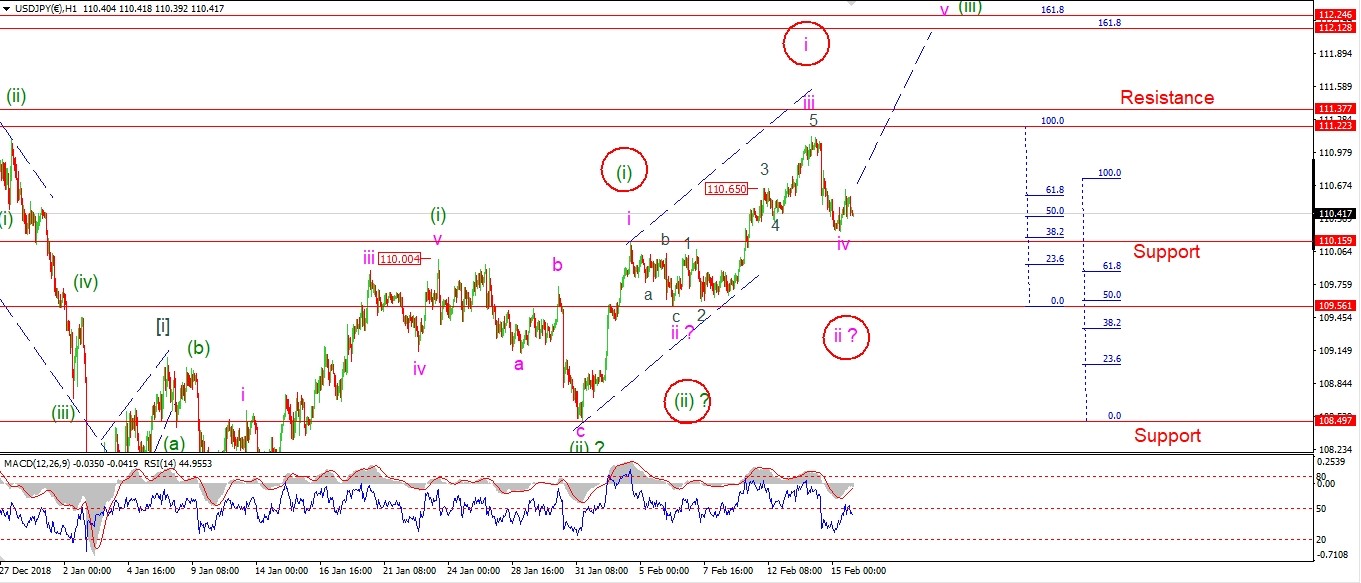 [/vc_column_text][/vc_column][vc_column width=”1/3″][vc_custom_heading text=”4 Hours” use_theme_fonts=”yes”][vc_column_text]
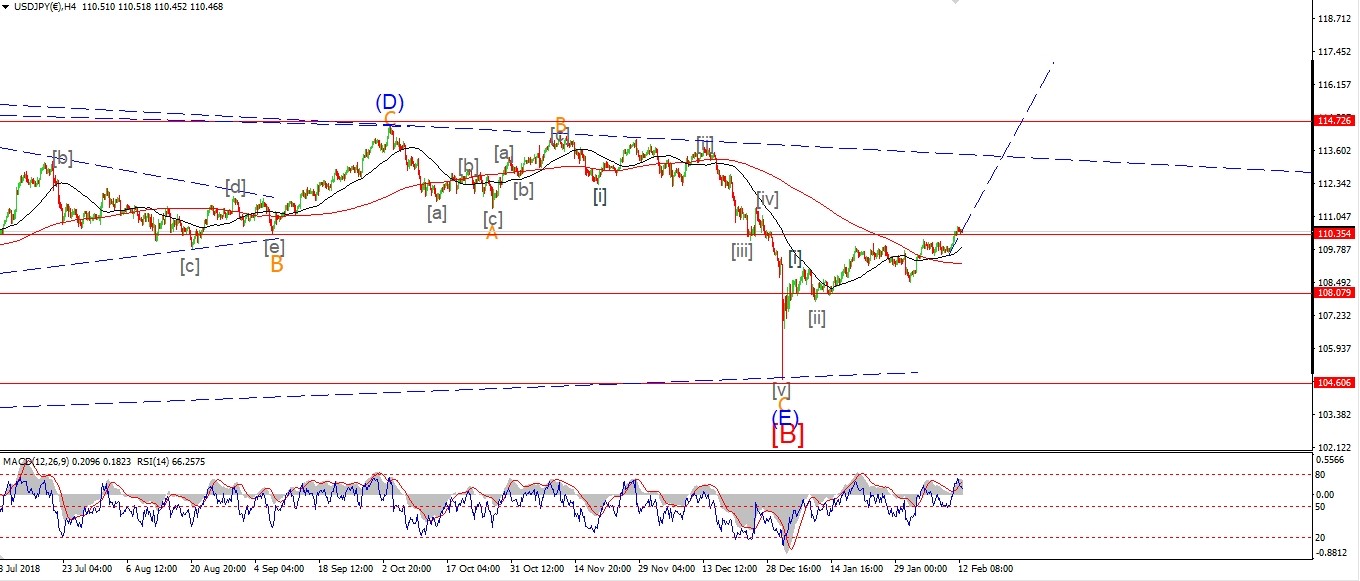 [/vc_column_text][vc_custom_heading text=”Daily” use_theme_fonts=”yes”][vc_column_text]
 [/vc_column_text][/vc_column][/vc_row]
[vc_row][vc_column][vc_column_text]
I went through the alternate scenario in USDJPY this evenings video.
It involves moving up the wave count by one degree,
this would create a series of four impulse patterns higher
off that flash crash low!
If this pattern is correct,
then we can expect a larger move higher in a third wave.
Monday;
watch for 110.15 to hold as wave ‘iv’ completes,
If that level breaks this will trigger the alternate count.
[/vc_column_text][/vc_column][/vc_row]
[/_s2If]
[_s2If current_user_can(access_s2member_ccap_dow_jones)]
[vc_row][vc_column][vc_separator border_width=”5″][/vc_column][/vc_row][vc_row][vc_column][vc_column_text]
DOW JONES INDUSTRIALS
[/vc_column_text][/vc_column][/vc_row][vc_row][vc_column][vc_separator border_width=”5″][/vc_column][/vc_row][vc_row][vc_column width=”2/3″][vc_custom_heading text=”1 hr” use_theme_fonts=”yes”][vc_column_text] [/vc_column_text][/vc_column][vc_column width=”1/3″][vc_custom_heading text=”4 Hours” use_theme_fonts=”yes”][vc_column_text]
 [/vc_column_text][vc_custom_heading text=”Daily” use_theme_fonts=”yes”][vc_column_text]
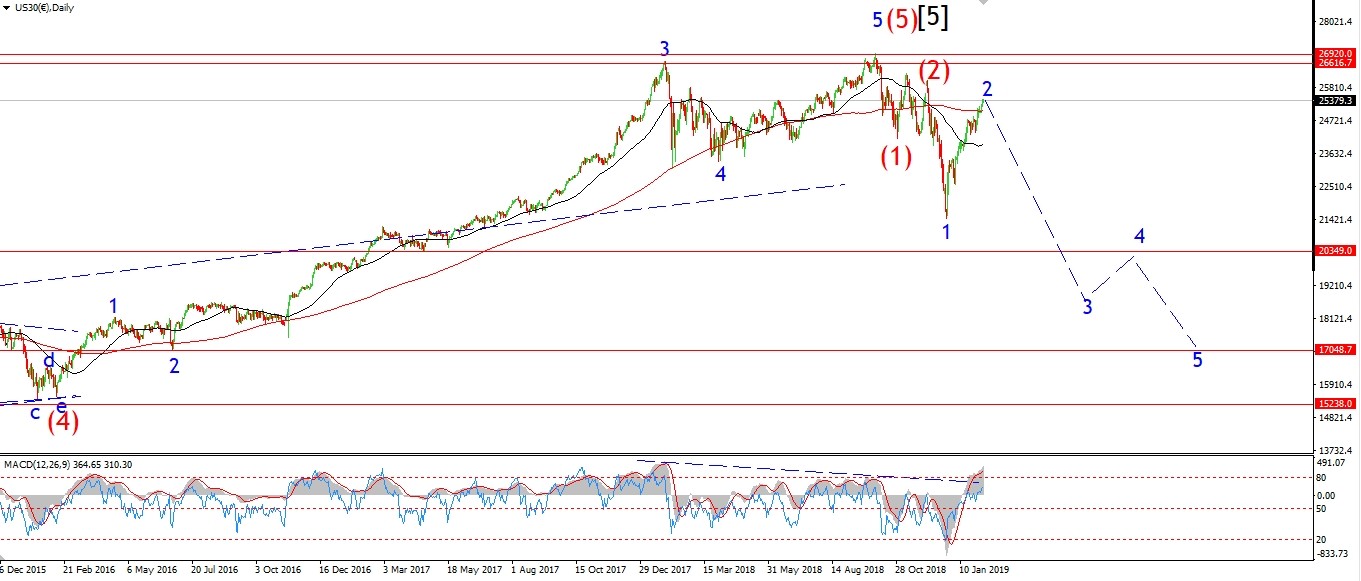 [/vc_column_text][/vc_column][/vc_row]
[vc_row][vc_column][vc_column_text]
The DOW has punched higher today to finish the week with another big rally.
Wave [c] has now reached the 162% extension of wave [a].
And wave ‘2’ has carried to an almost unbelievable full retracement of the previous wave ‘1’.
The final interpretation for wave (v) of [c] is an ending diagonal with an extended wave ‘i’
and reducing wave lengths for wave ‘iii’ and wave ‘v’.
Wave ‘v’ itself has reached 50% of wave ‘i’.
I have shown some charts depicting the degree of bullishness in the market again this evening.
The nasdaq sentiment all time high is particularly interesting,
given that the major indices are topping at lower highs.
This is very fitting for a high in either a ‘b’ wave or wave ‘2’ as shown.
If the high at 26065 is broken,
That will trigger the wave ‘B’ scenario shown on the 4hr chart.
Monday;
watch for that 26065 high to hold and wave [i] of ‘3’ down to begin.
[/vc_column_text][/vc_column][/vc_row]
[/_s2If]
[_s2If current_user_can(access_s2member_ccap_gold)]
[vc_row][vc_column][vc_separator border_width=”5″][/vc_column][/vc_row][vc_row][vc_column][vc_column_text]
GOLD
[/vc_column_text][/vc_column][/vc_row][vc_row][vc_column][vc_separator border_width=”5″][/vc_column][/vc_row][vc_row][vc_column width=”2/3″][vc_custom_heading text=”1 hr” use_theme_fonts=”yes”][vc_column_text]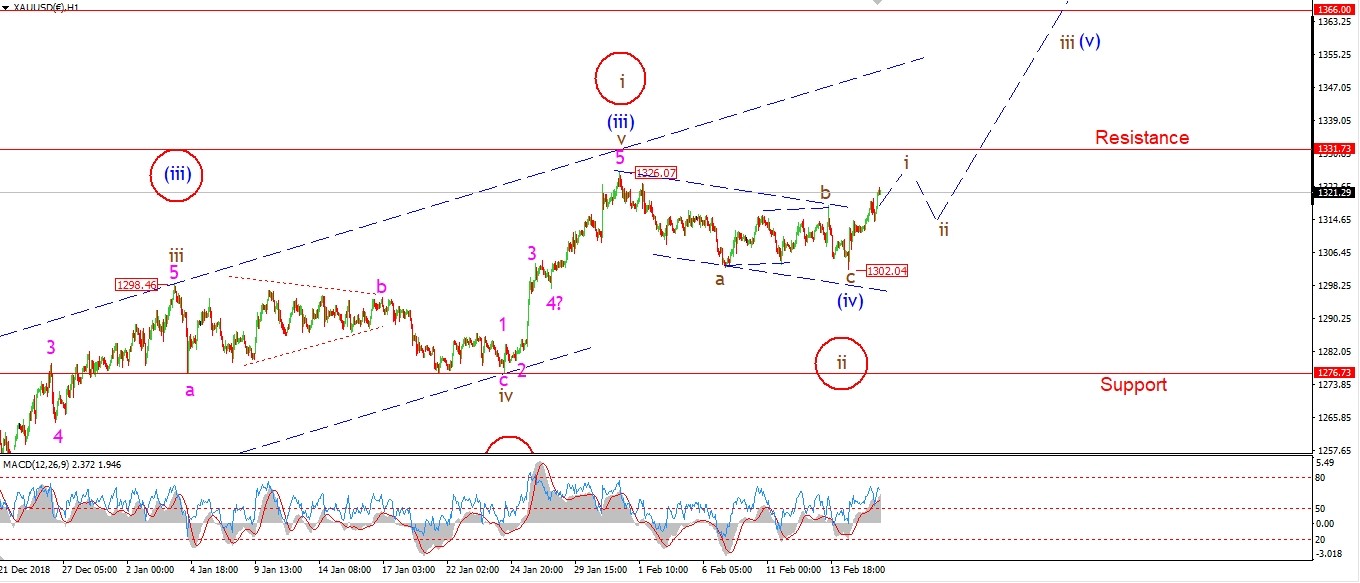 [/vc_column_text][/vc_column][vc_column width=”1/3″][vc_custom_heading text=”4 Hours” use_theme_fonts=”yes”][vc_column_text]
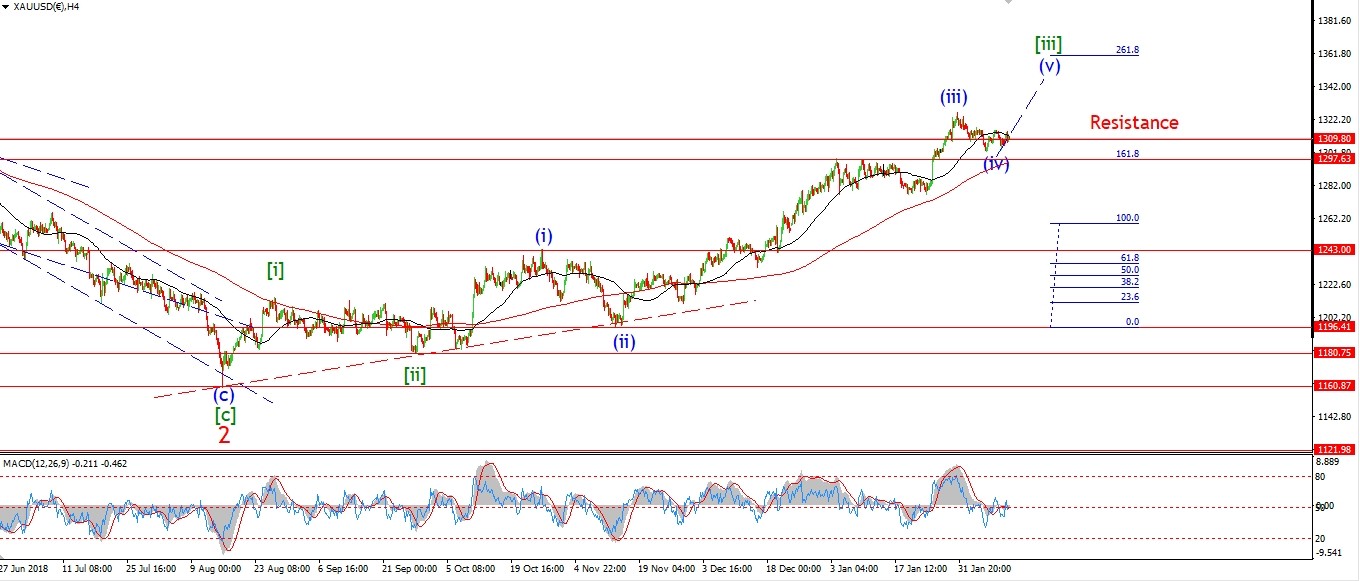 [/vc_column_text][vc_custom_heading text=”Daily” use_theme_fonts=”yes”][vc_column_text]
 [/vc_column_text][/vc_column][/vc_row]
[vc_row][vc_column][vc_column_text]
Gold has continued to rise off the wave (iv) low today.
The high at wave ‘b’ was broken at 1317,
this indicates that the correction in wave (iv) is now complete
and the price should continue higher in wave (v).
A break of 1331 will signal wave (v) has begun.
Monday;
Watch for the low at wave (iv) to hold at 1302.
A correction in wave ‘ii’ should complete above that 1302 level by midweek.
[/vc_column_text][/vc_column][/vc_row]
[/_s2If]
[_s2If current_user_can(access_s2member_ccap_crude)]
[vc_row][vc_column][vc_separator border_width=”5″][/vc_column][/vc_row][vc_row][vc_column][vc_column_text]
U.S CRUDE OIL
[/vc_column_text][/vc_column][/vc_row][vc_row][vc_column][vc_separator border_width=”5″][/vc_column][/vc_row][vc_row][vc_column width=”2/3″][vc_custom_heading text=”1 hr” use_theme_fonts=”yes”][vc_column_text]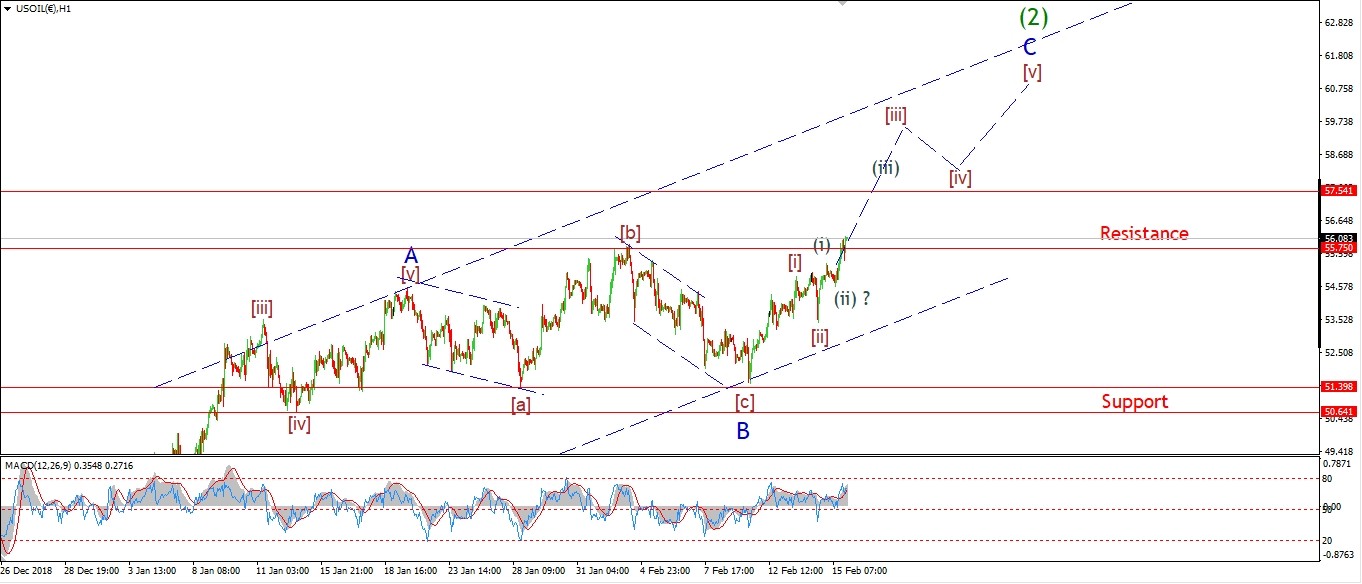 [/vc_column_text][/vc_column][vc_column width=”1/3″][vc_custom_heading text=”4 Hours” use_theme_fonts=”yes”][vc_column_text]
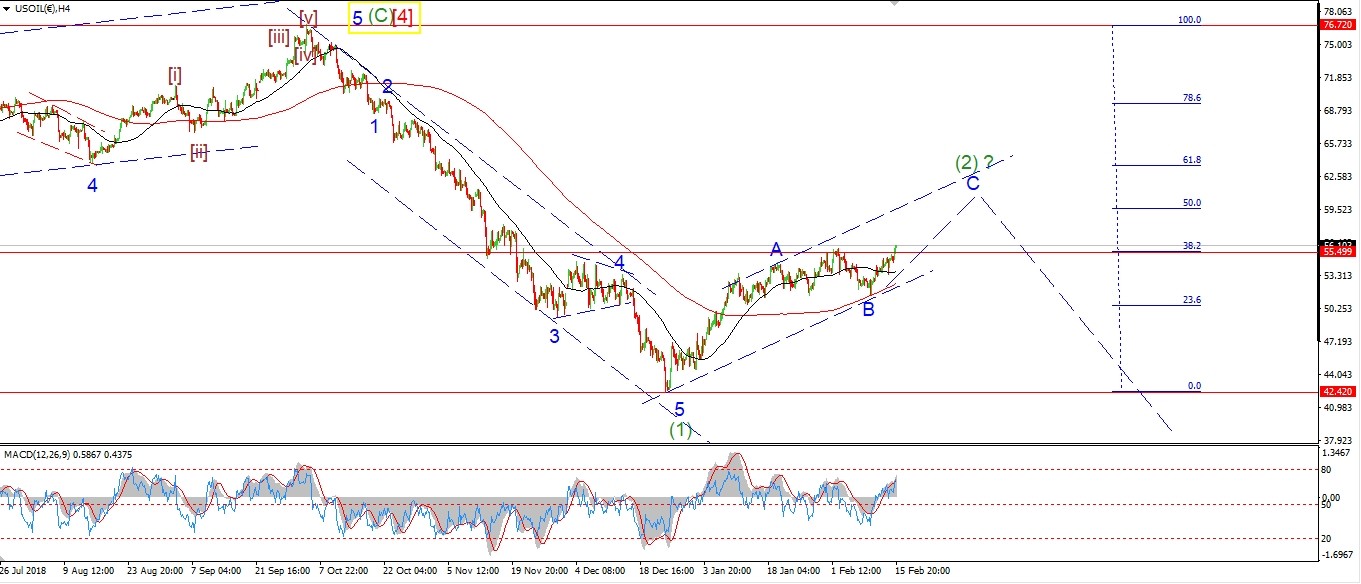 [/vc_column_text][vc_custom_heading text=”Daily” use_theme_fonts=”yes”][vc_column_text]
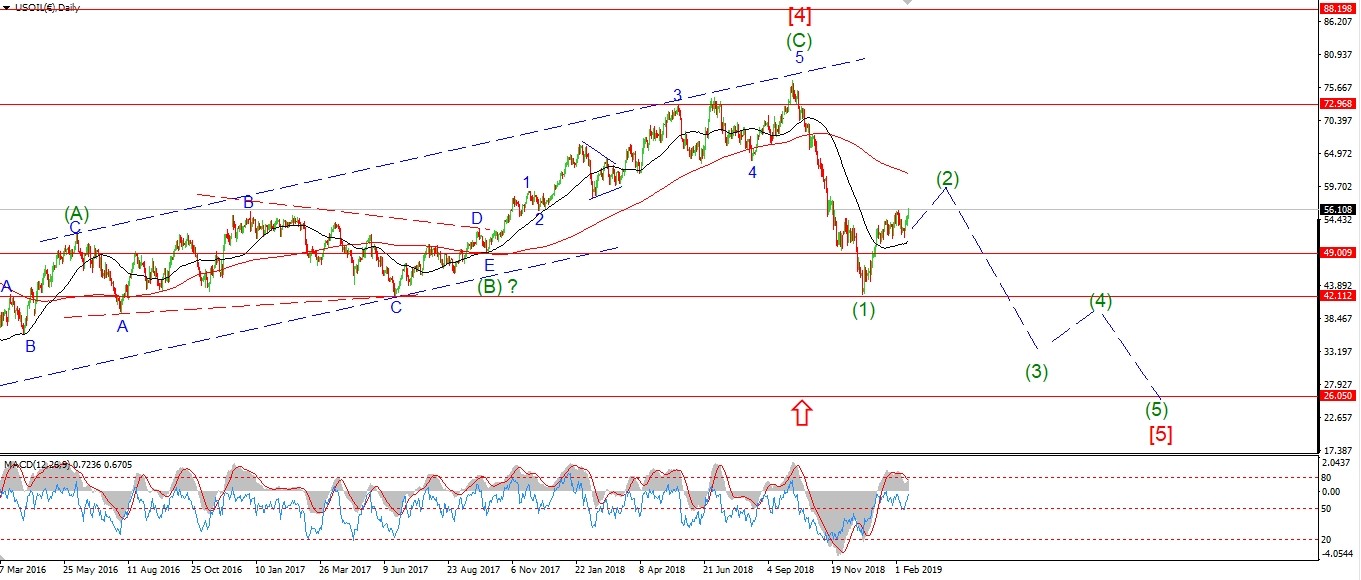 [/vc_column_text][/vc_column][/vc_row]
[vc_row][vc_column][vc_column_text]
The rally in crude broke above the recent high at 55.75 and this has triggered the alternate count.
The market completed a running flat wave ‘B’
and is now rising in wave ‘C’ of (2).
Wave ‘C’ should hit the upper trendline at about 63.00
before turning down again into wave (3).
Wave ‘C’ should also trace out a five wave pattern.
So the rise off the lows this week is labelled as waves [i] and [ii],
with wave [iii] now underway.
Monday;
Wave [iii] should continue higher and at least hit the 57.00 handle,
this is where wave ‘C’ would reach 50% of wave ‘A’.
Wave ‘C’ should last until the end of the month.
[/vc_column_text][/vc_column][/vc_row]
[/_s2If]
[_s2If current_user_can(access_s2member_ccap_us10yr)]
[vc_row][vc_column][vc_separator border_width=”5″][/vc_column][/vc_row][vc_row][vc_column][vc_column_text]
US 10 yr Treasuries.
[/vc_column_text][/vc_column][/vc_row][vc_row][vc_column][vc_separator border_width=”5″][/vc_column][/vc_row][vc_row][vc_column width=”2/3″][vc_custom_heading text=”1 hr” use_theme_fonts=”yes”][vc_column_text]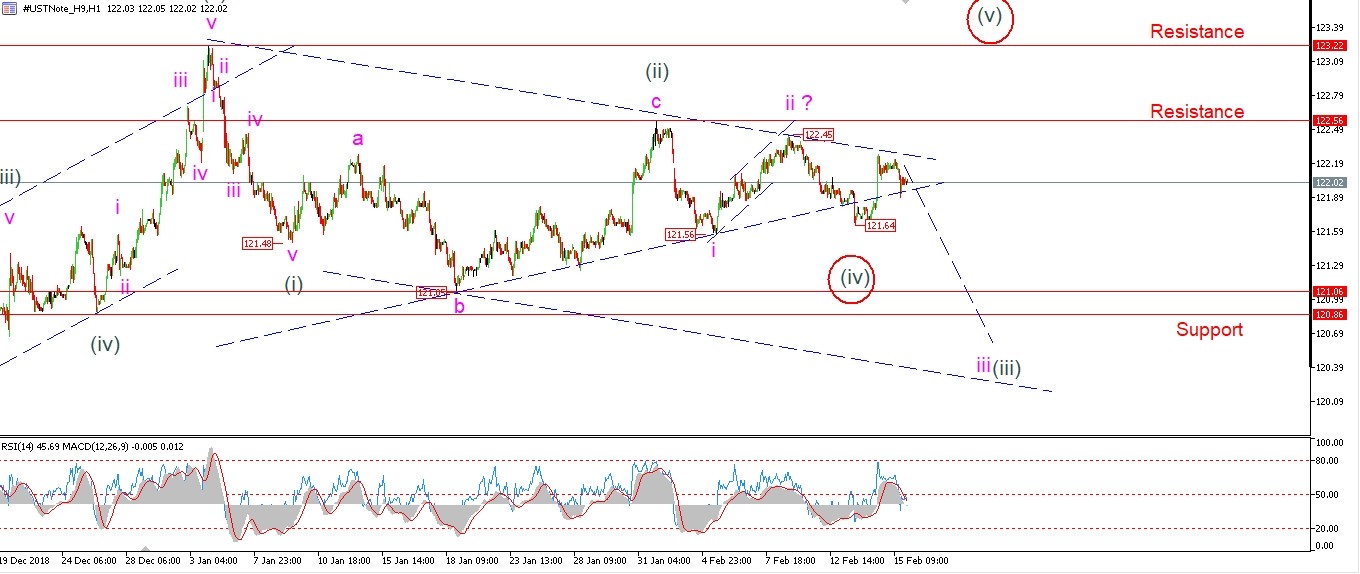 [/vc_column_text][/vc_column][vc_column width=”1/3″][vc_custom_heading text=”4 Hours” use_theme_fonts=”yes”][vc_column_text]
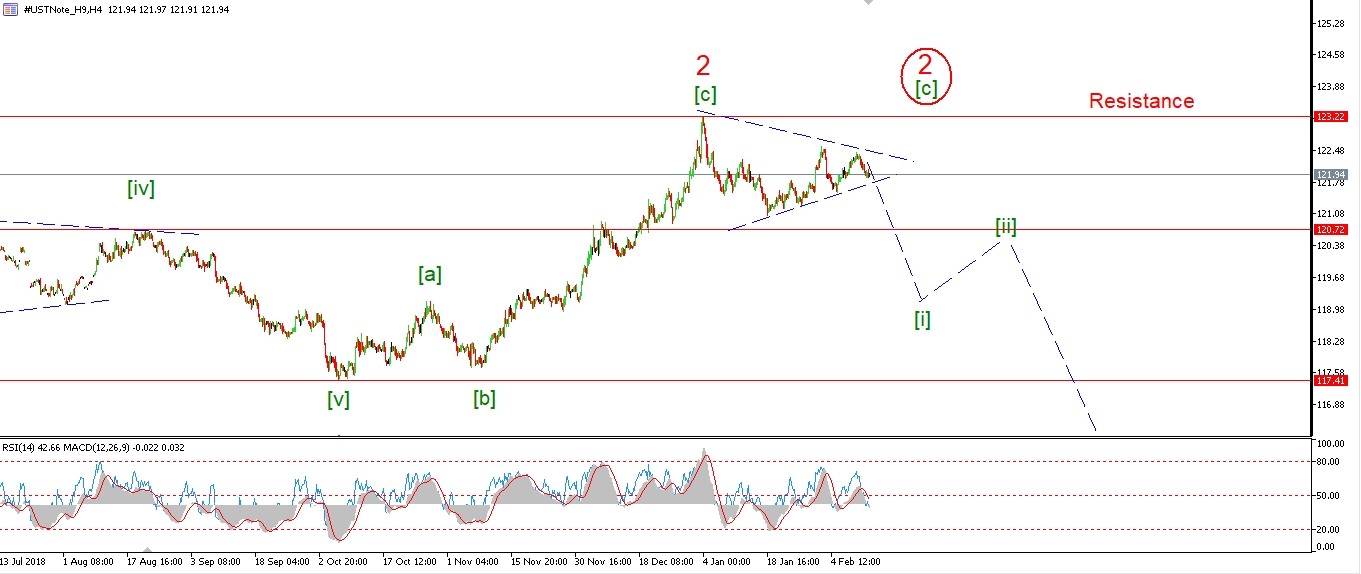 [/vc_column_text][vc_custom_heading text=”Daily” use_theme_fonts=”yes”][vc_column_text]
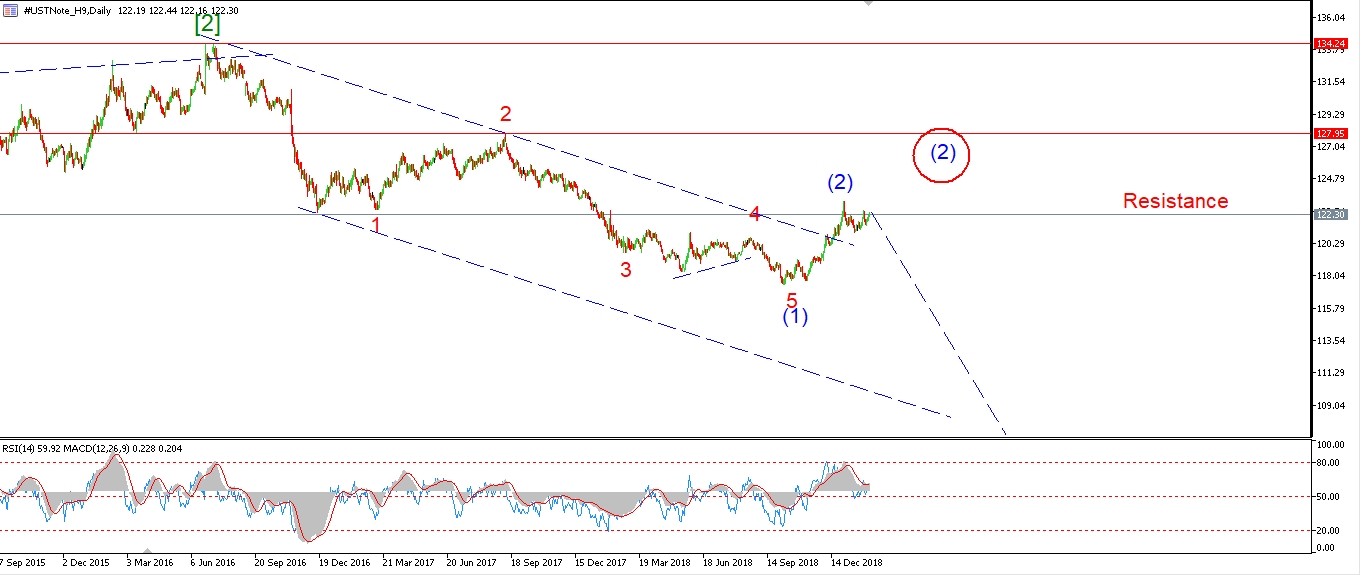 [/vc_column_text][/vc_column][/vc_row]
[vc_row][vc_column][vc_column_text]
The triangle alternate count signals a possible wave (iv) of [c]
or a wave [b] of ‘2’.
this is explained in this weekends video in more detail.
The trading range has continued to contract over the week,
and the invalidation level for the current wave count is getting tighter.
If the market breaks the high at 122.45,
then we will see another high to at least 123.22 at resistance.
While if the market breaks down from here below the 121.56 level at wave ‘i’,
then we can be fairly confident that the highs for wave ‘2’ are in
and we can look lower into a third wave down.
Monday;
next week is lining up to be a decision point for the 10YR,
Watch for 122.45 to hold and a break of the previous lows again in wave ‘iii’ down.
[/vc_column_text][/vc_column][/vc_row]
[/_s2If]
[_s2If current_user_can(access_s2member_ccap_silver)]
[vc_row][vc_column][vc_separator border_width=”5″][/vc_column][/vc_row][vc_row][vc_column][vc_column_text]
SILVER
[/vc_column_text][/vc_column][/vc_row][vc_row][vc_column][vc_separator border_width=”5″][/vc_column][/vc_row][vc_row][vc_column width=”2/3″][vc_custom_heading text=”1 hr” use_theme_fonts=”yes”][vc_column_text]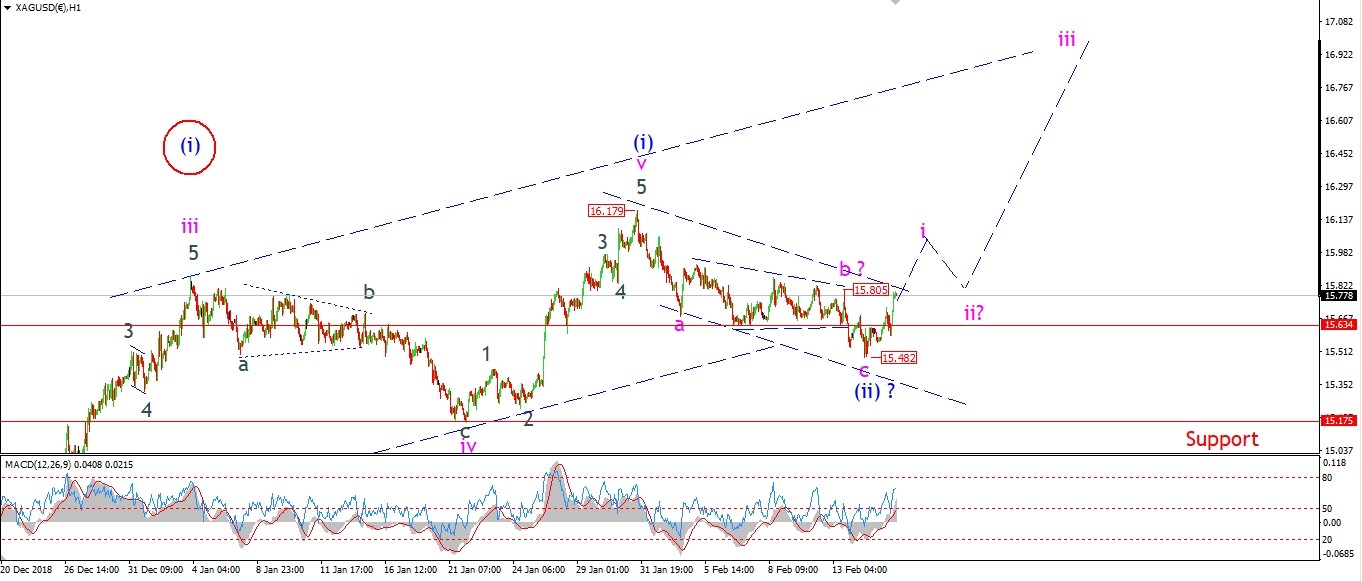 [/vc_column_text][/vc_column][vc_column width=”1/3″][vc_custom_heading text=”4 Hours” use_theme_fonts=”yes”][vc_column_text]
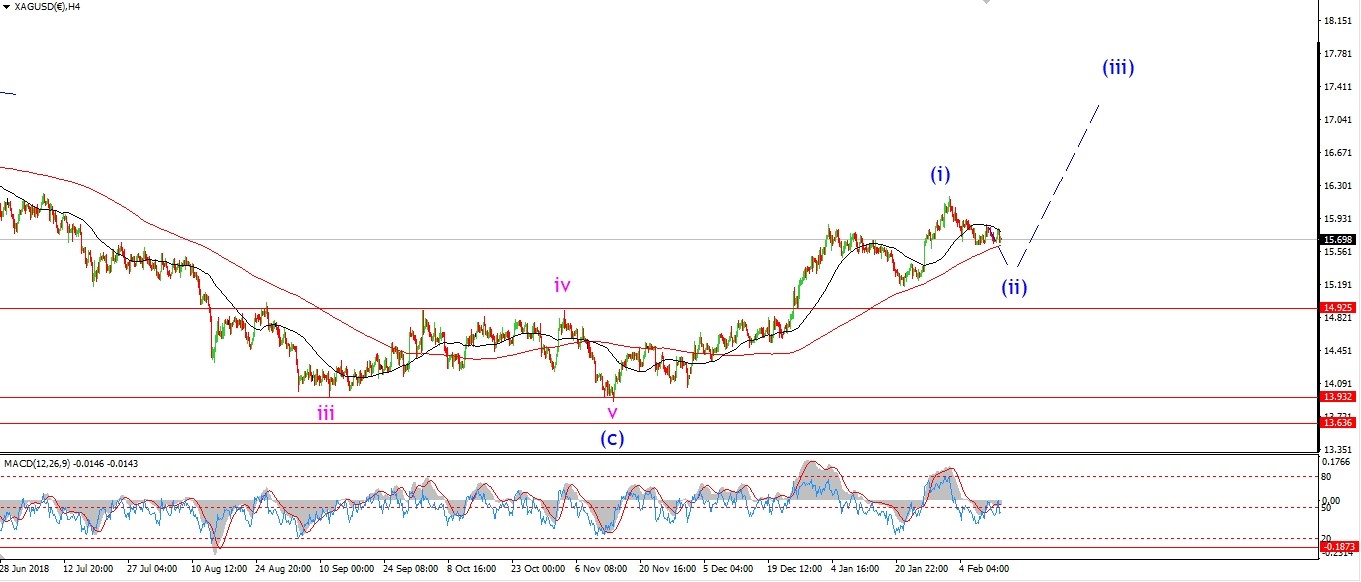 [/vc_column_text][vc_custom_heading text=”Daily” use_theme_fonts=”yes”][vc_column_text]
 [/vc_column_text][/vc_column][/vc_row]
[vc_row][vc_column][vc_column_text]
Silver is pushing higher this evening in wave ‘i’ of (iii).
the rise off the low at 15.48 is not yet in a five wave form,
but a break of that wave ‘b’ high at 15.80 is close
and if this breaks it will signal wave ‘i’ has begun.
Monday;
We should see the low at 15.48 hold as wave ‘i’ and ‘ii’ complete a bullish signal.
Wave ‘iii’ of (iii) will likely be a prolonged rally and could take us up to the 18.00 handle again.
[/vc_column_text][/vc_column][/vc_row]
[/_s2If]
[_s2If current_user_can(access_s2member_ccap_sp500)]
[vc_row][vc_column][vc_separator border_width=”5″][/vc_column][/vc_row][vc_row][vc_column][vc_column_text]
S&P 500.
[/vc_column_text][/vc_column][/vc_row][vc_row][vc_column][vc_separator border_width=”5″][/vc_column][/vc_row][vc_row][vc_column width=”2/3″][vc_custom_heading text=”1 hr” use_theme_fonts=”yes”][vc_column_text]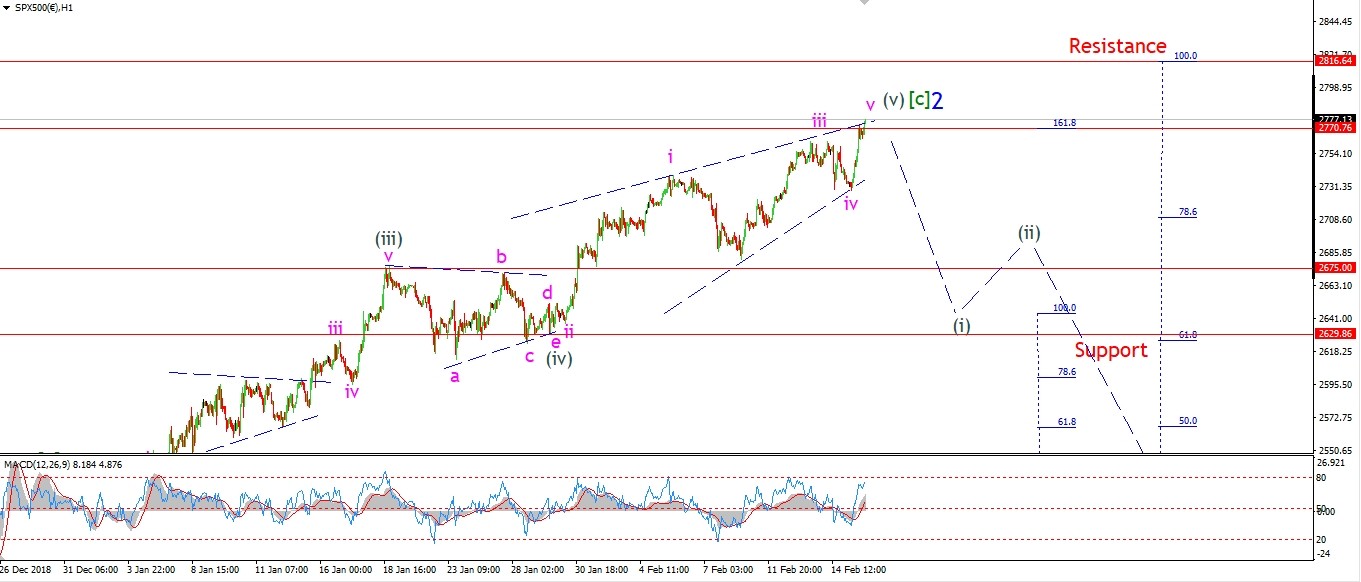 [/vc_column_text][/vc_column][vc_column width=”1/3″][vc_custom_heading text=”4 Hours” use_theme_fonts=”yes”][vc_column_text]
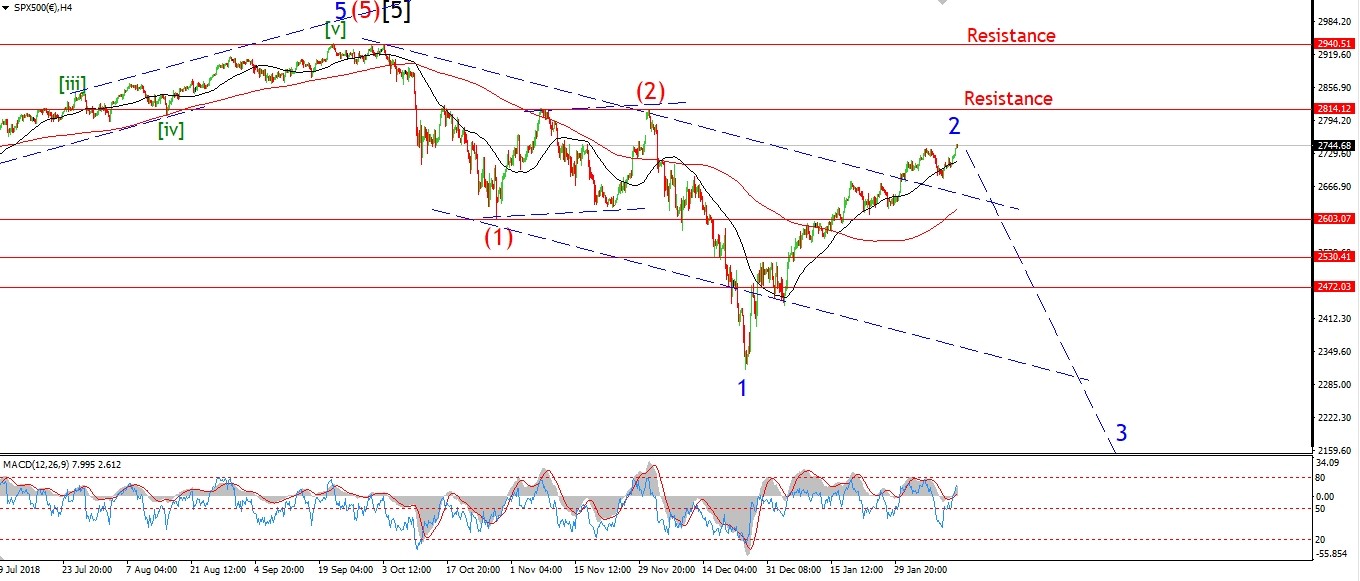 [/vc_column_text][vc_custom_heading text=”Daily” use_theme_fonts=”yes”][vc_column_text]
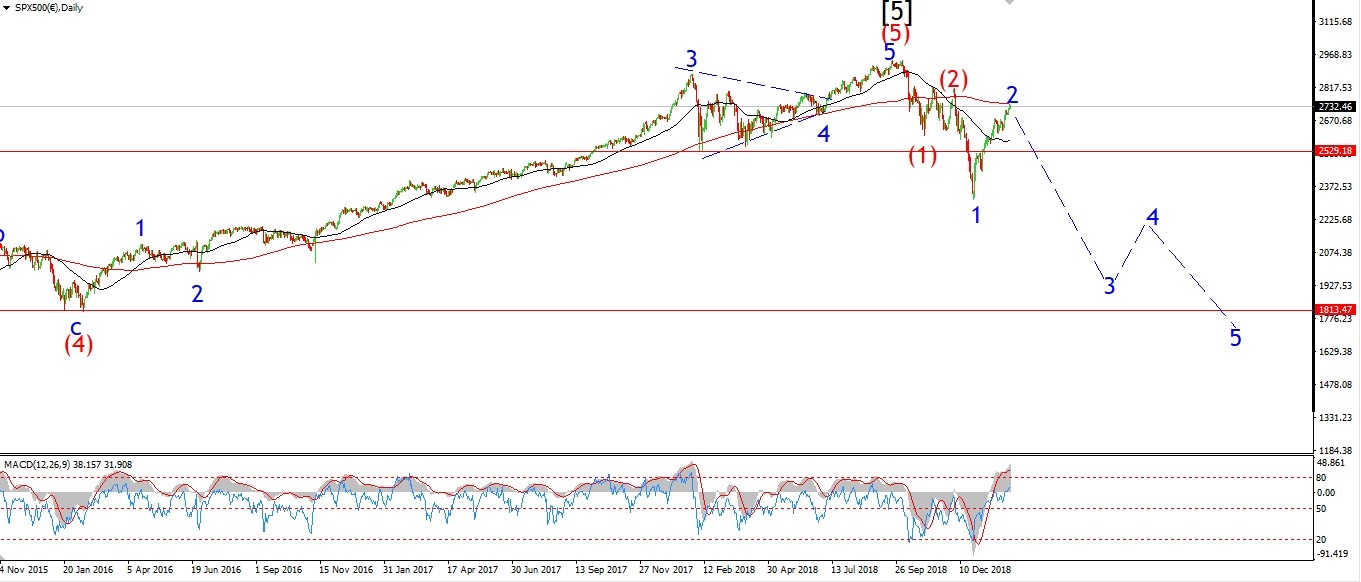 [/vc_column_text][/vc_column][/vc_row]
[vc_row][vc_column][vc_column_text]
Bullish sentiment in the S&P is actually diverging lower against the price rally.
This is shown in the Rydex Nova/Ursa chart in the intro.
This is indicative of a fifth wave advance.
The nasdaq sentiment gauge from Market harmonics is just mind blowing.
And this indicator hold true for the broad market.
Sentiment is completely lopsided on the bullish side.
And we will pay dearly for this.
We have truly been handed over to our own desires!
Monday;
The ending diagonal now fits well for wave (v) in the S&P with a similar extended wave ‘i’.
All I can do is await the turn that has so far eluded me.
[/vc_column_text][/vc_column][/vc_row]
[/_s2If]
[vc_row][vc_column][vc_column_text]
That will do it for this week.
I wish you all a good weekend.
God’s speed,
Enda.
[/vc_column_text][/vc_column][/vc_row]
[vc_row][vc_column][vc_separator border_width=”5″][/vc_column][/vc_row]