
God Bless you and good evening to you all!
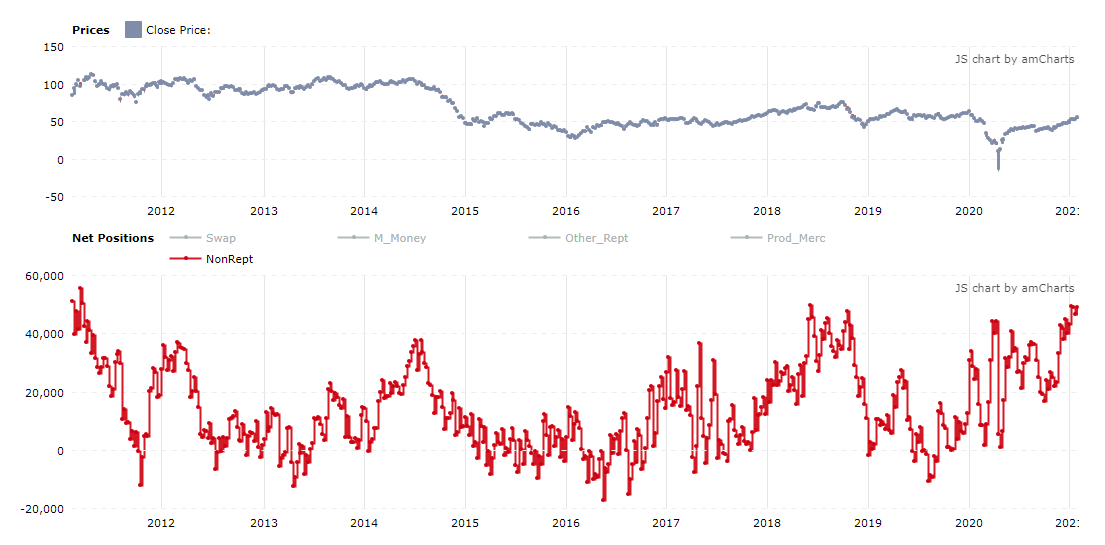
Crude oil small trader net futures positions;
EURUSD.
EURUSD 1hr.
EURUSD 4hr.
EURUSD daily.
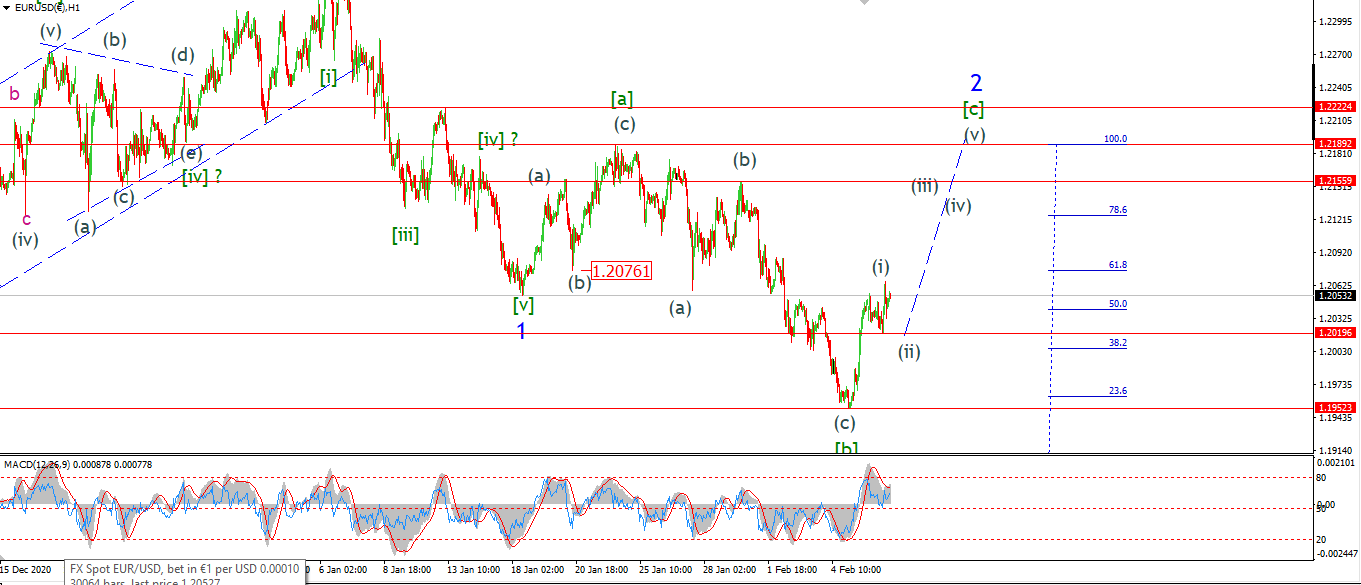
EURUSD has traced out a five wave rise into the high of the session today.
That completes wave (i) of [c] is the new wave count,
and we should expect wave (ii) to correct lower tomorrow,
but hold above 1.1952 at the recent lows of wave [b].
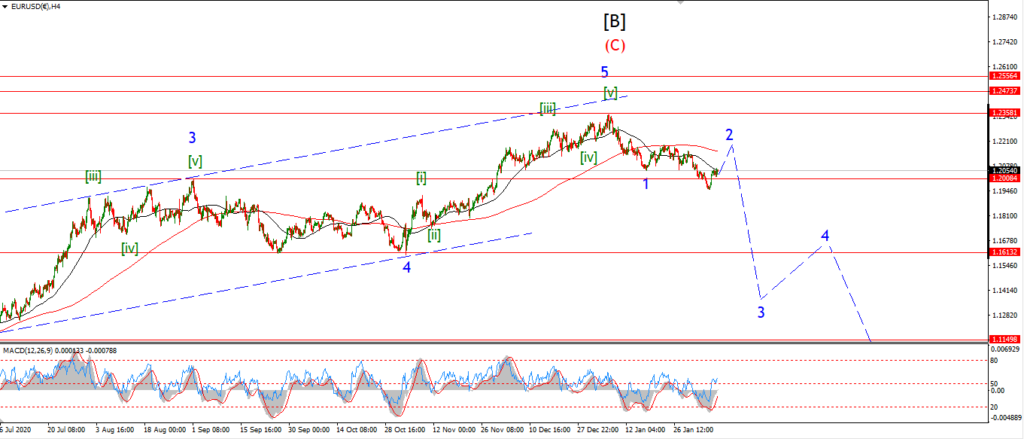
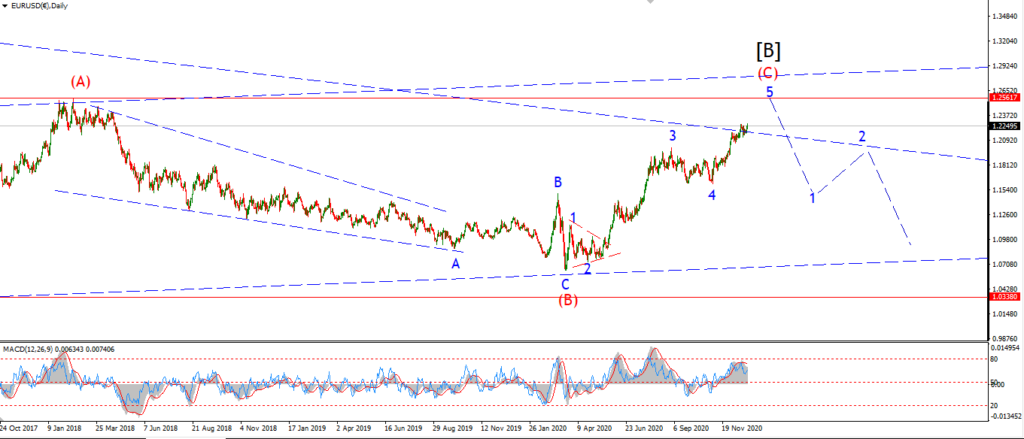
WE should see a five wave rally this week in wave [v] of ‘2’ and then we have another shot at beginning wave ‘3’ down.
Tomorrow;
Watch for wave (ii) to complete a corrective higher low above 1.1952.
GBPUSD
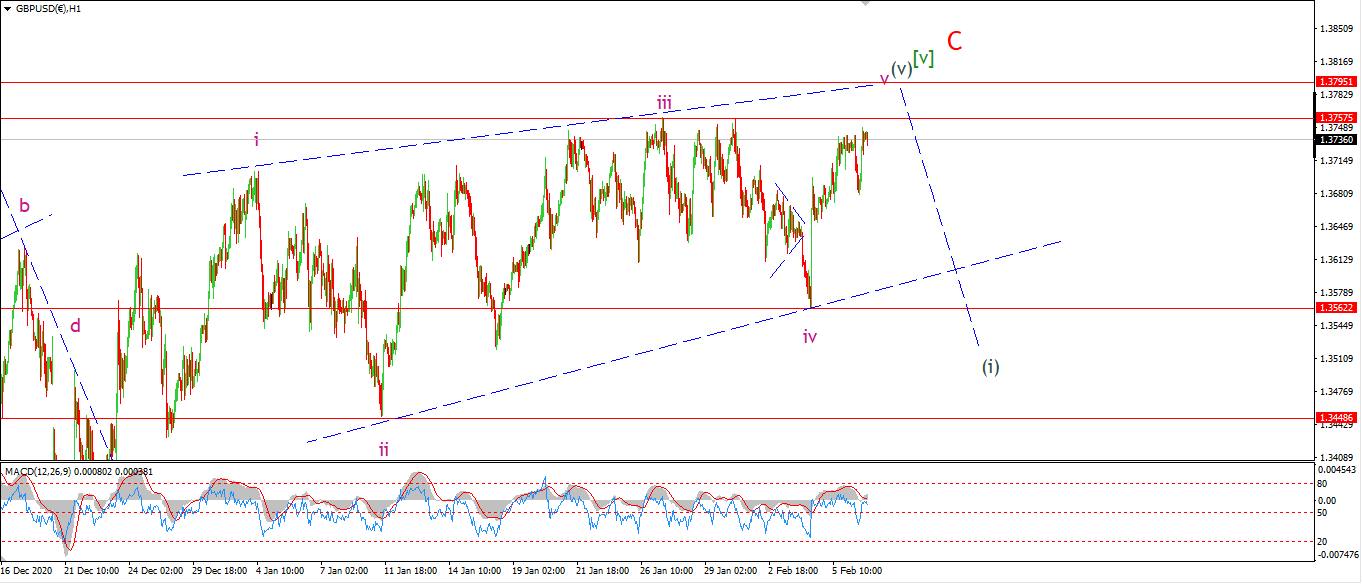
GBPUSD 1hr.
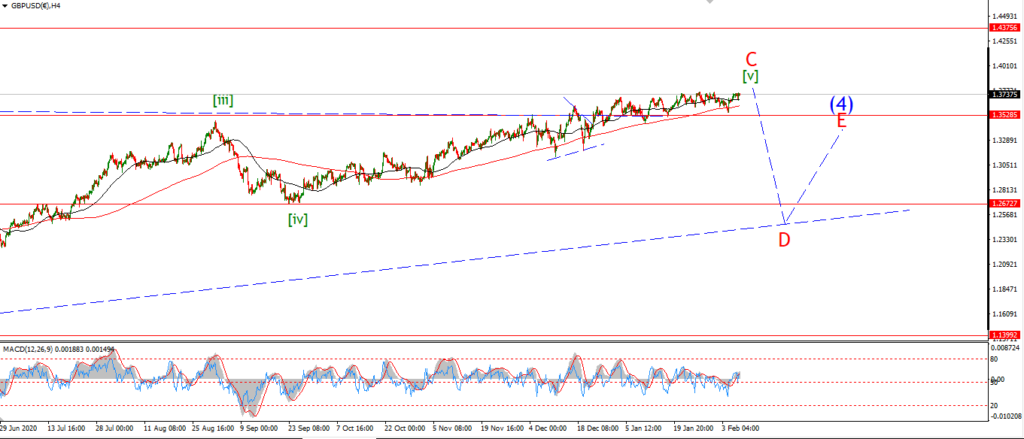
GBPUSD 4hr.

GBPUSD daily.
Cable has held below the previous highs at 1.3757 today,
but we are too close for comfort to that previous high so it is worth considering a further high this week in wave ‘v’ of (v).
That will again complete an ending diagonal wave (v) and it should lead to a large reversal lower in favor of the USD.
Tomorrow;
A simple break of 1.3757 is enough to complete wave ‘v’,
but the upper trend line of 1.3795 is a good target to close out this rally.
USDJPY.
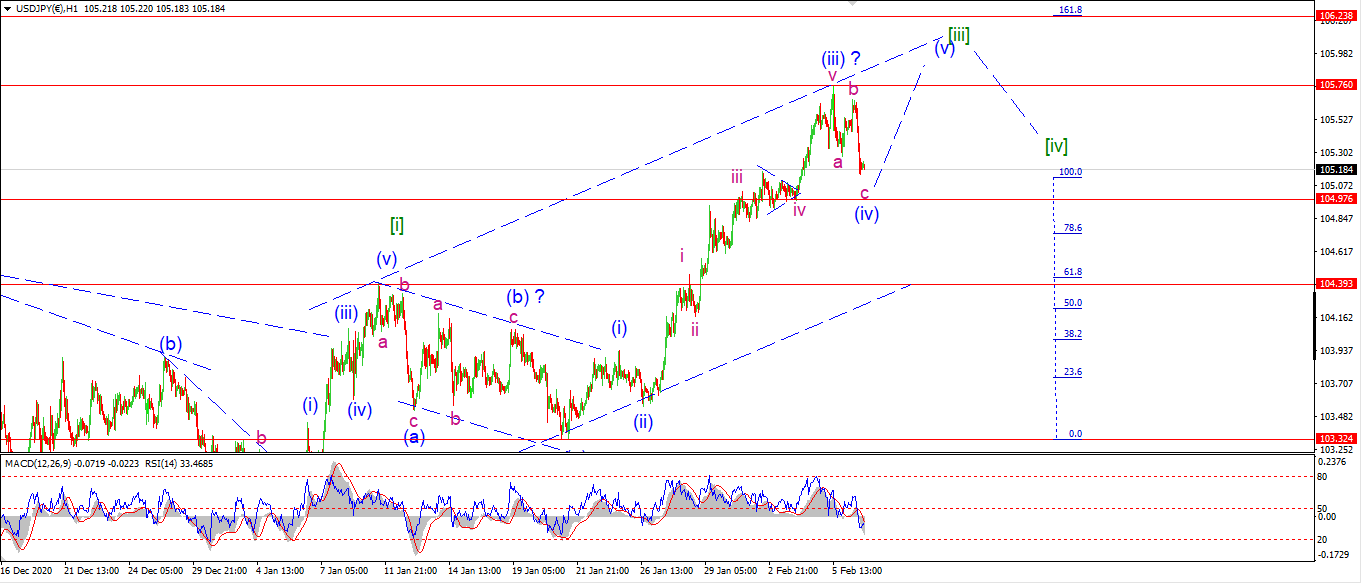
USDJPY 1hr.
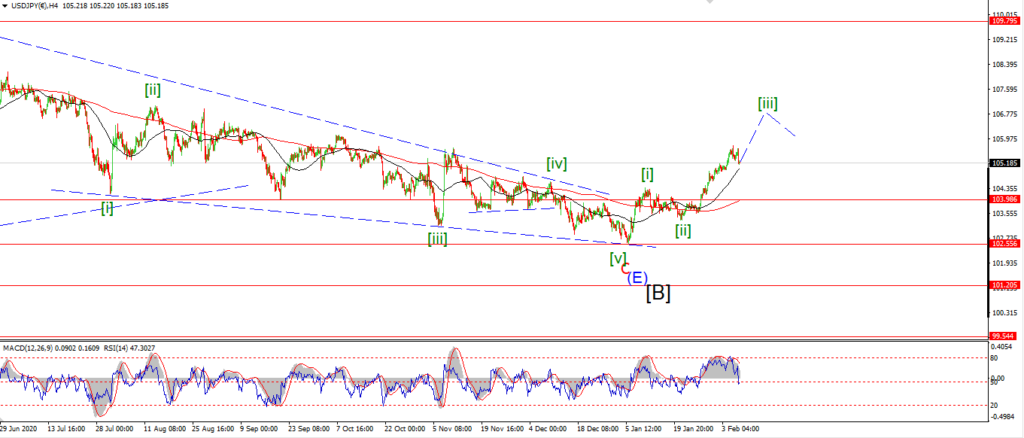
USDJPY 4hr.
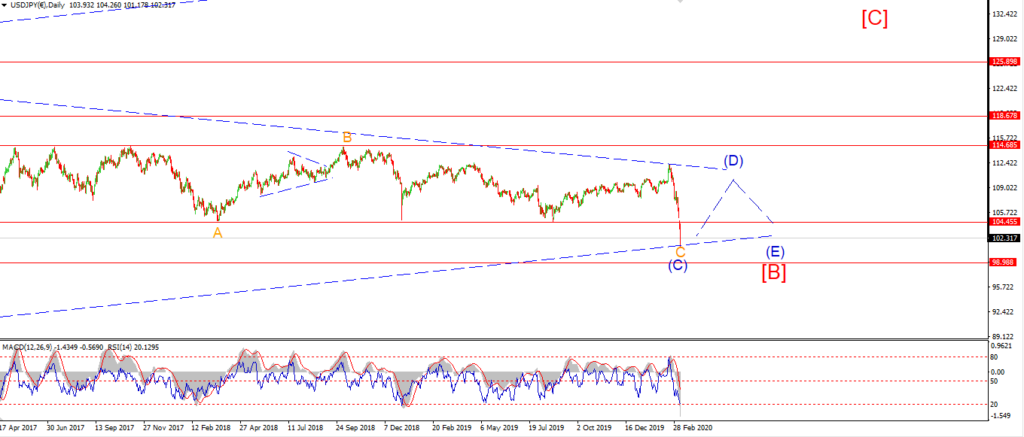
USDJPY daily.
We have a solid three wave decline in place into this evenings lows.
I have labelled this action as a correction in wave (iv) of [iii].
This correction should find a low in the area of the previous fourth wave at 104.97.
And then I am expecting wave (v) of [iii] to push higher again.
wave (v) of [iii] should break above the 105.76 top of wave [iii].
And wave [iii] will reach the 162% extension of wave [i] at 106.23.
Tomorrow;
Watch for wave (iv) to complete a three wave correction tomorrow at about 104.97.
104.40 is key support for this pattern.
DOW JONES.
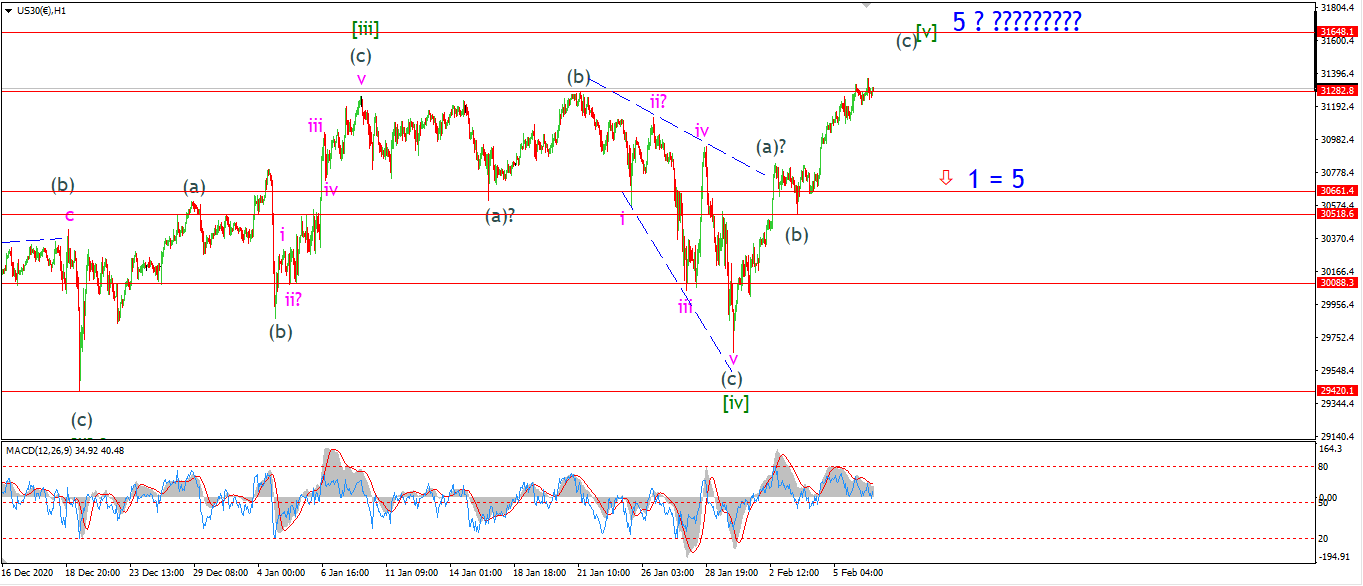
DOW 1hr.
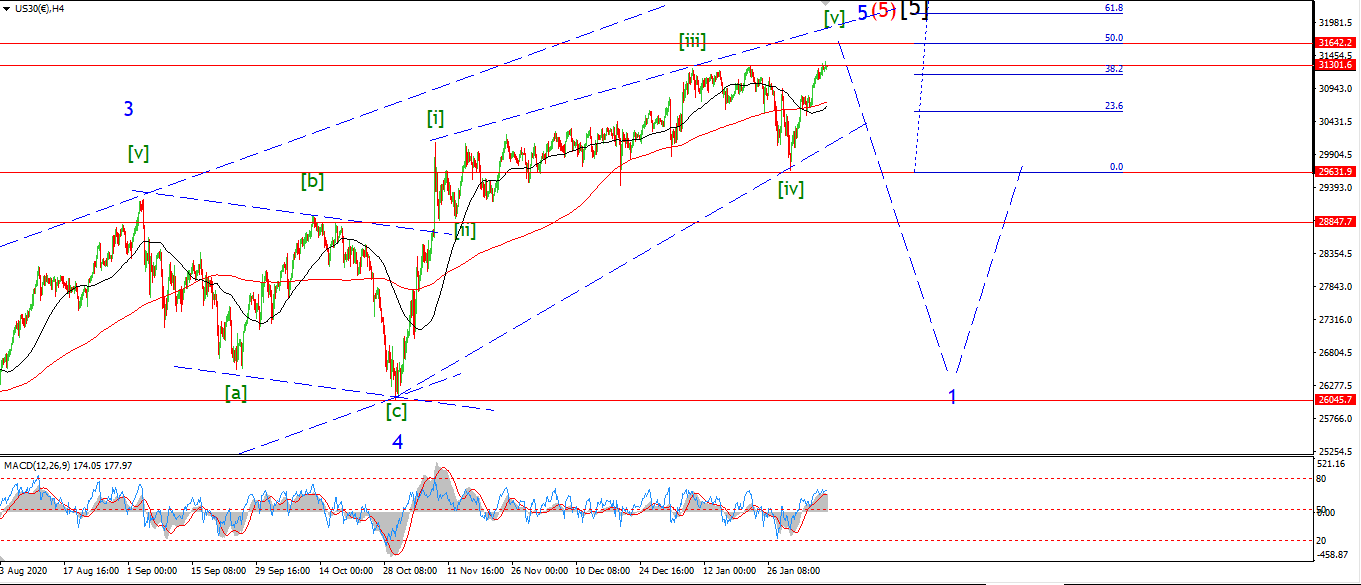
DOW 4hr
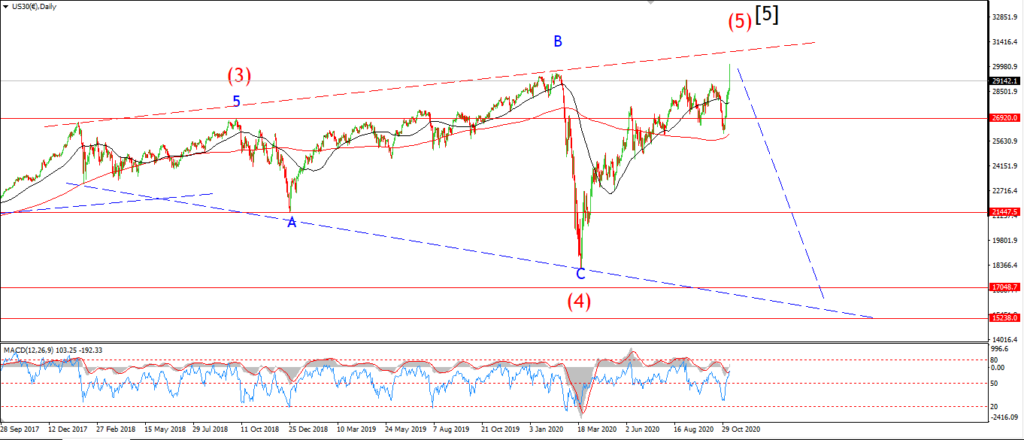
DOW daily.
The Dow did the inevitable today and broke out of the bearish pattern!
To put this move in context I want to look at the 4hr chart first this evening.
Believe it or not,
the rally in wave ‘5’ blue is still best viewed as an ending diagonal pattern.
The proportions of the internal waves are working out pretty well in this interpretation.
WAve [i] is the longest,
wave [iii] is almost 62% of wave [i],
and wave [v] is about to reach 50% of wave [i].
So we have a declining momentum off the low and a range contraction.
The declines in January are still viewed as a five wave pattern
and I now think that is wave (c) of [iv].
Wave [v] started of the lows last week.
and if wave [v] does reach 50% of wave [i] that gives us an initial target at 31640.
Tomorrow;
on the hourly chart.
Watch for wave (c) of [v] of ‘5’ to complete by Wednesday.
The price must hold above 30520 at the wave (b) low for this pattern to remain valid.
GOLD
GOLD 1hr.
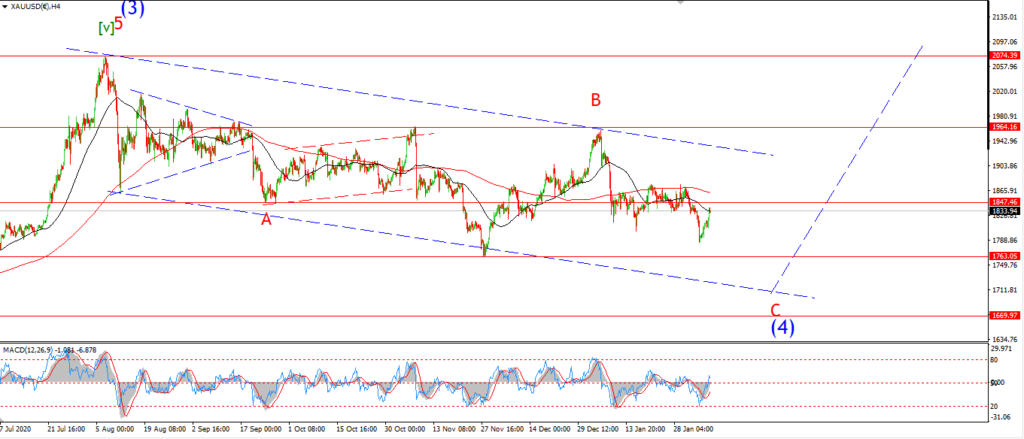
GOLD 4hr.
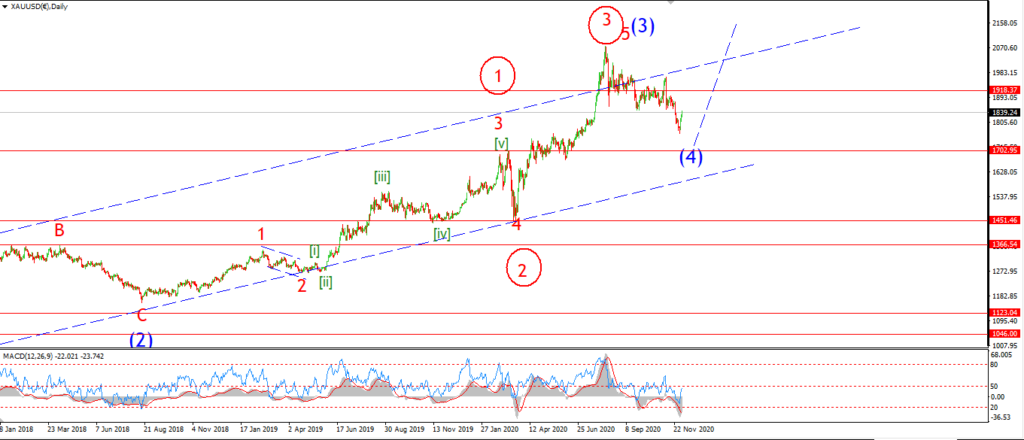
GOLD daily.
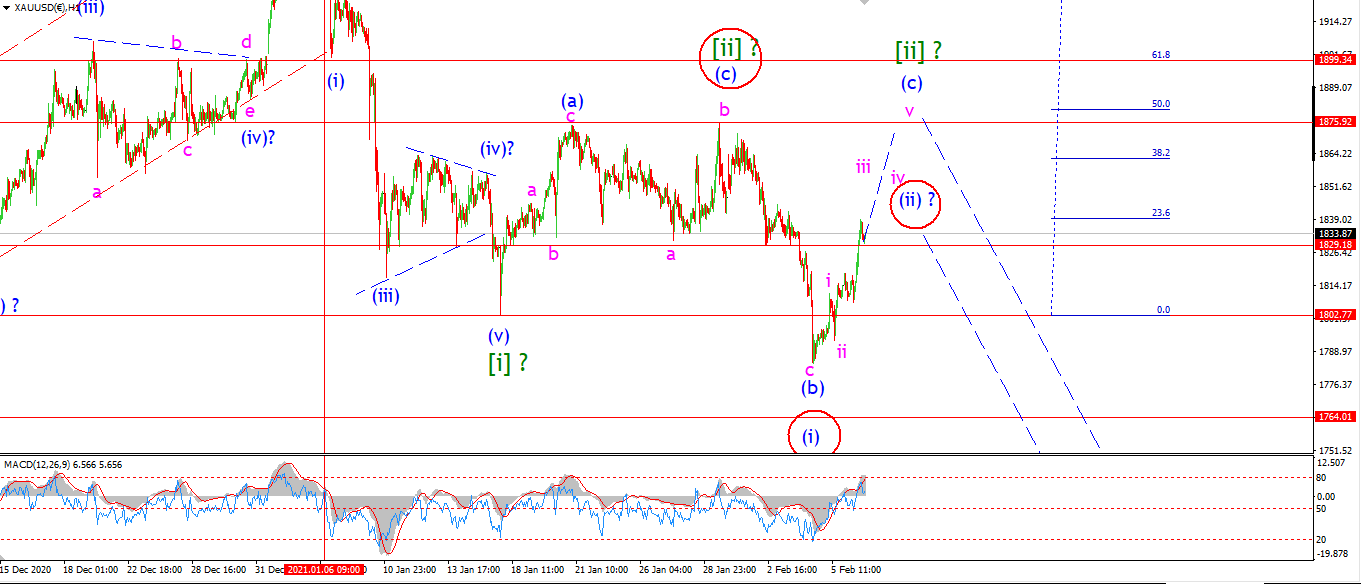
Gold rallied today to break above that 1829 invalidation line for the previous short term count.
The new wave count shows this rally as wave (c) of of a larger wave [ii].
If wave [ii] is an expanded flat correction,
then we will see a break of 1875 as shown.
If wave [ii] is a running flat correction,
then wave (c) will complete below 1975.
Tomorrow;
Watch for wave (c) to continue higher in a five wave pattern.
CRUDE OIL.
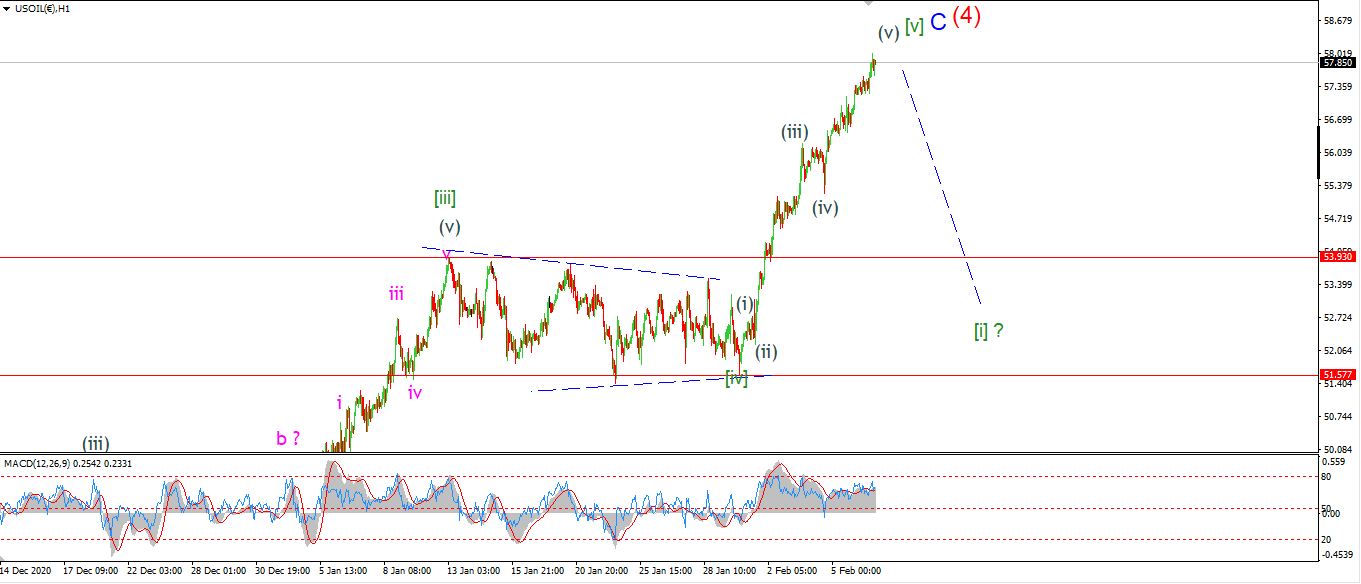
CRUDE OIL 1hr.
CRUDE OIL 4hr.
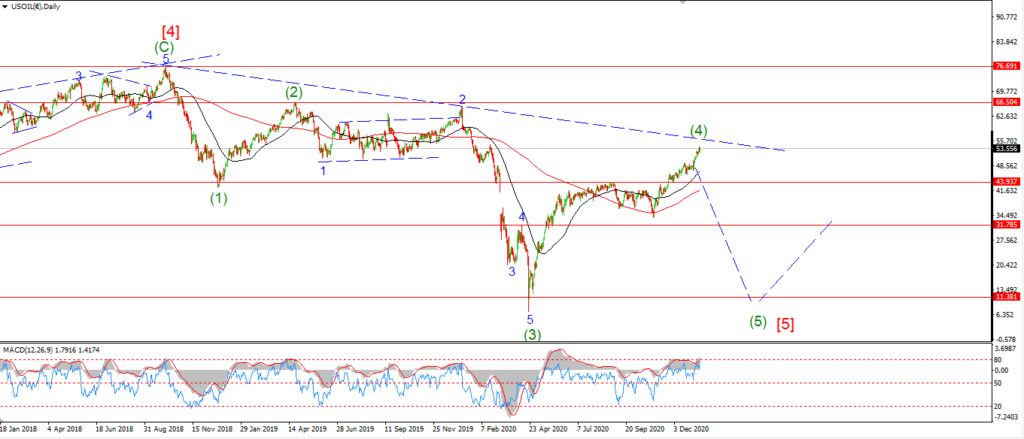
CRUDE OIL daily.
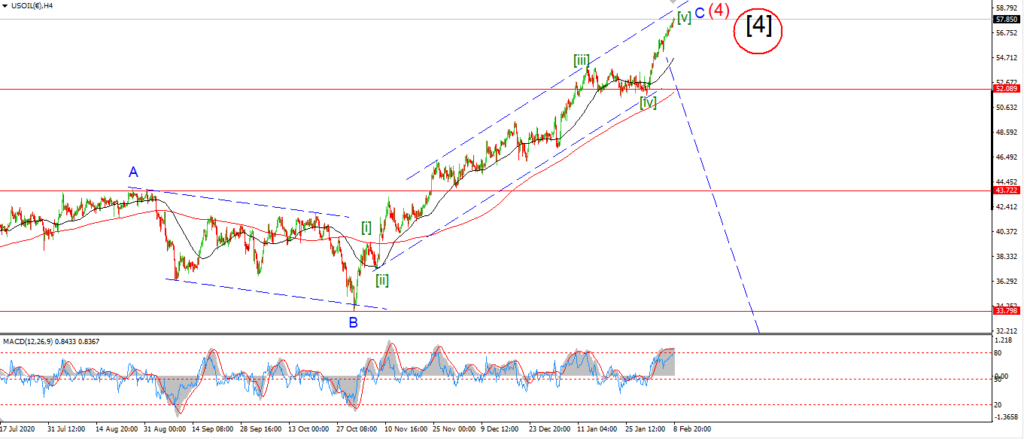
The 4hr chart in crude shows a completed five wave pattern in wave ‘C’ of (4) now.
This suggests the rally off the late October lows is now over,
and we can expect a reversal to begin this month.
The price has nearly filled the trend channel off the lows of wave ‘B’,
And the overall rally in wave (4) is a clear three wave form.
Of course positioning in the futures market reflects an extreme in sentiment again.
Small traders have hit the highest long position since 2018,
and this happens to be in the top three long positions of the last 11 years.
And this time is not different by the way,
the market will react the same way as it did in those previous extreme tops!
We are looking at a big move lower coming our way.
Tomorrow;
A move back into the price territory of the previous wave [iv] will signal wave [i] is underway.
S&P 500.
S&P 500 1hr
S&P 500 4hr
S&P 500 daily.
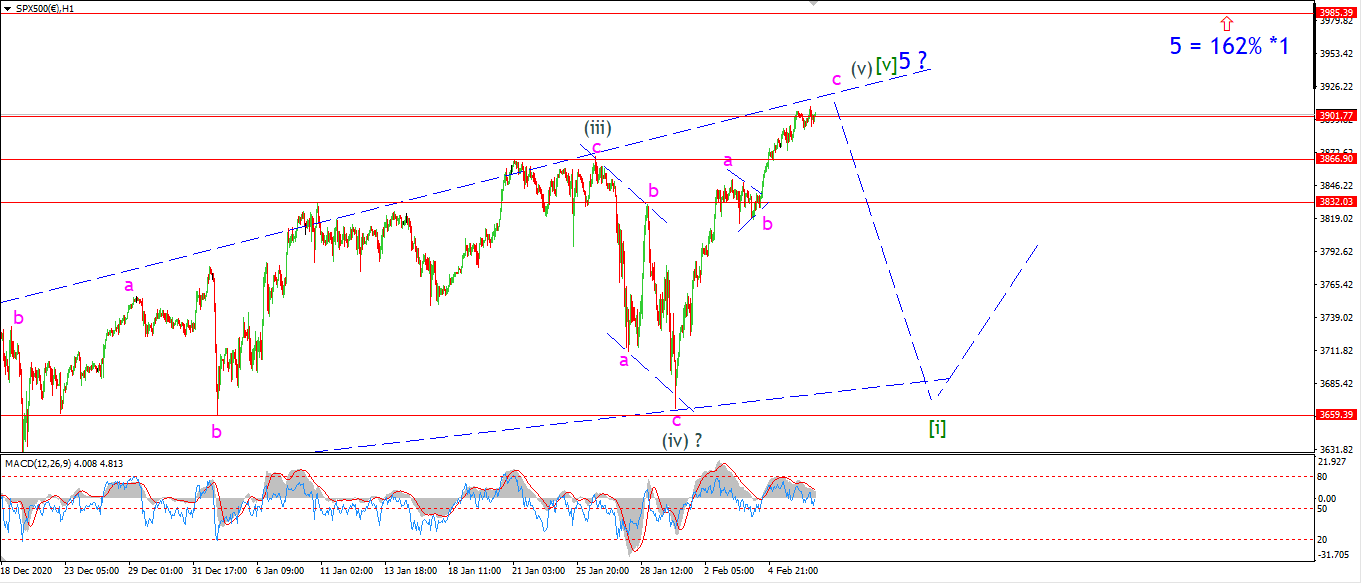
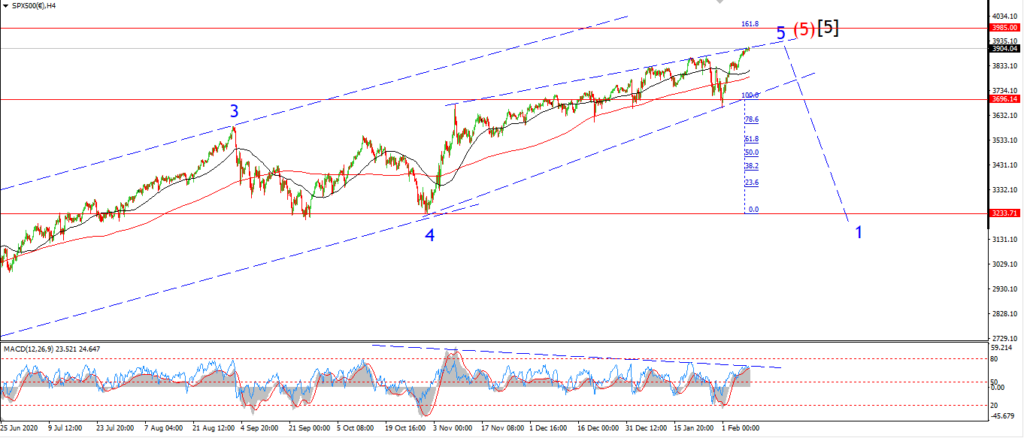
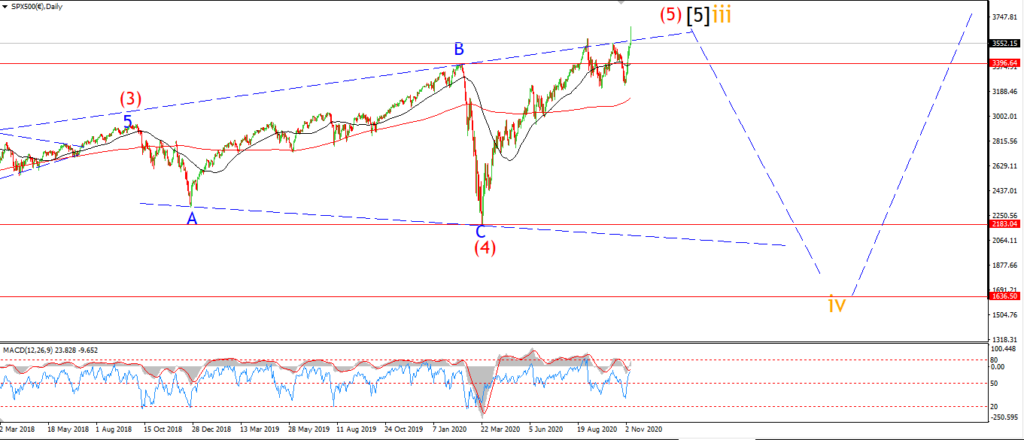
The S&P is just flirting with the upper trend line now as we approach the end of wave (v) of [v] again.
The price can always throw-over above that upper trend line to complete this wedge pattern,
and if that happens,
it will be well within the bounds of the main wave count.
It is very interesting to note on the 4hr chart,
the rally in wave ‘5’ blue will reach 162% of wave ‘1’ blue at 3985.
We are within a few good days of that level now.
And a throw-over into wave [v] will achieve that target also.
that level is worth watching.
Tomorrow;
Slowing momentum on all degrees of trend now are a warning signal to this rally in general.
But I will watch for a throw over above the upper trend line of the wedge to complete this pattern this week.
SILVER.
SILVER 1hr
SILVER 4hr.
SILVER daily.
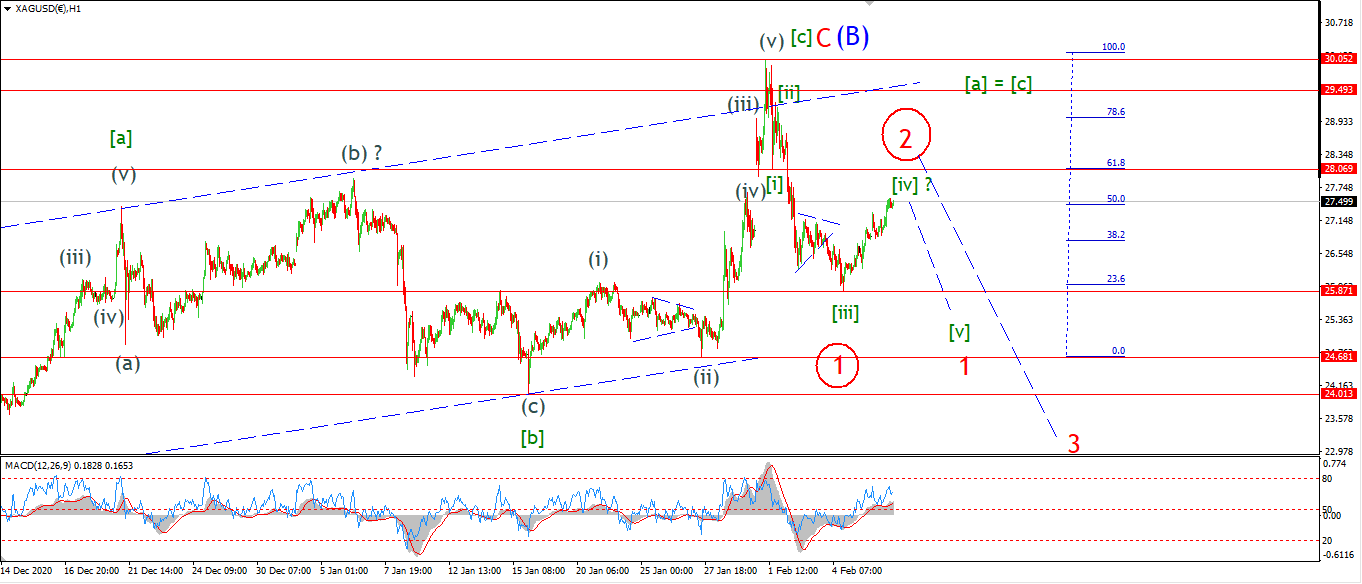
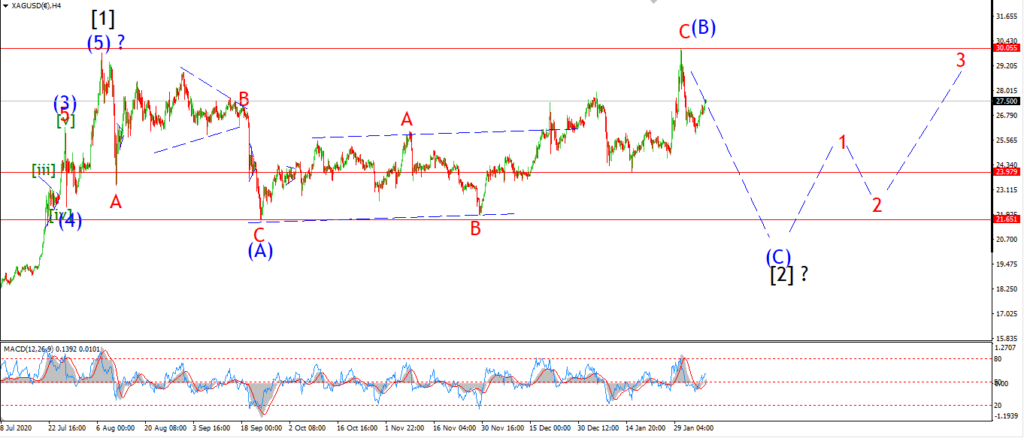
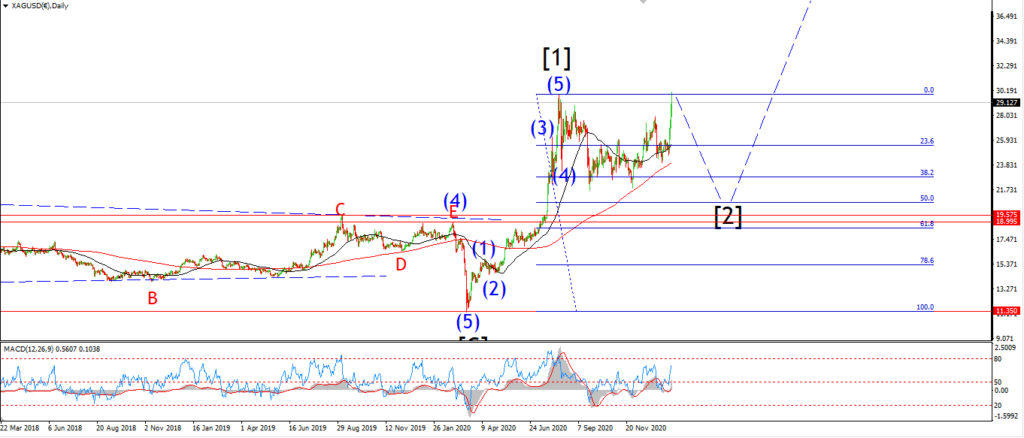
We have seen a reasonable rally in Silver over the last couple of days which opens up the alternate count.
The price is still viewed as a wave [iv] rally,
but the relative size of the move can be viewed as wave ‘2’ also in the alternate wave count.
The price must not reach above the 28.00 level for the main count to remain valid.
So if we do see a break of that level tomorrow,
that will trigger the alternate count and the action off the high will move up a degree as wave ‘1’ and ‘2’ as shown.
Tomorrow;
Watch for wave [iv] to hold below 28.00 and then decline again into wave [v] of ‘1’.
BITCOIN
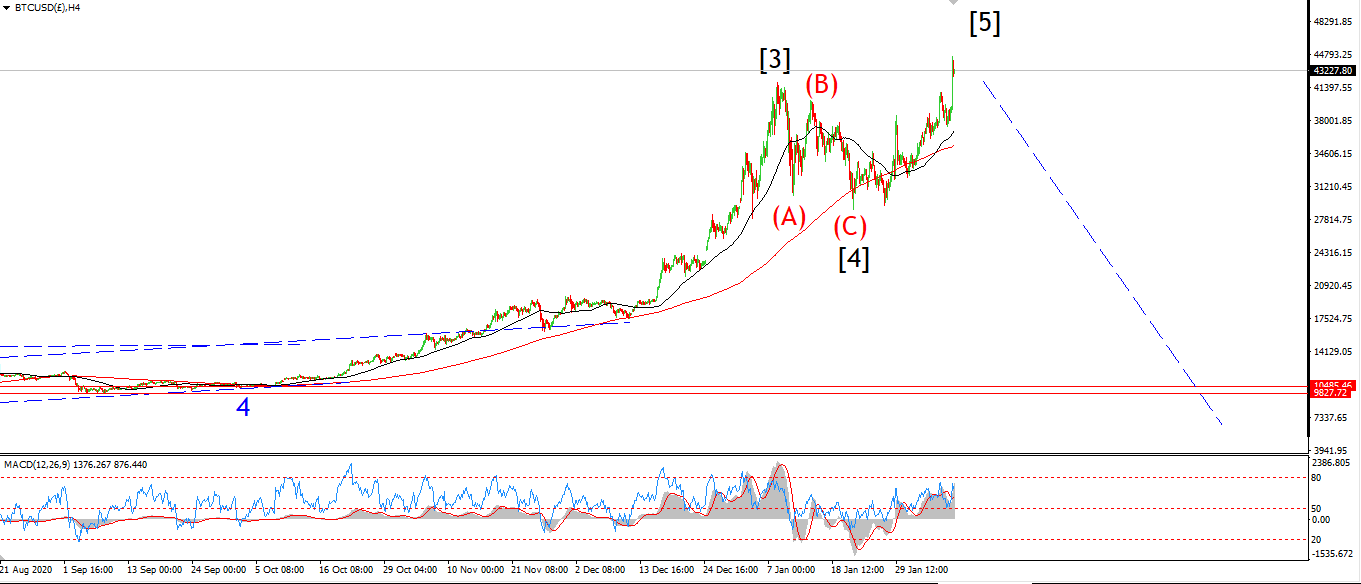
BITCOIN 1hr.
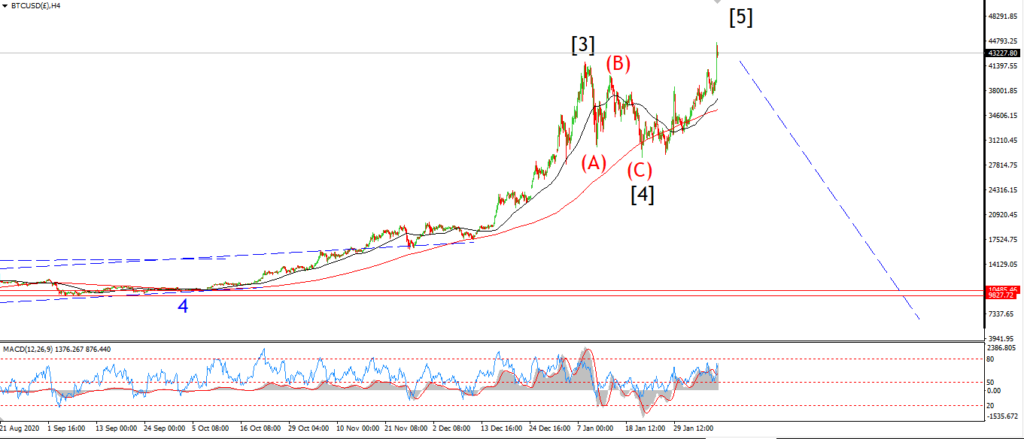
BITCOIN 4hr.
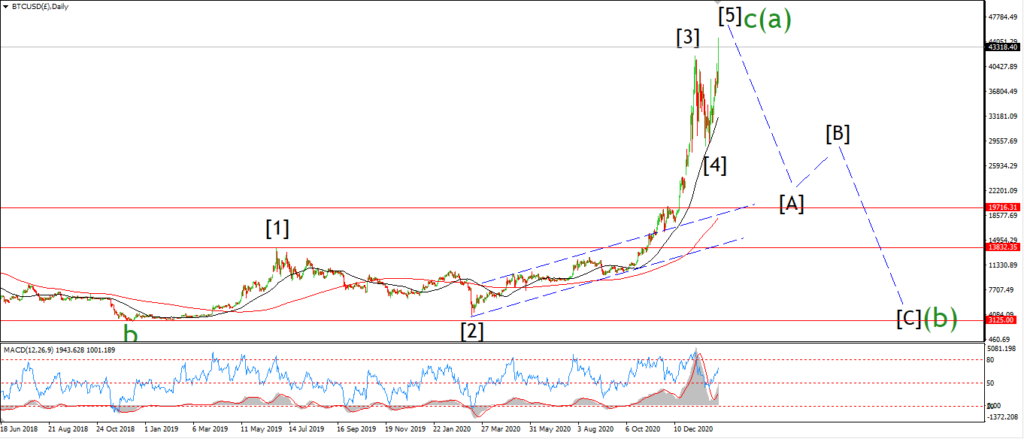
BITCOIN daily.
Topping in wave (a).
FTSE 100.
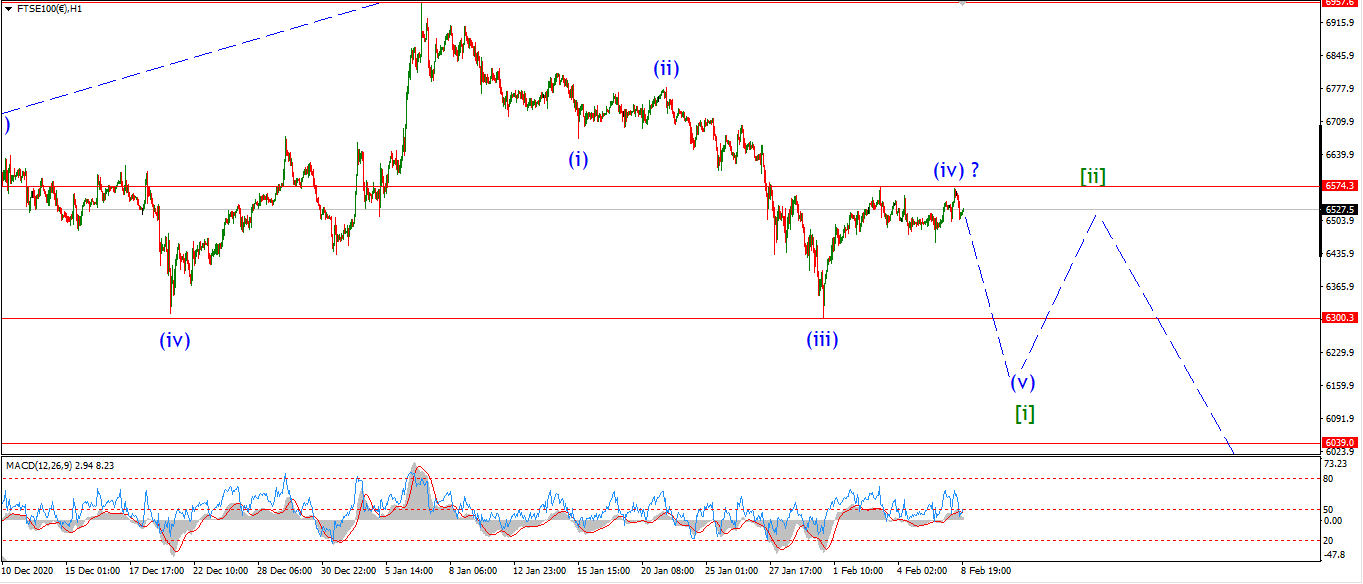
FTSE 100 1hr.
FTSE 100 4hr.
FTSE 100 daily.
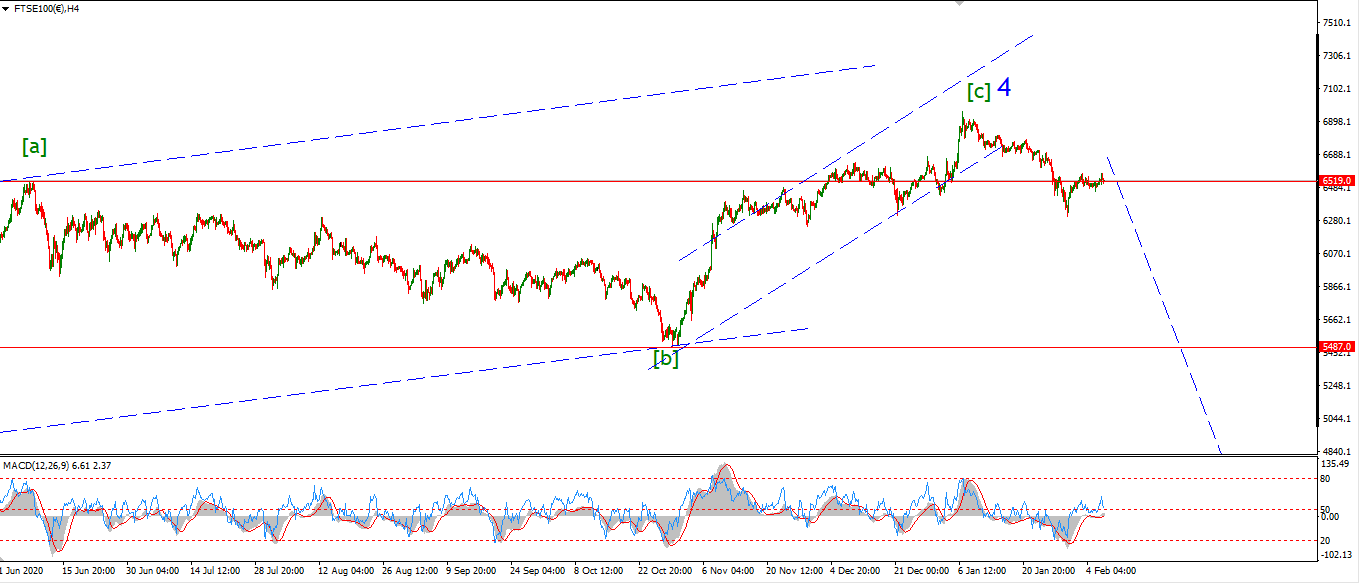
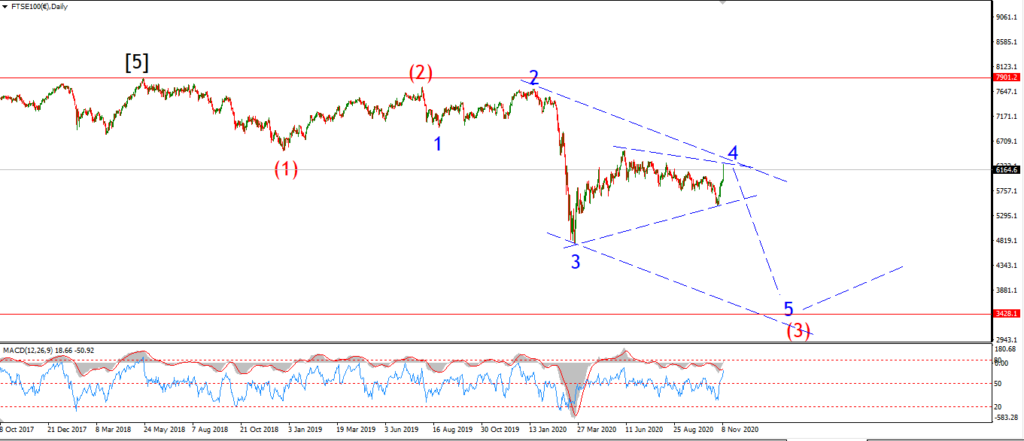
Completing a fourth wave.
DAX.
DAX 1hr
DAX 4hr
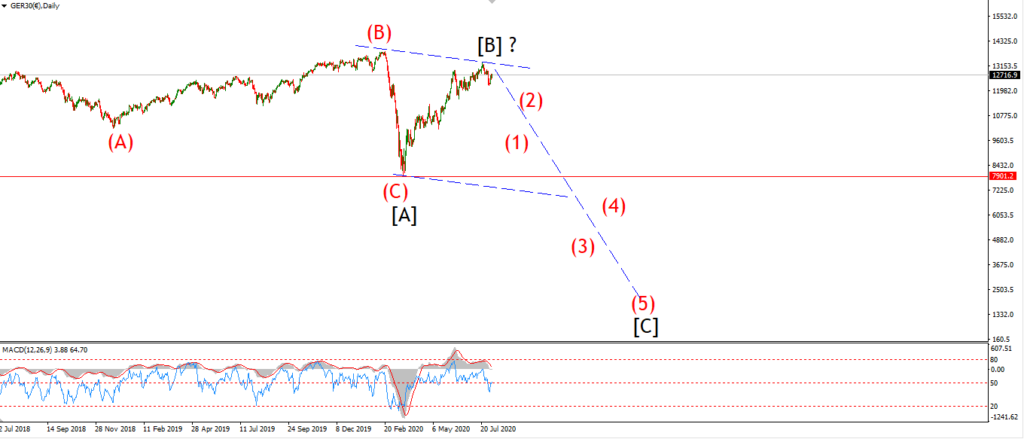
DAX daily.
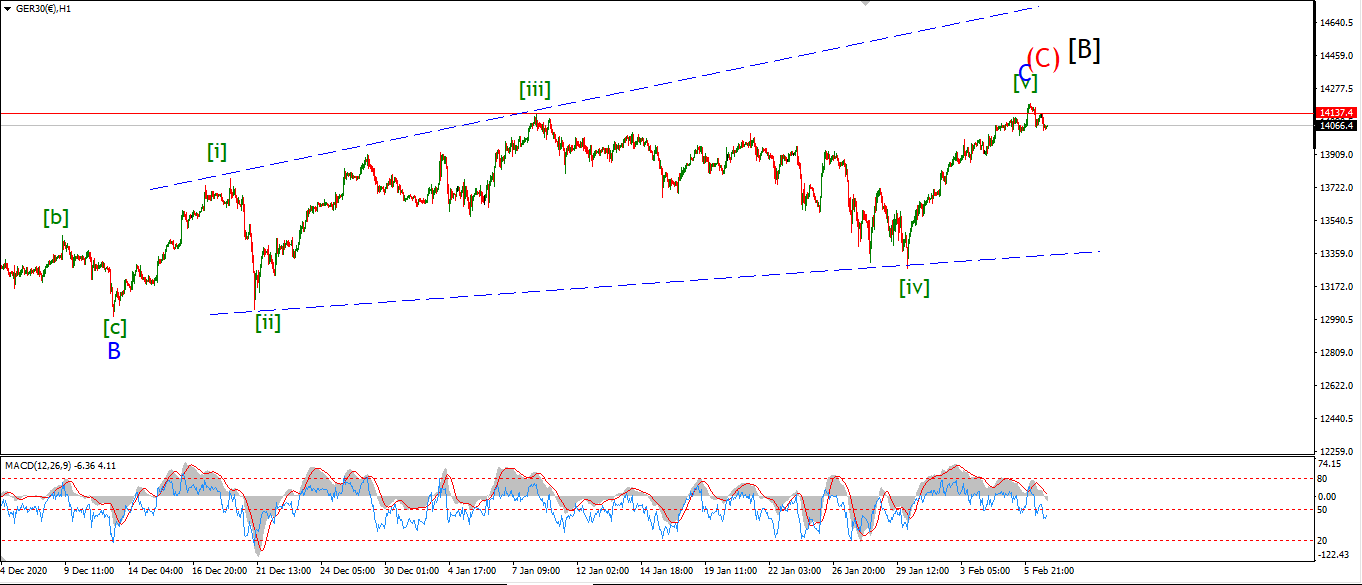
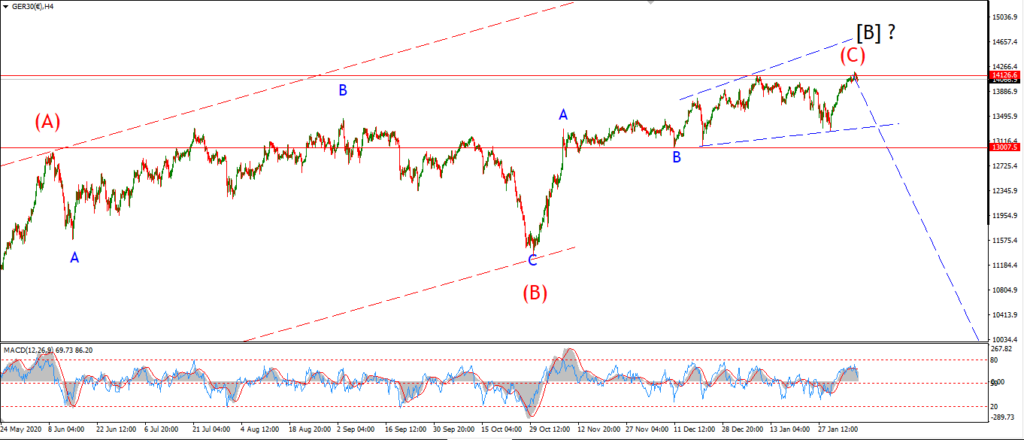
Topping out in wave [B].
NASDAQ 100.
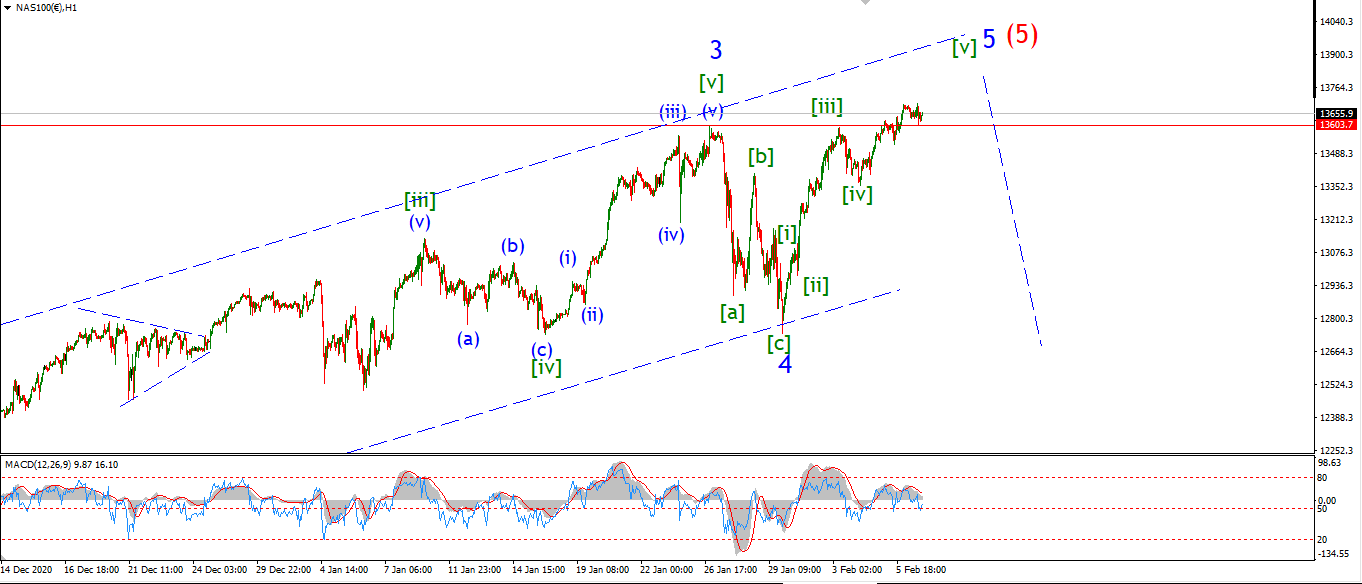
NASDAQ 1hr
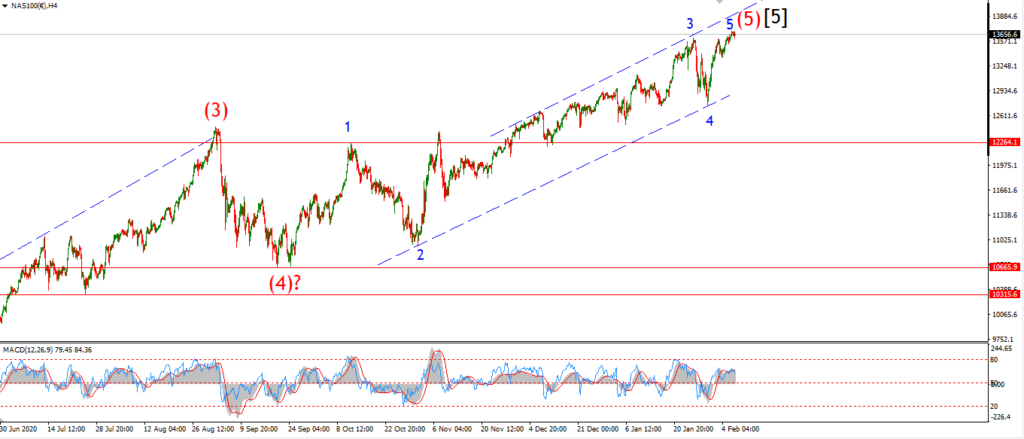
NASDAQ 4hr.
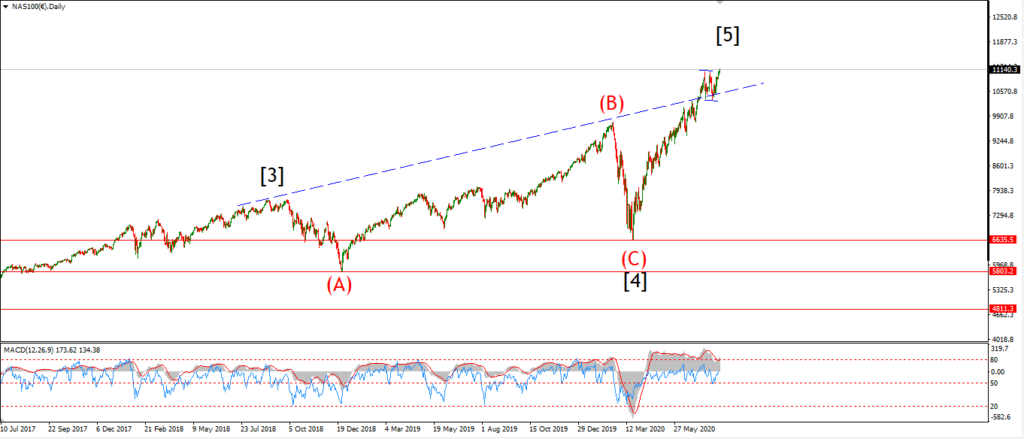
NASDAQ daily.
Topping out at all time high.