
[vc_row][vc_column][vc_separator border_width=”5″][/vc_column][/vc_row]
[vc_row][vc_column][vc_column_text]
Hello and welcome to the weekend.
[/vc_column_text][/vc_column][/vc_row]
[_s2If current_user_can(access_s2member_ccap_eurusd)]
[vc_row][vc_column][vc_separator border_width=”5″][/vc_column][/vc_row]
[vc_row][vc_column][vc_column_text]
EURUSD
[/vc_column_text][/vc_column][/vc_row]
[vc_row][vc_column][vc_separator border_width=”5″][/vc_column][/vc_row][vc_row][vc_column width=”2/3″][vc_custom_heading text=”1 hr” use_theme_fonts=”yes”][vc_column_text]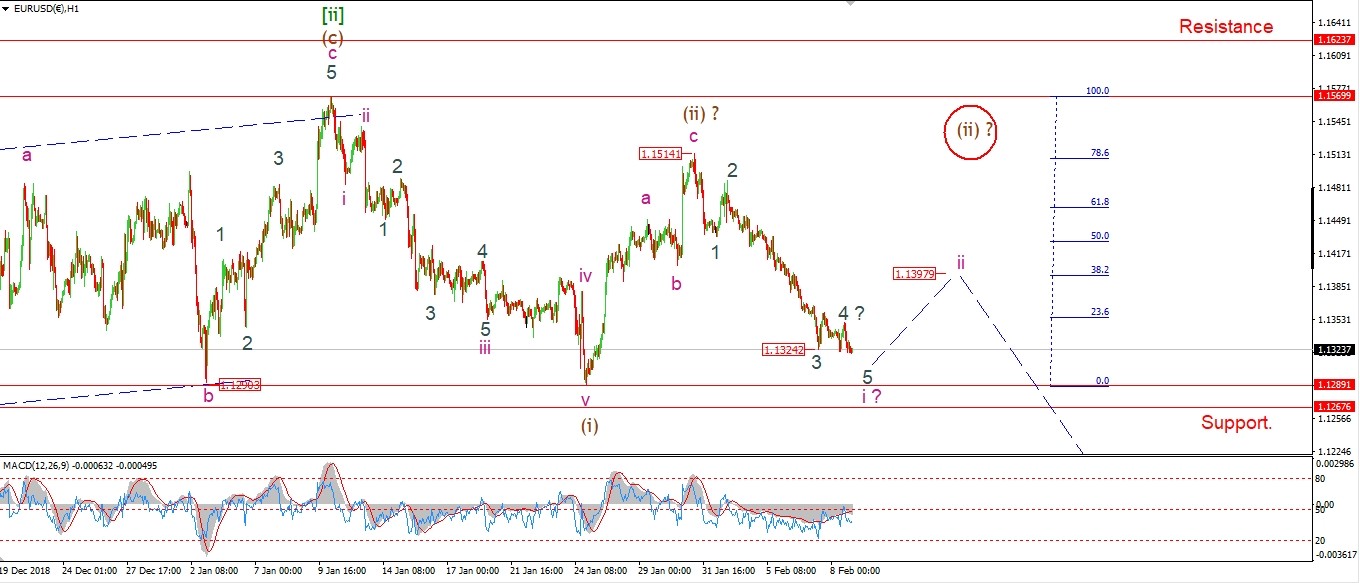 [/vc_column_text][/vc_column][vc_column width=”1/3″][vc_custom_heading text=”4 Hours” use_theme_fonts=”yes”][vc_column_text]
 [/vc_column_text][vc_custom_heading text=”Daily” use_theme_fonts=”yes”][vc_column_text]
 [/vc_column_text][/vc_column][/vc_row]
[vc_row][vc_column][vc_column_text]
Wave ‘4’ did break out to a larger running flat correction today.
the price is back down at the lows again,
so I am counting this as wave ‘5’ of ‘i’.
Wave ‘i’ may even break support at 1.1289 to complete.
That would really add weight to the bearish count.
Next week;
We should expect a three wave recovery early next week either way.
that should carry back to the 1.1400 level again.
If this plays out we will have a bearish impulse wave in place,
and we can then prepare for a larger move lower in wave ‘iii’ of (iii).
[/vc_column_text][/vc_column][/vc_row]
[/_s2If]
[_s2If current_user_can(access_s2member_ccap_gbpusd)]
[vc_row][vc_column][vc_separator border_width=”5″][/vc_column][/vc_row][vc_row][vc_column][vc_column_text]
GBPUSD
[/vc_column_text][/vc_column][/vc_row][vc_row][vc_column][vc_separator border_width=”5″][/vc_column][/vc_row][vc_row][vc_column width=”2/3″][vc_custom_heading text=”1 hr” use_theme_fonts=”yes”][vc_column_text]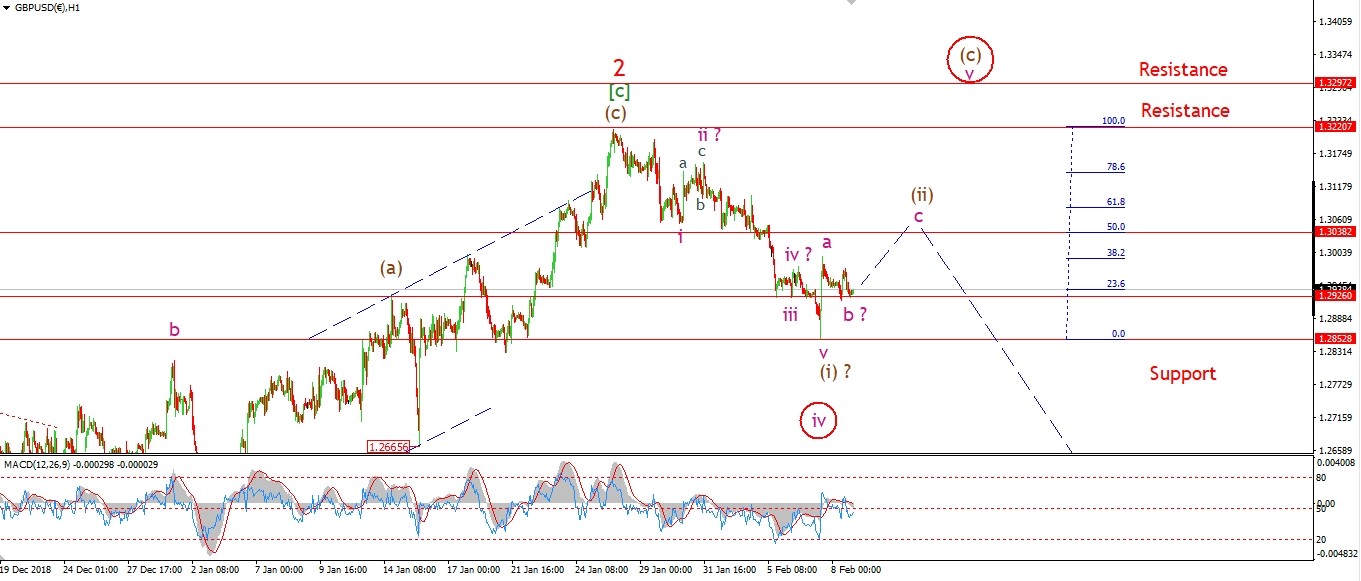 [/vc_column_text][/vc_column][vc_column width=”1/3″][vc_custom_heading text=”4 Hours” use_theme_fonts=”yes”][vc_column_text]
 [/vc_column_text][vc_custom_heading text=”Daily” use_theme_fonts=”yes”][vc_column_text]
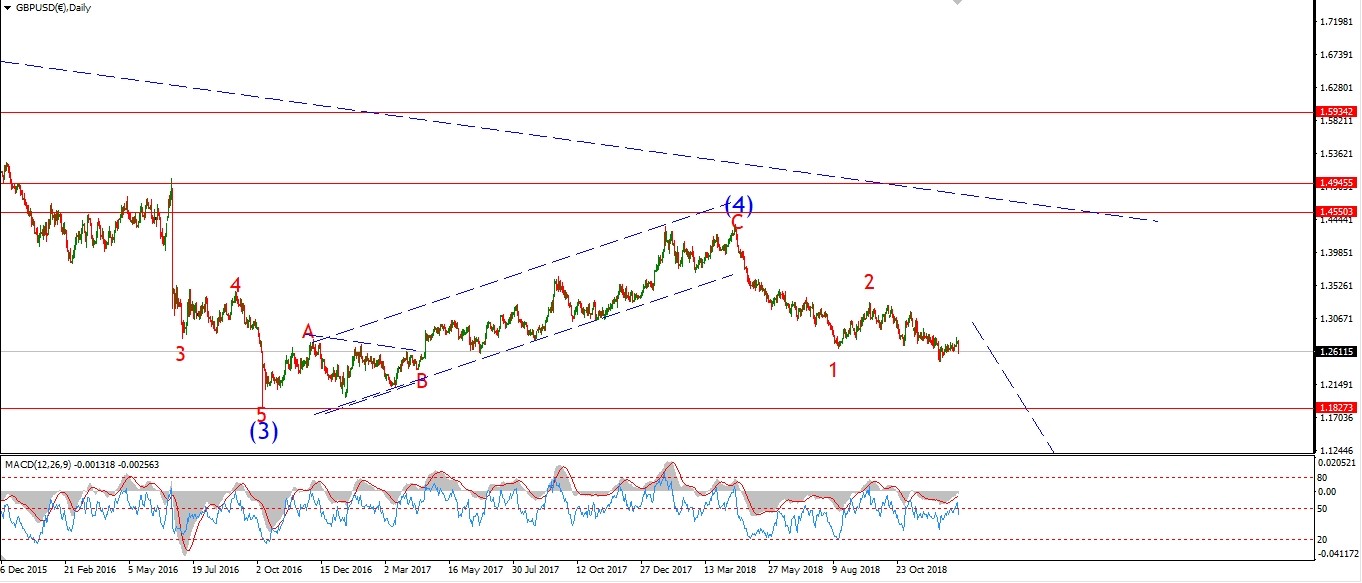 [/vc_column_text][/vc_column][/vc_row]
[vc_row][vc_column][vc_column_text]
Cable has traced out a five wave move lower in wave (i) this week.
The price has rebounded to begin wave (ii) over the last few sessions.
Wave ‘a’ and ‘b’ seem to be near to complete now,
Wave ‘c’ higher will come in by Monday evening I expect.
And similar to EURUSD,
we will then have another bearish impulse wave in place.
And then wave (iii) lower should accelerate lower back towards 1.2400 again.
Monday;
Watch for wave ‘c’ of (ii) to complete at about 1.3038,
the 50% retracement level.
[/vc_column_text][/vc_column][/vc_row]
[/_s2If]
[_s2If current_user_can(access_s2member_ccap_usdjpy)]
[vc_row][vc_column][vc_separator border_width=”5″][/vc_column][/vc_row][vc_row][vc_column][vc_column_text]
USDJPY
[/vc_column_text][/vc_column][/vc_row][vc_row][vc_column][vc_separator border_width=”5″][/vc_column][/vc_row][vc_row][vc_column width=”2/3″][vc_custom_heading text=”1 hr” use_theme_fonts=”yes”][vc_column_text]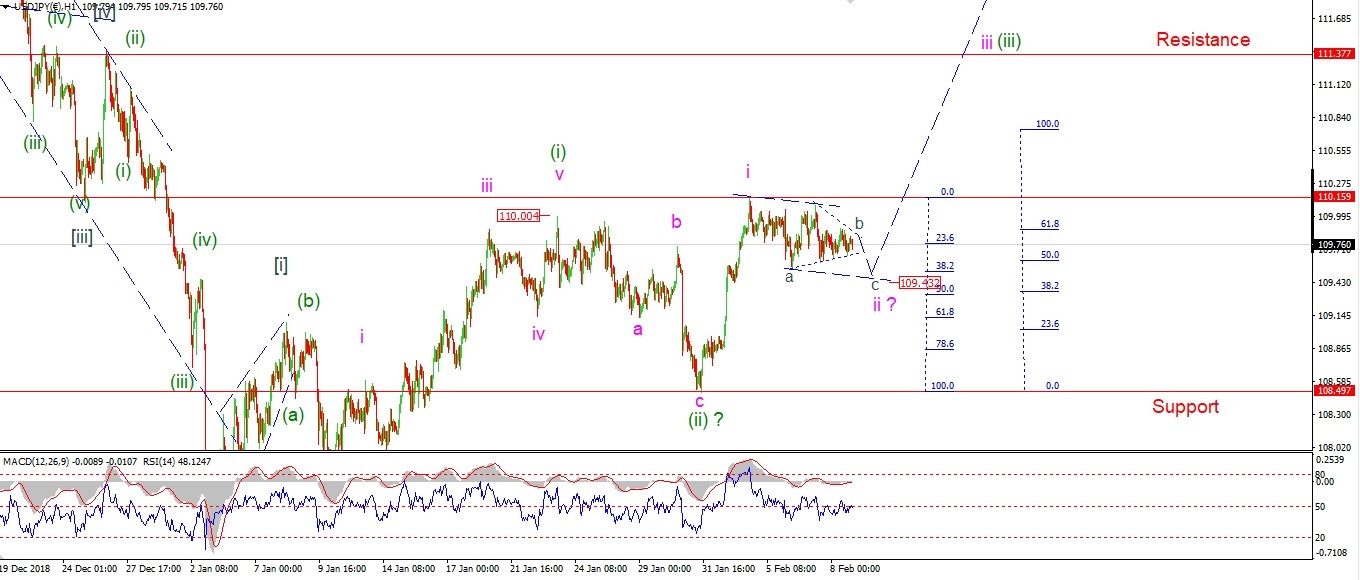 [/vc_column_text][/vc_column][vc_column width=”1/3″][vc_custom_heading text=”4 Hours” use_theme_fonts=”yes”][vc_column_text]
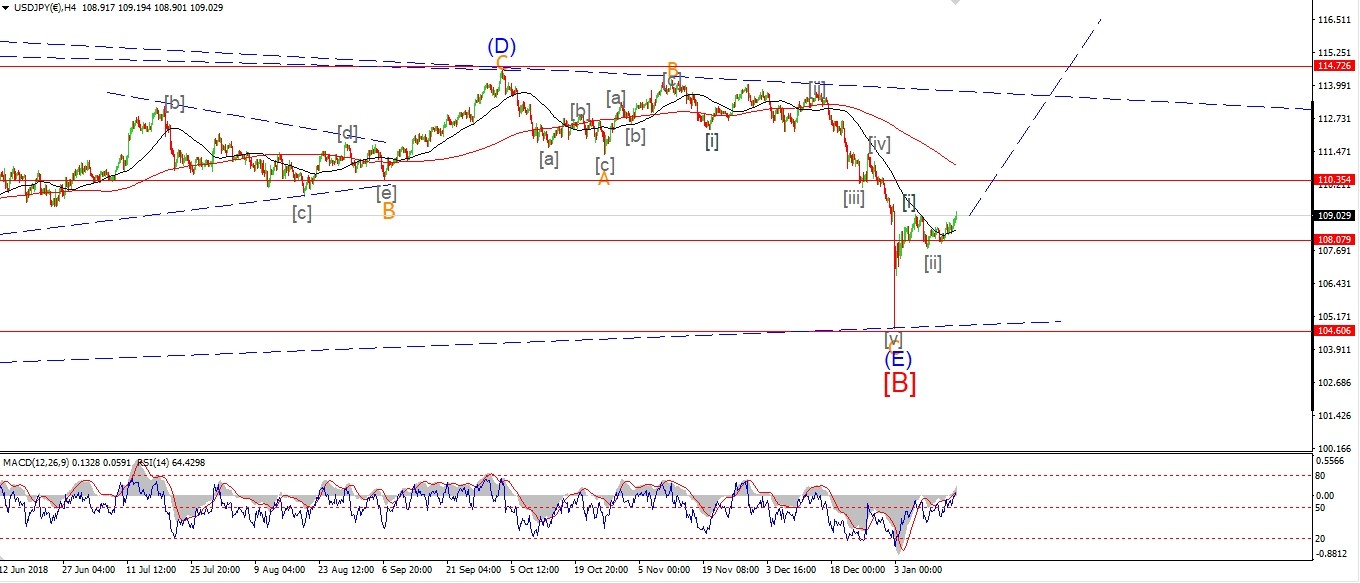 [/vc_column_text][vc_custom_heading text=”Daily” use_theme_fonts=”yes”][vc_column_text]
 [/vc_column_text][/vc_column][/vc_row]
[vc_row][vc_column][vc_column_text]
After completing five waves up in wave ‘i’ pink this week.
USDJPY continues to trod along in a corrective fashion off that high.
The price has contracted further today in a possible triangle ‘b’ wave within wave ‘ii’.
This suggests another drop into the trend channel again at about 109.40 to complete wave ‘ii’.
Monday;
Watch for that drop in wave ‘c’ to arrive.
It should be a quick affair,
and wave ‘iii’ of (iii) should be well underway by Tuesday evening.
[/vc_column_text][/vc_column][/vc_row]
[/_s2If]
[_s2If current_user_can(access_s2member_ccap_dow_jones)]
[vc_row][vc_column][vc_separator border_width=”5″][/vc_column][/vc_row][vc_row][vc_column][vc_column_text]
DOW JONES INDUSTRIALS
[/vc_column_text][/vc_column][/vc_row][vc_row][vc_column][vc_separator border_width=”5″][/vc_column][/vc_row][vc_row][vc_column width=”2/3″][vc_custom_heading text=”1 hr” use_theme_fonts=”yes”][vc_column_text]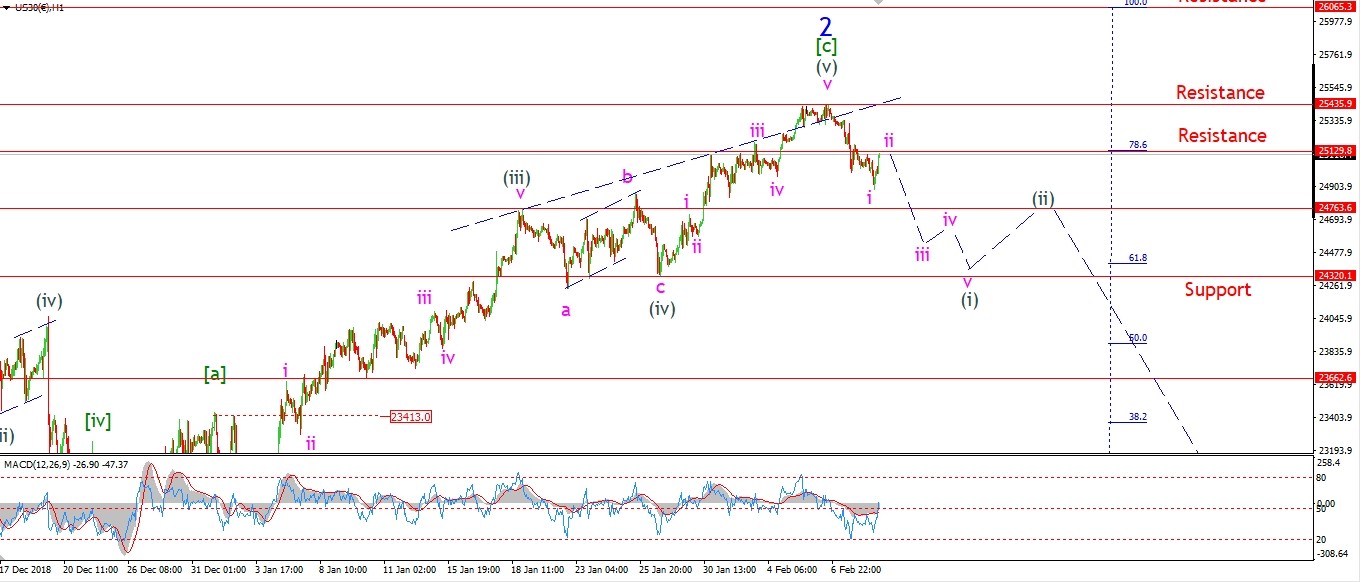 [/vc_column_text][/vc_column][vc_column width=”1/3″][vc_custom_heading text=”4 Hours” use_theme_fonts=”yes”][vc_column_text]
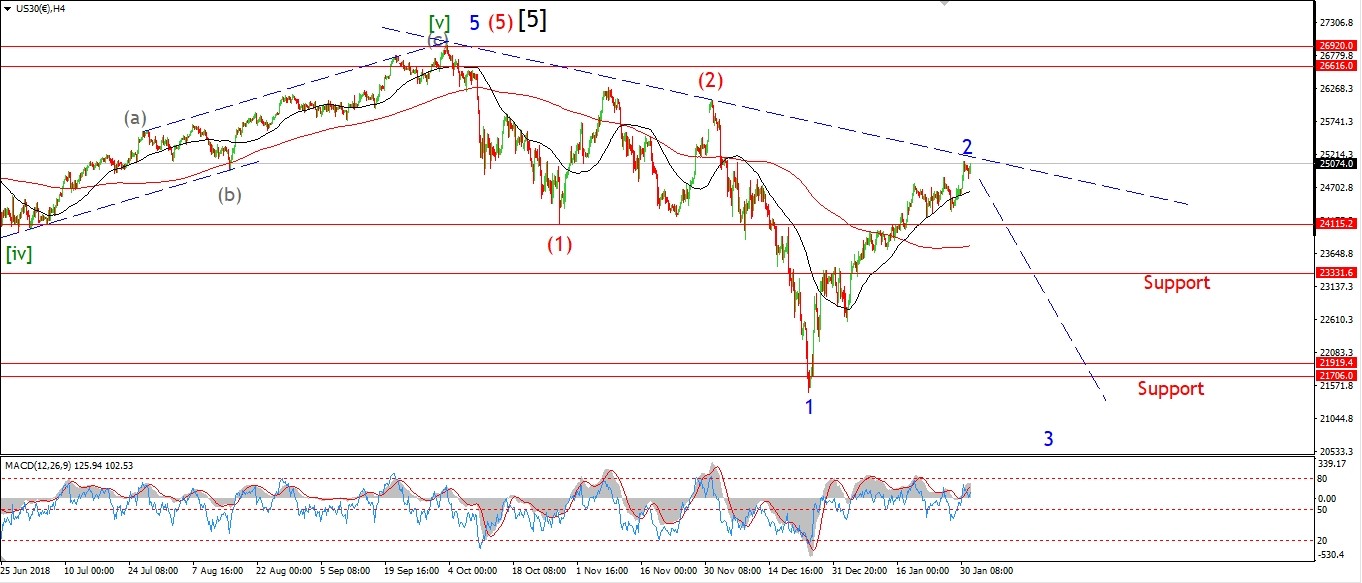 [/vc_column_text][vc_custom_heading text=”Daily” use_theme_fonts=”yes”][vc_column_text]
 [/vc_column_text][/vc_column][/vc_row]
[vc_row][vc_column][vc_column_text]
The market has rebounded again this evening as we approach the close.
I have labelled this a possible wave ‘ii’ of (i).
If this short term count is correct,
Then wave ‘iii’ down should begin by monday evening.
I am optimistic that we have seen the turn we are waiting for this week.
But we need that confirming price action to play out.
Next week;
Wave (i) down should break support at the previous wave (iv) grey.
Watch for wave ‘iii’ of ‘i’ to begin next week.
[/vc_column_text][/vc_column][/vc_row]
[/_s2If]
[_s2If current_user_can(access_s2member_ccap_gold)]
[vc_row][vc_column][vc_separator border_width=”5″][/vc_column][/vc_row][vc_row][vc_column][vc_column_text]
GOLD
[/vc_column_text][/vc_column][/vc_row][vc_row][vc_column][vc_separator border_width=”5″][/vc_column][/vc_row][vc_row][vc_column width=”2/3″][vc_custom_heading text=”1 hr” use_theme_fonts=”yes”][vc_column_text]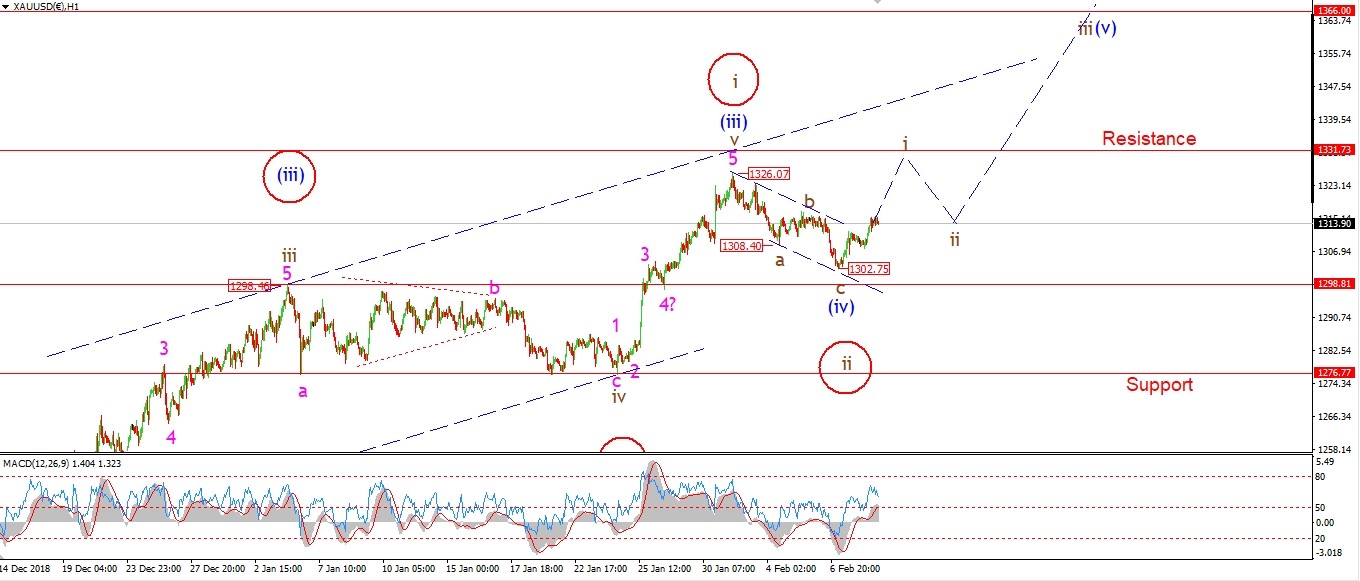 [/vc_column_text][/vc_column][vc_column width=”1/3″][vc_custom_heading text=”4 Hours” use_theme_fonts=”yes”][vc_column_text]
 [/vc_column_text][vc_custom_heading text=”Daily” use_theme_fonts=”yes”][vc_column_text]
 [/vc_column_text][/vc_column][/vc_row]
[vc_row][vc_column][vc_column_text]
Gold has hit that lower trendline at 1302
and risen off that level throughout todays session.
So far the rise is in three waves,
wave ‘i’ of (v) needs to develop further in a clear five wave pattern
in order to indicate that wave (iv) blue is infact complete.
There is the possibility that the move off the high
is simply wave ‘a’ of a larger wave (iv).
We can only wait and see on that front.
Tomorrow;
Watch for wave ‘i’ to continue higher in a clear five waves.
[/vc_column_text][/vc_column][/vc_row]
[/_s2If]
[_s2If current_user_can(access_s2member_ccap_crude)]
[vc_row][vc_column][vc_separator border_width=”5″][/vc_column][/vc_row][vc_row][vc_column][vc_column_text]
U.S CRUDE OIL
[/vc_column_text][/vc_column][/vc_row][vc_row][vc_column][vc_separator border_width=”5″][/vc_column][/vc_row][vc_row][vc_column width=”2/3″][vc_custom_heading text=”1 hr” use_theme_fonts=”yes”][vc_column_text]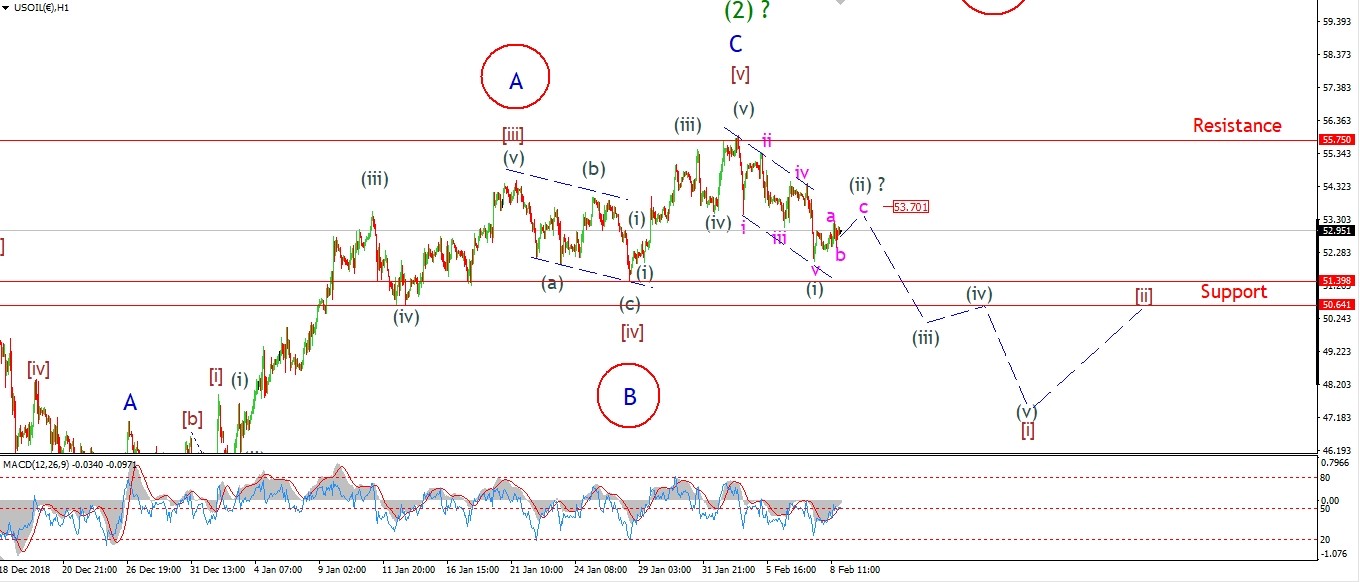 [/vc_column_text][/vc_column][vc_column width=”1/3″][vc_custom_heading text=”4 Hours” use_theme_fonts=”yes”][vc_column_text]
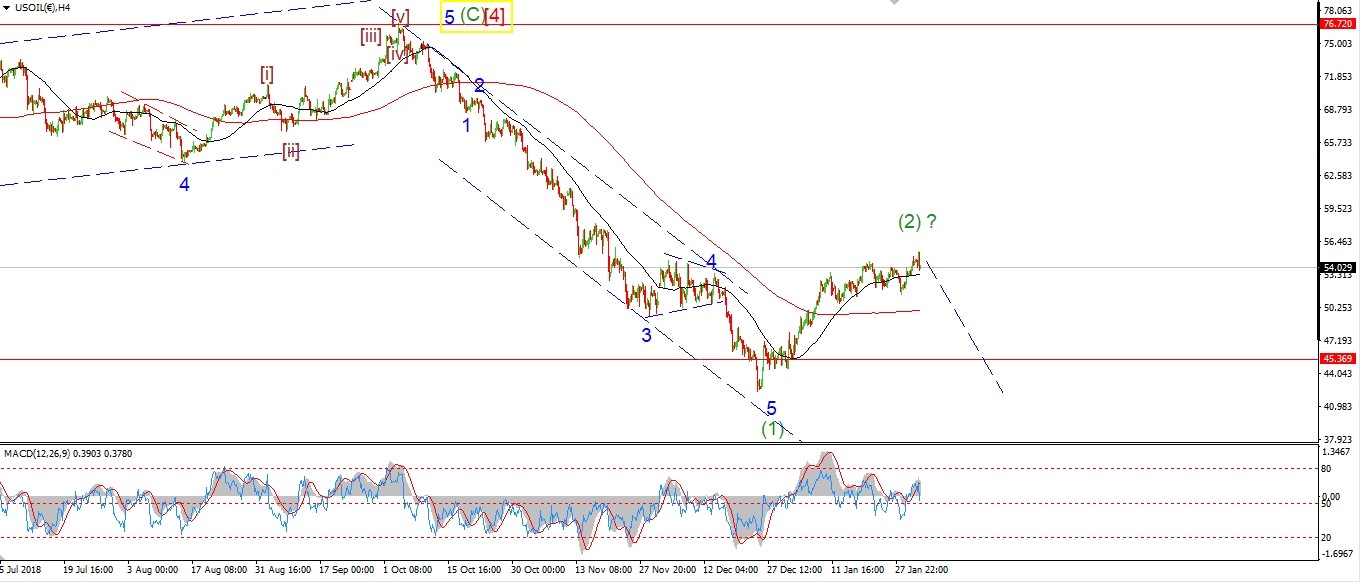 [/vc_column_text][vc_custom_heading text=”Daily” use_theme_fonts=”yes”][vc_column_text]
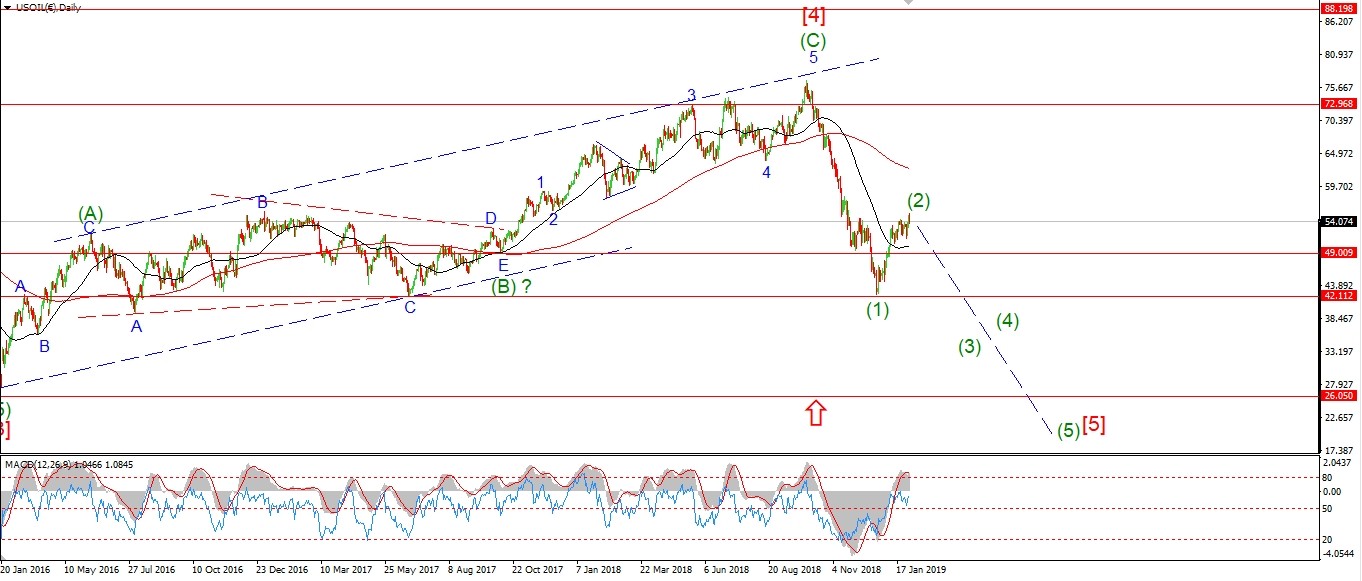 [/vc_column_text][/vc_column][/vc_row]
[vc_row][vc_column][vc_column_text]
I have taken another approach this evening to the developing decline of the high.
It is now labelled as a leading diagonal wave (i).
Off Thursdays low there is a three wave rise into todays high,
this could be wave ‘a’ of (ii).
With a drop in wave ‘b’ underway and wave ‘c’ yet to come.
If the market turns lower to break support on Monday,
that will signal that wave (ii) is done and wave (iii) down has begun.
Next week;
the high at 55.75 must remain intact as wave (ii) completes.
Watch for wave (iii) down to come in by Tuesdays session.
[/vc_column_text][/vc_column][/vc_row]
[/_s2If]
[_s2If current_user_can(access_s2member_ccap_us10yr)]
[vc_row][vc_column][vc_separator border_width=”5″][/vc_column][/vc_row][vc_row][vc_column][vc_column_text]
US 10 yr Treasuries.
[/vc_column_text][/vc_column][/vc_row][vc_row][vc_column][vc_separator border_width=”5″][/vc_column][/vc_row][vc_row][vc_column width=”2/3″][vc_custom_heading text=”1 hr” use_theme_fonts=”yes”][vc_column_text]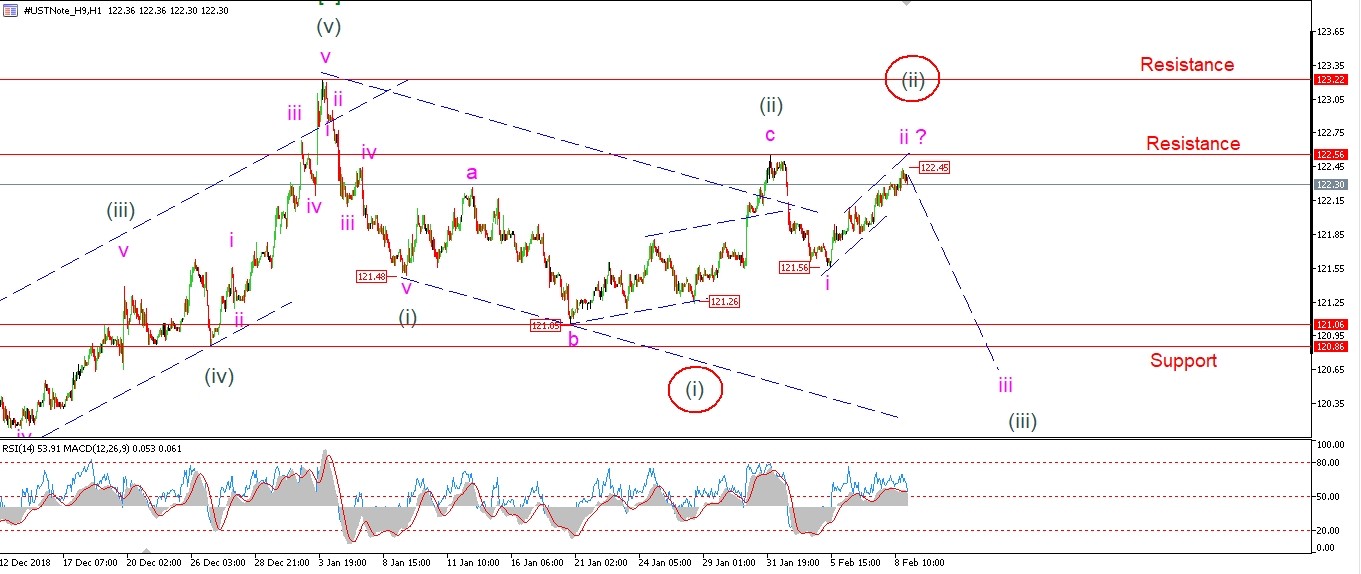 [/vc_column_text][/vc_column][vc_column width=”1/3″][vc_custom_heading text=”4 Hours” use_theme_fonts=”yes”][vc_column_text]
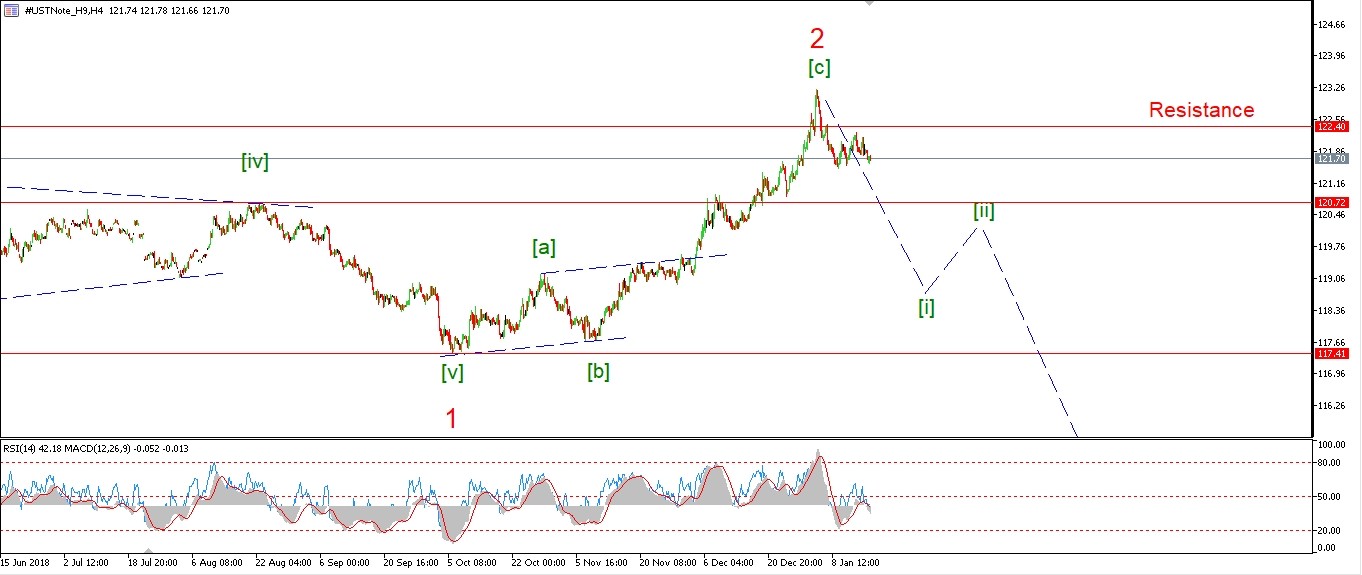 [/vc_column_text][vc_custom_heading text=”Daily” use_theme_fonts=”yes”][vc_column_text]
 [/vc_column_text][/vc_column][/vc_row]
[vc_row][vc_column][vc_column_text]
The 10YR kept rising through the session today which calls into question the short term count.
So far the current wave count is still valid,
and wave ‘iii’ can begin Monday to push lower again.
But;
I have shown a possible alternate count with a truncated fifth wave to complete wave (i) grey,
In this case,
wave (ii) is still underway
and it allows for a break of the 122.56 high again
to complete a larger three wave move.
If the market continues up to break 123.22 next week,
that will trigger the alternate count on the daily chart.
Monday;
Watch for wave ‘iii’ to begin immediately.
A break of 121.56 will confirm wave ‘iii’ down has begun.
[/vc_column_text][/vc_column][/vc_row]
[/_s2If]
[_s2If current_user_can(access_s2member_ccap_silver)]
[vc_row][vc_column][vc_separator border_width=”5″][/vc_column][/vc_row][vc_row][vc_column][vc_column_text]
SILVER
[/vc_column_text][/vc_column][/vc_row][vc_row][vc_column][vc_separator border_width=”5″][/vc_column][/vc_row][vc_row][vc_column width=”2/3″][vc_custom_heading text=”1 hr” use_theme_fonts=”yes”][vc_column_text]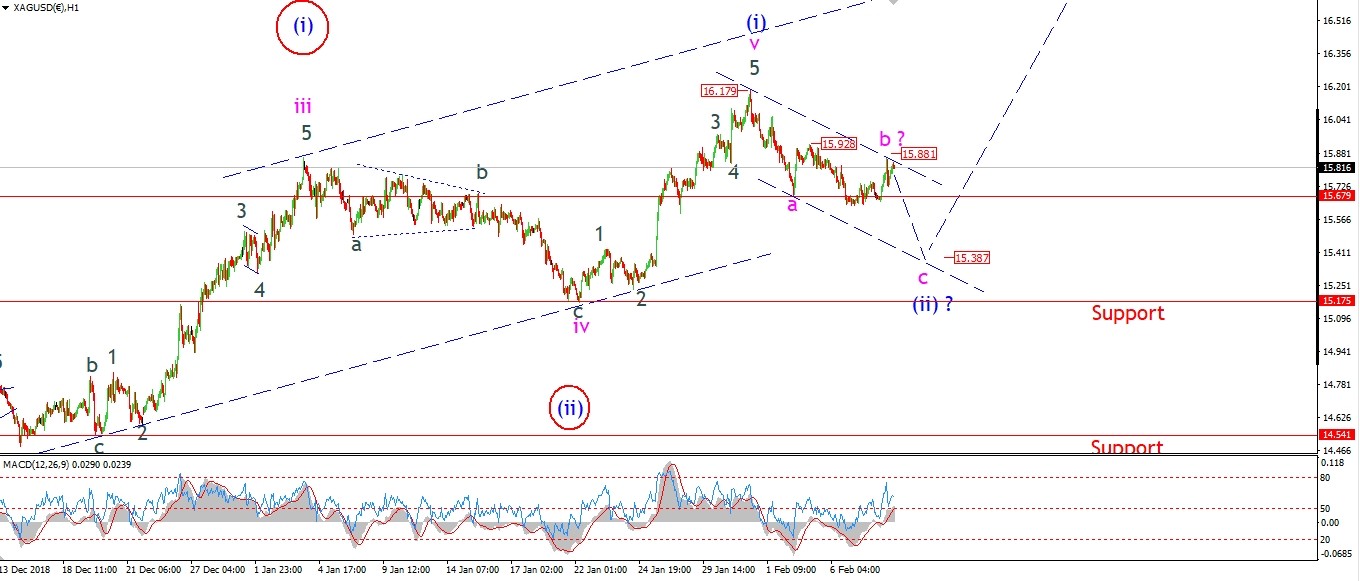 [/vc_column_text][/vc_column][vc_column width=”1/3″][vc_custom_heading text=”4 Hours” use_theme_fonts=”yes”][vc_column_text]
 [/vc_column_text][vc_custom_heading text=”Daily” use_theme_fonts=”yes”][vc_column_text]
 [/vc_column_text][/vc_column][/vc_row]
[vc_row][vc_column][vc_column_text]
I dont think wave (ii) blue is complete just yet
even though we have seen a three wave decline.
The action in wave ‘b’ looks more like a running flat.
This accounts for the break of the wave ‘a’ low
and the rise to a lower high today.
Wave ‘c’ should drop once more back towards the 15.40 area to fill the trend channel.
The price will then find support at the previous wave ‘iv’ before turning higher in wave (iii).
Monday;
watch for wave ‘c’ of (ii) to complete at the trend channel line again.
[/vc_column_text][/vc_column][/vc_row]
[/_s2If]
[_s2If current_user_can(access_s2member_ccap_sp500)]
[vc_row][vc_column][vc_separator border_width=”5″][/vc_column][/vc_row][vc_row][vc_column][vc_column_text]
S&P 500.
[/vc_column_text][/vc_column][/vc_row][vc_row][vc_column][vc_separator border_width=”5″][/vc_column][/vc_row][vc_row][vc_column width=”2/3″][vc_custom_heading text=”1 hr” use_theme_fonts=”yes”][vc_column_text] [/vc_column_text][/vc_column][vc_column width=”1/3″][vc_custom_heading text=”4 Hours” use_theme_fonts=”yes”][vc_column_text]
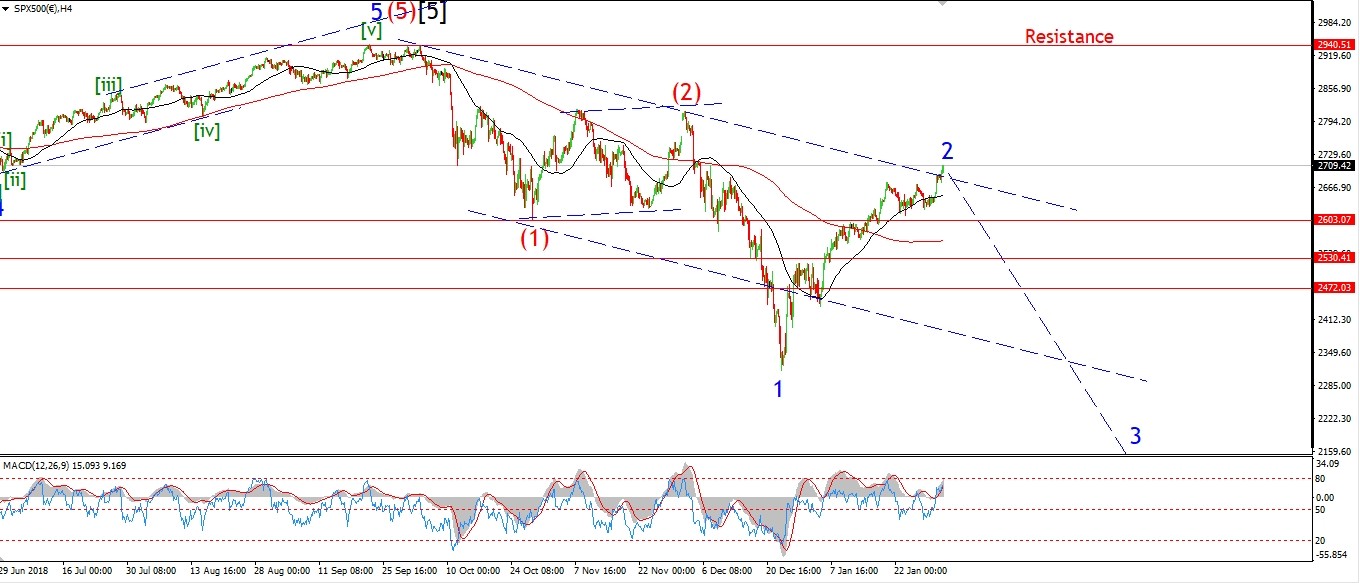 [/vc_column_text][vc_custom_heading text=”Daily” use_theme_fonts=”yes”][vc_column_text]
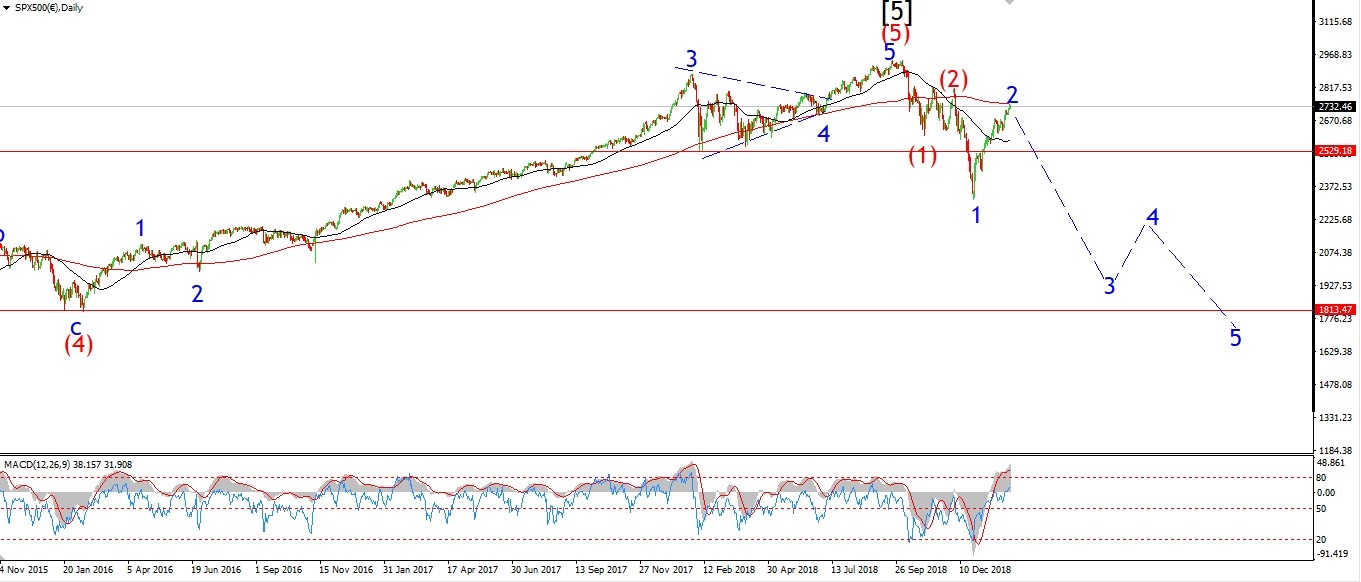 [/vc_column_text][/vc_column][/vc_row]
[vc_row][vc_column][vc_column_text]
The S&P has bounced this evening in a possible wave ‘ii’ expanded flat.
The wave ‘i’ low did not break the initial support at the previous wave (iii) high.
but wave ‘iii’ down should break through with ease.
Wave ‘ii’ must complete below 2738.
If wave ‘ii’ is completing this evening,
then Monday should be a down day again
as wave ‘iii’ carries the price down to the 2650 area again.
Next week;
Watch for a continued decline in wave ‘iii’ of (i).
We may even have an impulse wave (i) ans (ii) lower completed by the middle of next week.
[/vc_column_text][/vc_column][/vc_row]
[/_s2If]
[vc_row][vc_column][vc_column_text]
Have a great weekend,
God’s speed to one and all.
See you again on Monday.
[/vc_column_text][/vc_column][/vc_row]
[vc_row][vc_column][vc_separator border_width=”5″][/vc_column][/vc_row]