
Good evening to one and all.
The Lord’s Blessing’s to you all again tonight.
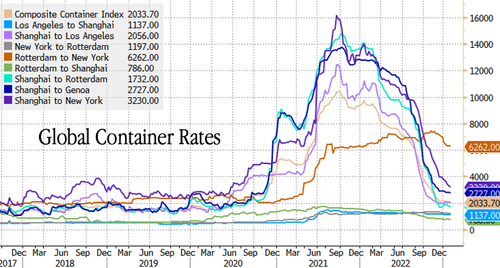
World’s Largest Container Shipper Warns Of Demand Slowdown Amid “Significant Inventory Adjustment”
Record Demand For Blockbuster 10Y Auction Sends Yields Tumbling
https://twitter.com/bullwavesreal
EURUSD.
EURUSD 1hr.
EURUSD 4hr.

EURUSD daily.
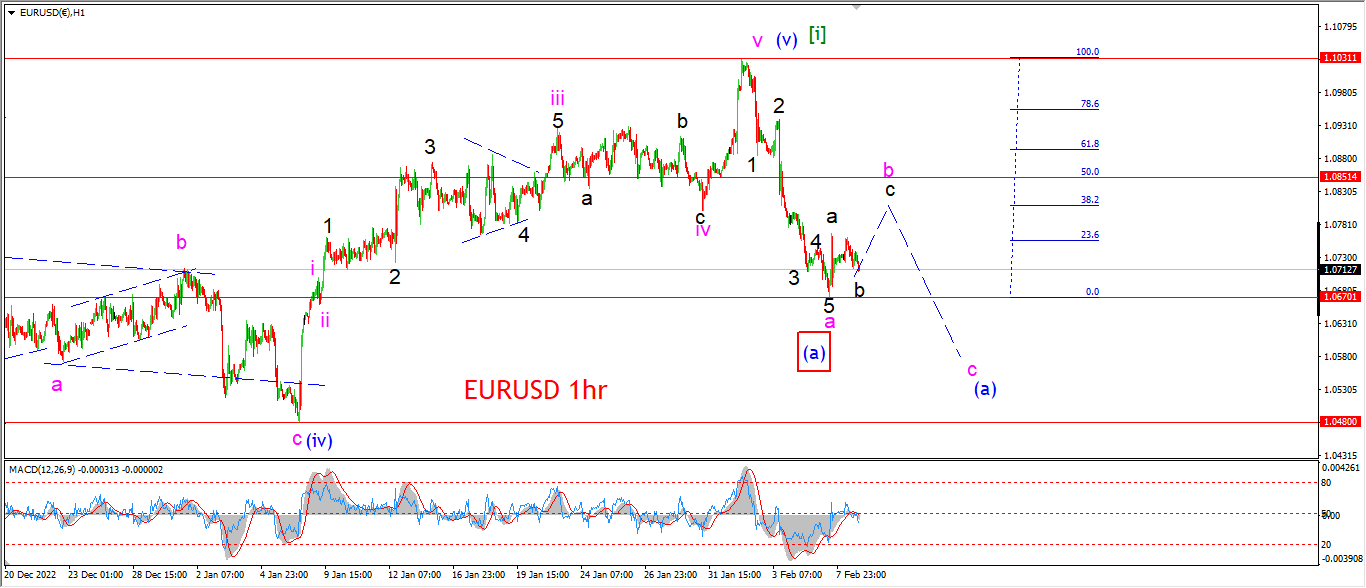
EURUSD is holding with the corrective wave ‘b’ rally scenario tonight.
The action was mostly quiet for the session in wave ‘b’ of ‘b’.
I cant say if wave ‘b’ black is done just yet as the internal pattern is unclear so far.
we could see another test of that wave ‘a’ low at 1.0670 before a rally in wave ‘c’ of ‘b’ later tomorrow.
That remains to be seen.
Ideally wave ‘b’ pink will retrace towards the 50% Fib level at 1.0850.
And then wave ‘c’ of (a) will fall again on Friday.
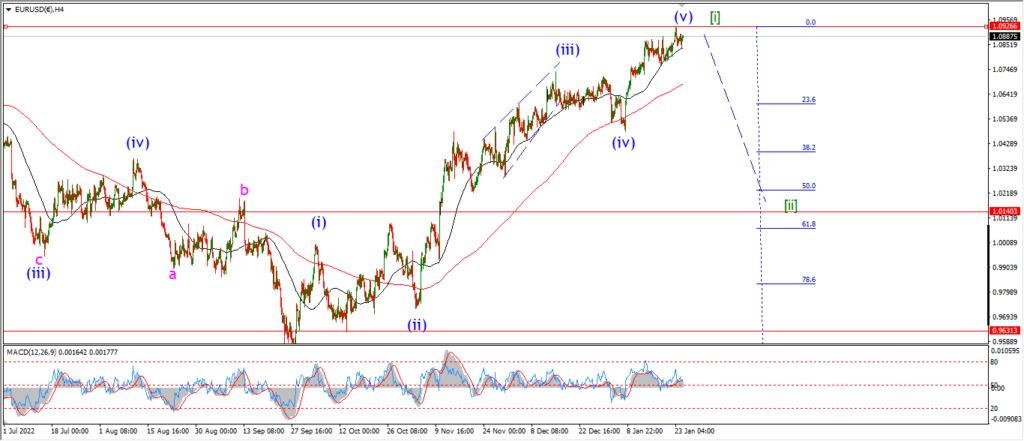
The target for wave (a) lies at near the 1.0500 area.
The previous wave (iv) low at 1.0480 should offer enough support to compiete wave (a).
Tomorrow;
Watch for wave ‘b’ to continue towards the target at 1.0850 as suggested.
The alternate scenario for wave (a) is a simple five wave decline to complete near the same target level.
GBPUSD
GBPUSD 1hr.
GBPUSD 4hr.

GBPUSD daily.
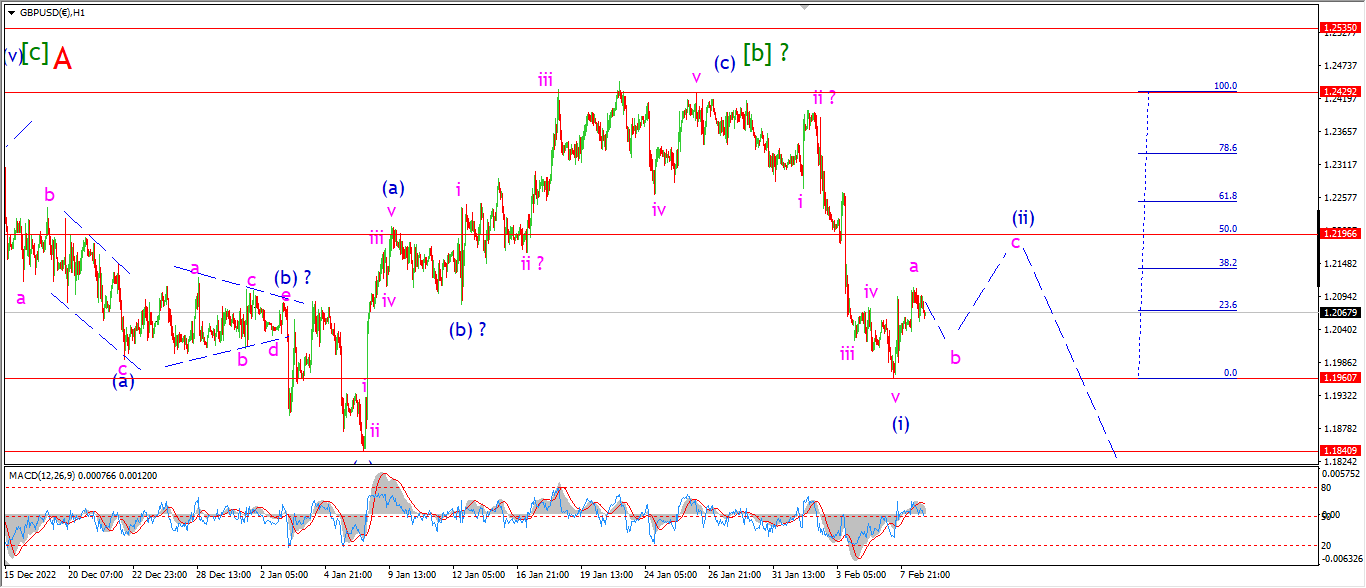
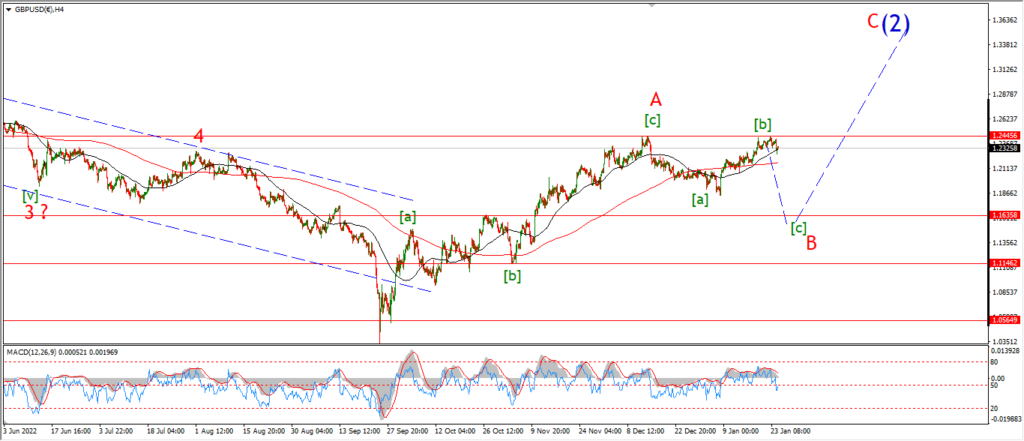
Cable is tracking higher today as part of the wave (ii) correction.
The target for wave (ii) lies at the 50% retracement level near 1.2200 as part of a three wave pattern.
If that happens as suggested,
then I will look for a return lower into wave (iii) to begin next week.
Tomorrow;
Wave ‘a’ has completed three waves up at the high today.
Watch for wave ‘b’ of (ii) to turn lower again and hold above 1.1960 at the wave (i) low.
Wave ‘c’ of (ii) Should close out the weeks trade on Friday.
USDJPY.
USDJPY 1hr.
USDJPY 4hr.

USDJPY daily.
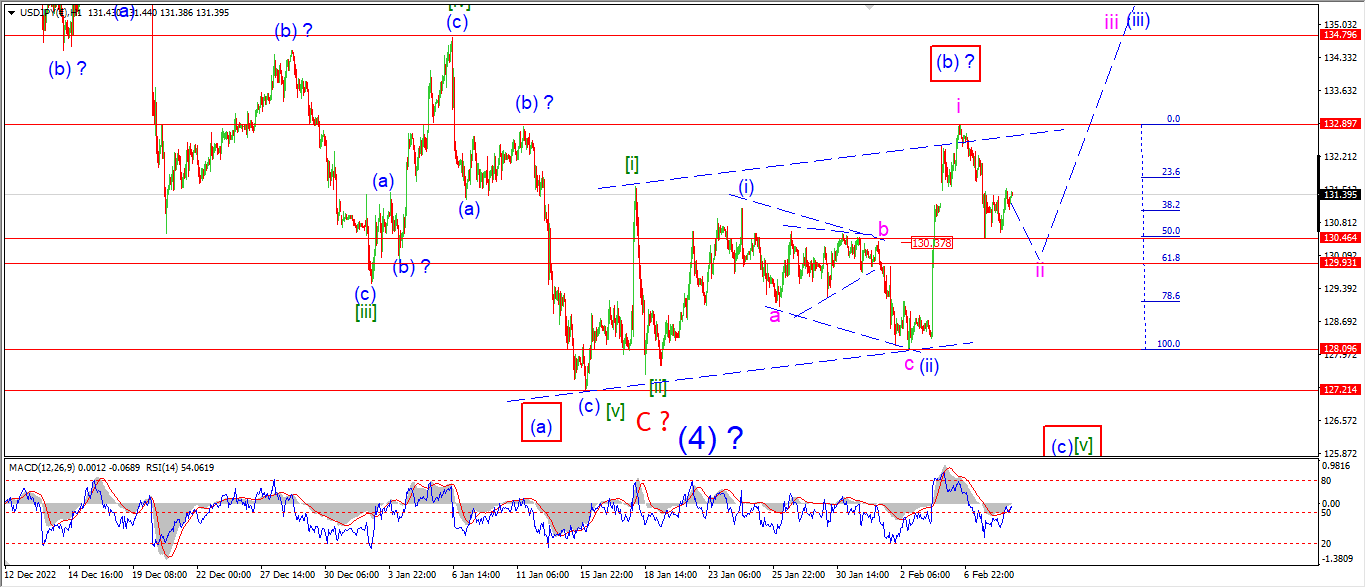
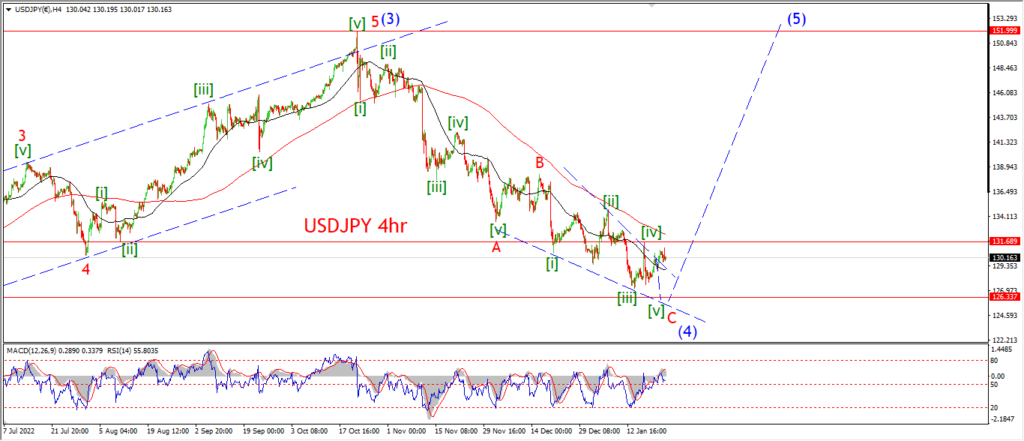
USDJPY has moved higher today in a corrective manner and so it seems wave ‘ii’ remains in control here.
The action has failed any impulsive move higher,
and now we are left with a small three wave move into todays high.
I am looking at the possibility of a larger three wave decline into wave ‘ii’ pink as shown.
the 62% retracement level lies at 129.90,
and that level is the most likely target for wave ‘ii’ now.
If the price pushes back above 132.90 again that will signal wave ‘iii’ is underway,
until then we have to deal with wave ‘ii’ as shown.
Tomorrow;
Watch for wave ‘ii’ pink to complete three waves down near 129.90.
The low at wave (ii) must hold for this pattern to remain valid.
DOW JONES.
DOW 1hr.
DOW 4hr
DOW daily.
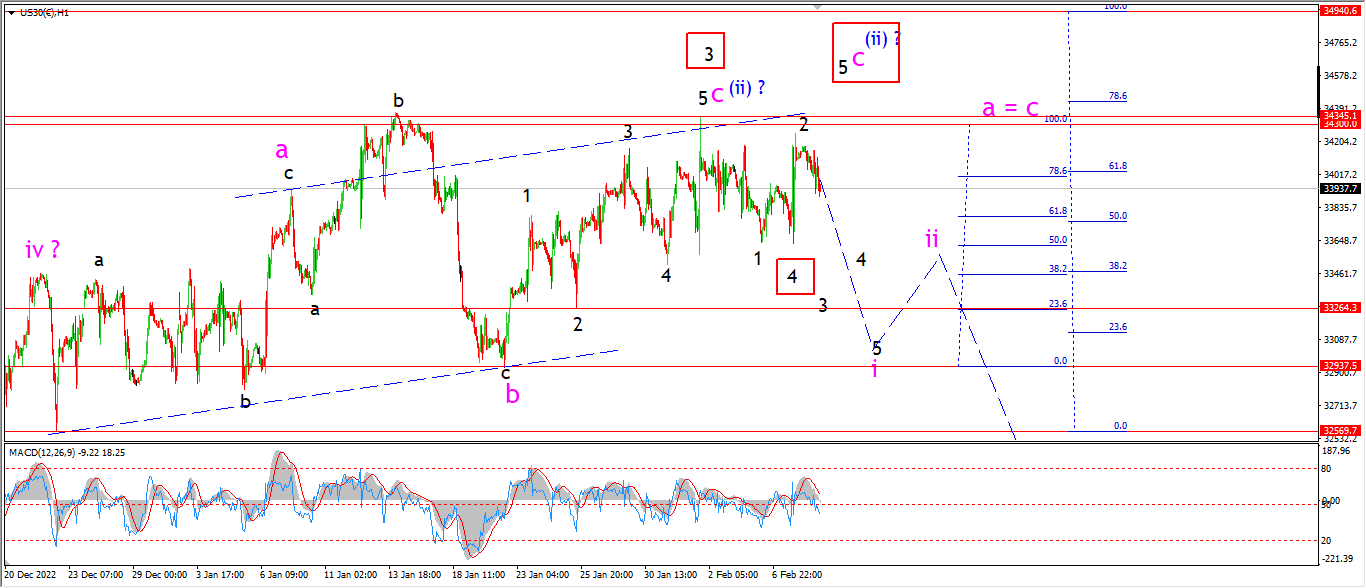
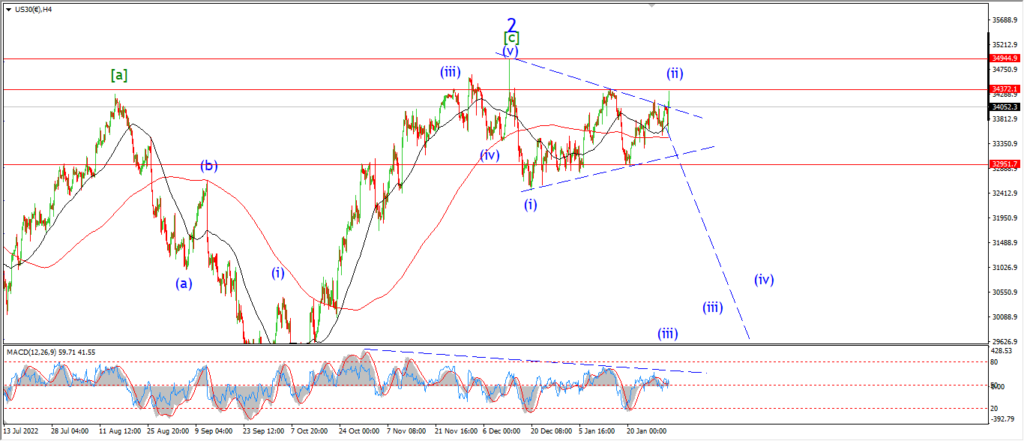
The action in the Dow is still pretty confused at the moment,
it is hard to make a call yet on the short term pattern.
I am looking at an alternate for wave ‘c’ again tonight in the red boxes.
This alternate involves the same ending diagonal pattern overall in wave ‘c’.
But wave ‘3’ of ‘c’ is shown as an extended wave.
And in this case wave ‘5’ is yet to complete with one more break to a new high.
It is a clean 50/50 between the main wave count and that alternate count so I will jsut have to wait ans see how this unfolds tomorrow.
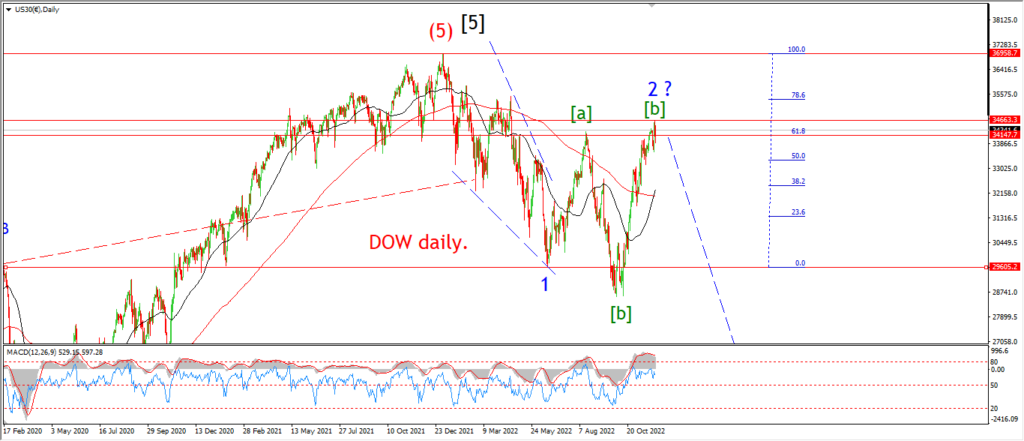
I have noted the fact that wave ‘a’ and ‘c’ of (ii) reached equality at 34300.
And the main count did hit that target already at last weeks highs.
What I need to happen now is for the market to choose a direction with decisive action.
If the market accelerates lower tomorrow to break 33260 at wave ‘2’ black,
that will make the decision in favor of the main count.
Tomorrow;
Watch for that high at wave (ii) to hold and for wave ‘i’ to turn lower again to confirm the pattern.
GOLD
GOLD 1hr.
GOLD 4hr.

GOLD daily.
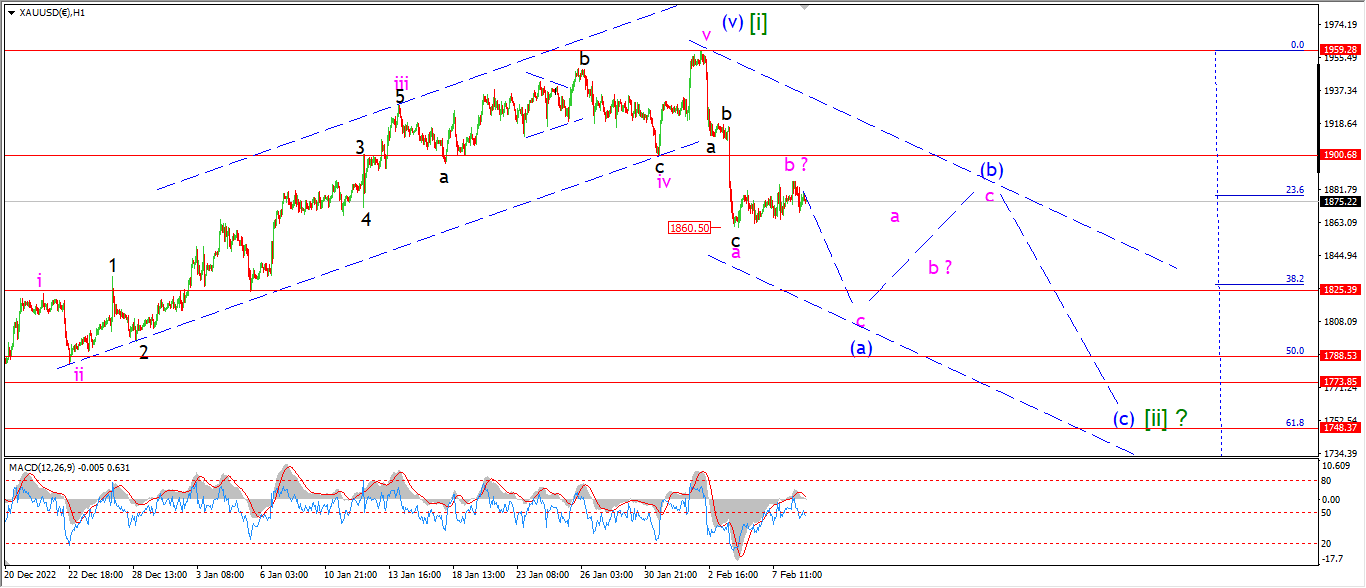
I am looking at a slightly different pattern in gold tonight because of the continued sideways trade this week.
Wave ‘a’ is now shown with a three wave decline.
Wave ‘b’ has taken the price sideways this week.
and if this count is correct,
then wave ‘c’ with turn lower again starting tomorrow and take the price down below 1825 again to complete wave (a) blue.
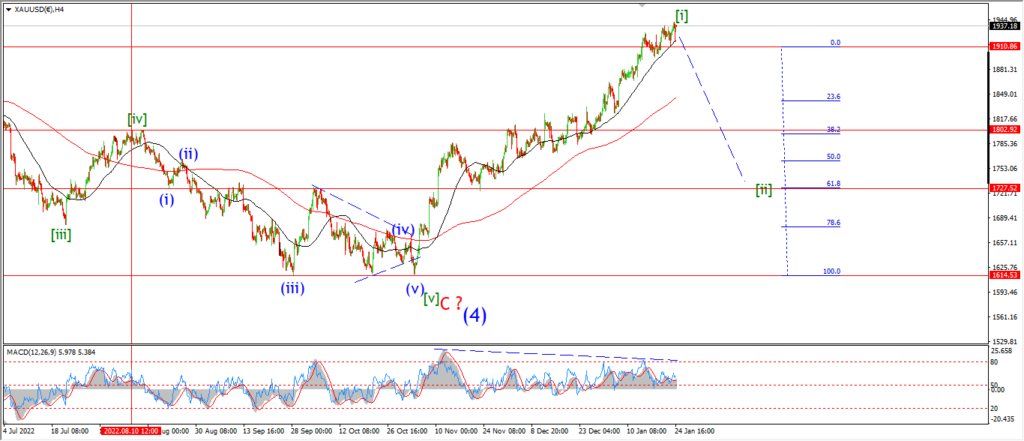
Overall the target for wave [ii] remains similar.
The 50% retracement level of wave [i] lies at 1788 and this serves as the initial target.
The previous wave (iv) at one lesser degree lies at 1773,
and the 62% retracement level lies at 1748.
That gives us a range from 1788 to 1748 for wave [ii] to complete.
Tomorrow;
Watch for wave ‘b’ to complete and then wave ‘c’ to turn lower again.
A break of 1860 again will signal wave ‘c’ is underway.
CRUDE OIL.
CRUDE OIL 1hr.
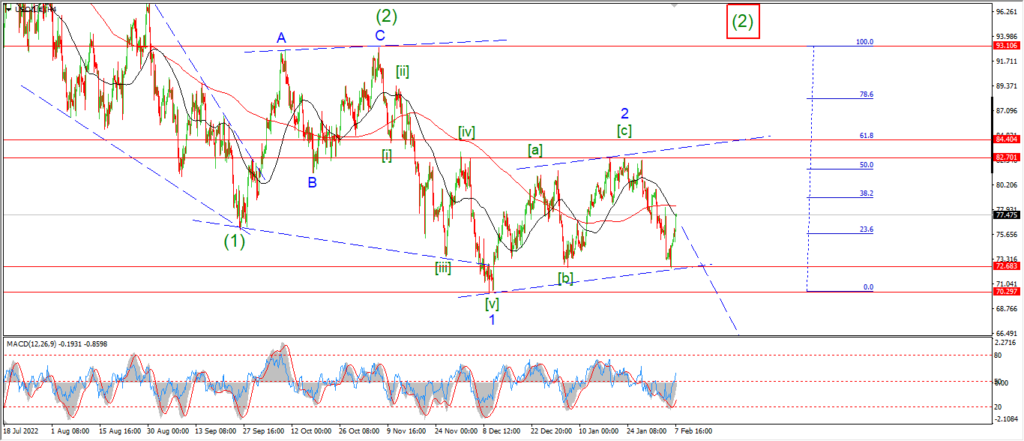
CRUDE OIL 4hr.
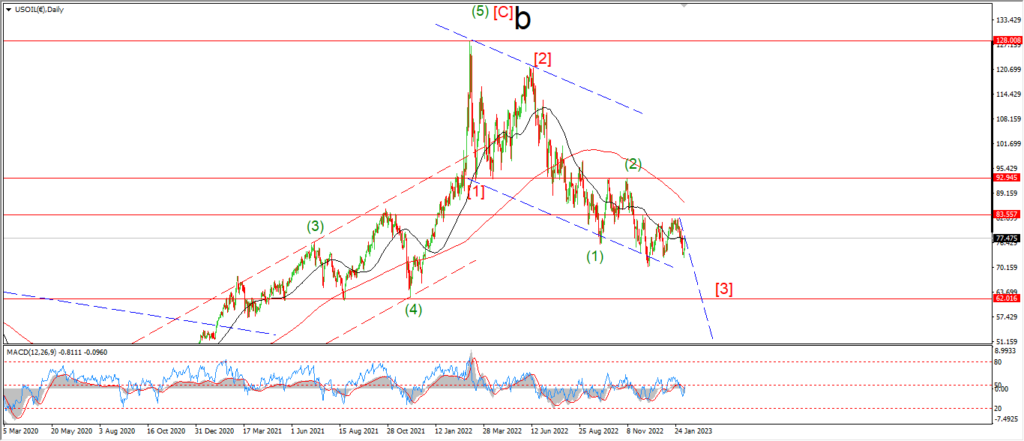
CRUDE OIL daily.
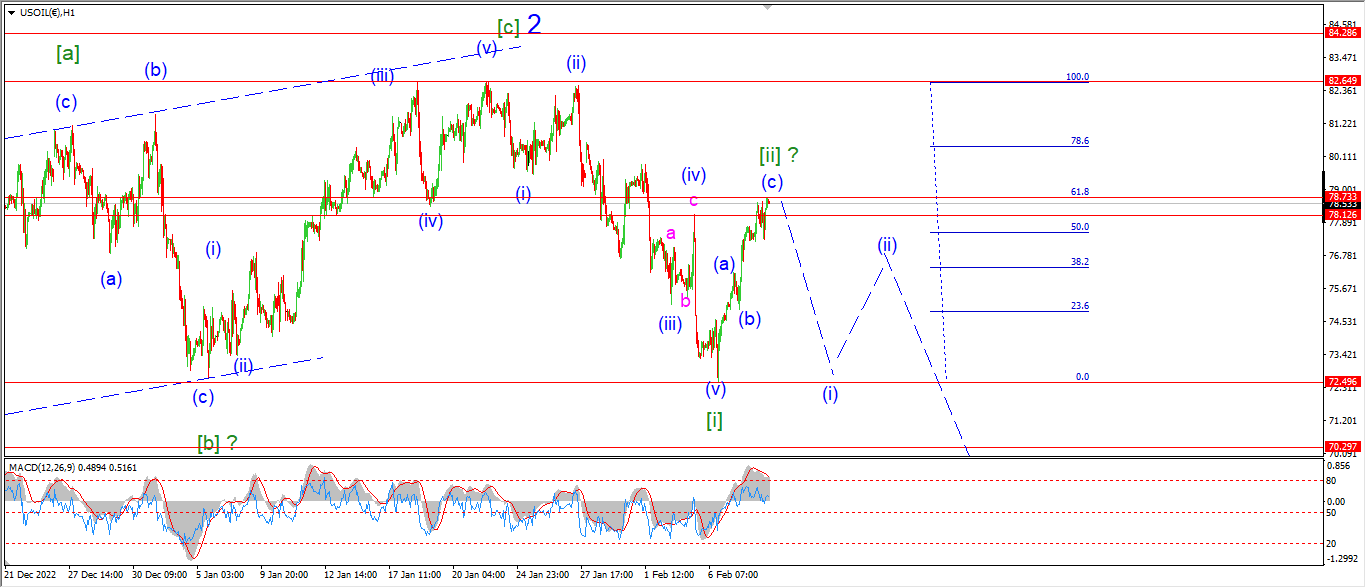
Crude has put in a solid rally off the wave [i] low last week.
The high of the session today has hit two common target levels for a second wave retracement.
1; The price has broken above the previous wave (iv) high at 78.12.
2; The high of the session has hit the 62% retracement level at 78.73 again.
So this rally has done enough to consider wave [ii] complete here.
I cant be sure if wave [ii] will be satisfied with such a short and sharp corrective pattern though.
There is always the possibility that we will just track sideways for another week to trace out a more complex corrective pattern.
But for the moment this rally has achieved enough to at least consider that wave [ii] is complete.
Lets see if the price will turn lower over the coming days to signal wave [iii] has begun.
Tomorrow;
Watch for wave [ii] to show signs of topping out and reversing into wave (i) of [iii].
If the rally continues,
then I will be forced to consider one of the alternates shown in the 4hr chart.
S&P 500.
S&P 500 1hr
S&P 500 4hr
S&P 500 daily.
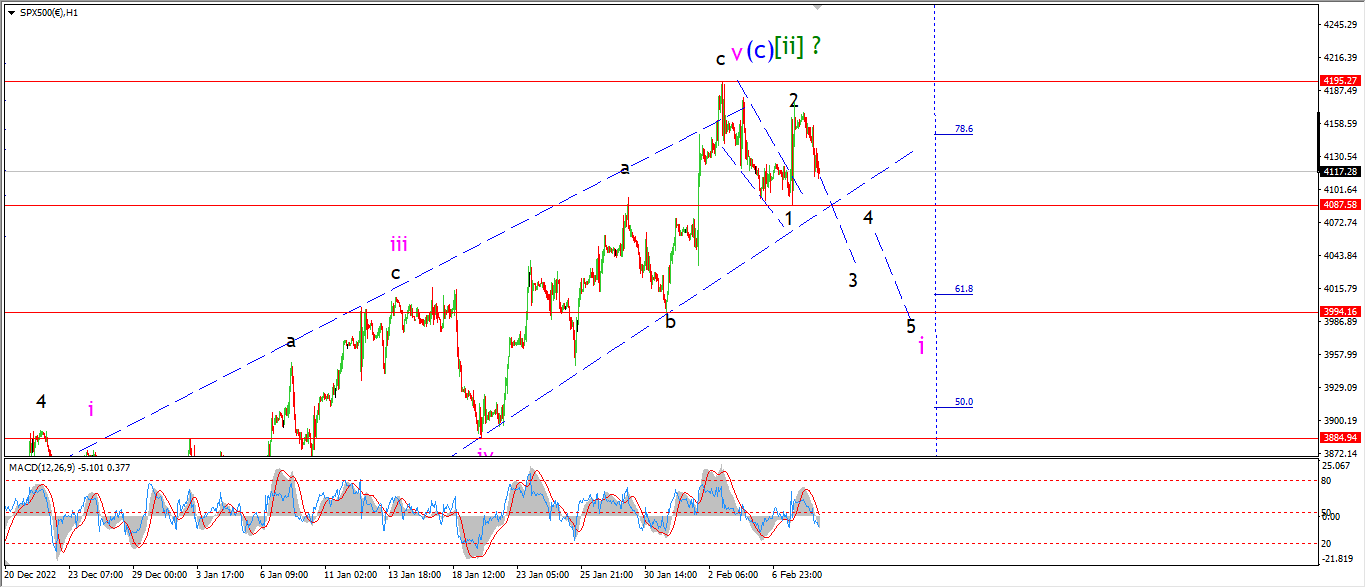
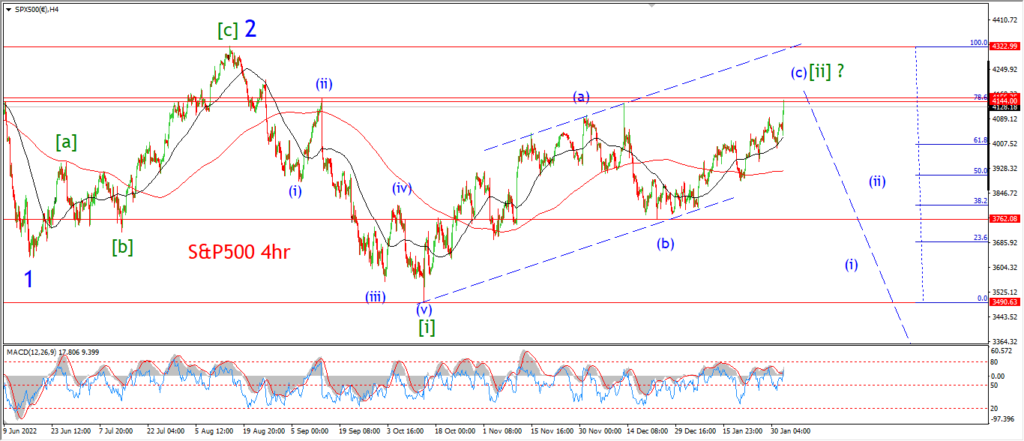
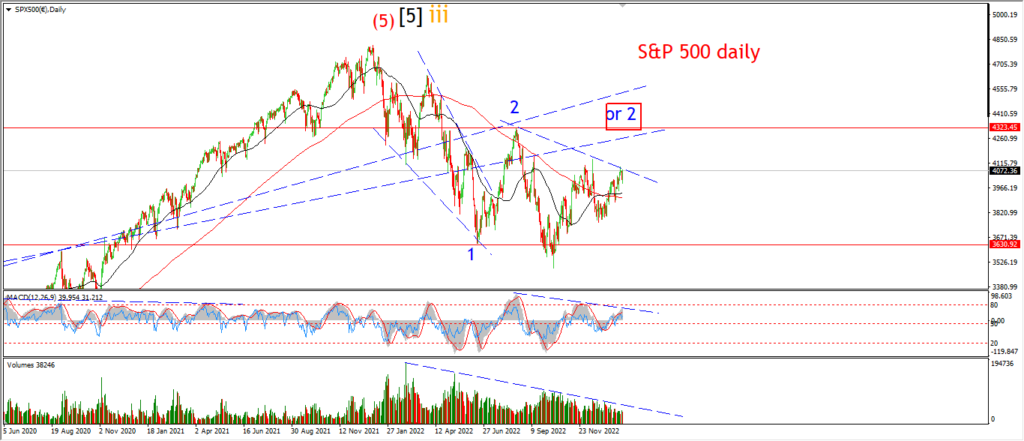
The S&P has turned lower today off a Tuesdays lower high and while this decline is not large enough yet to consider wave ‘i’ underway,
I am at least willing to give this bearish count another chance to prove itself.
I am watching that wave ‘b’ low at 3994 as the first serious signal level for this reversal into wave (i) of [iii].
If we can break that low with a reasonable five wave pattern for wave ‘i’ pink,
then the bearish count will get a major boost in probability.
And wave (i) of [iii] will become a reality pretty quickly.
The bearish momentum signals are already in place.
the sentiment signals are sreaming a top is likely very nearby.
This moment is lining up very similar to last summers wave ‘2’ highs,
where all the signals were pointing to a second wave top across the board,
and all we needed was an initial impulsive decline to kick off that september leg down in wave [i].
WAve [i] of ‘3’ ended up clocking a 19% decline in 6 weeks.
Something similar is coming in wave (i) of [iii] if this count is correct here.
Tomorrow;
Watch for wave ‘i’ pink to continue lower towards that initial support at 3994 over the coming days.
If wave ‘3’ of ‘i’ manages to break 4080 and hold below the rising trend line again,
I will take that as a vote in favor of this count.
I do want to see the bearish count gain the upper hand soon though.
SILVER.
SILVER 1hr
SILVER 4hr.
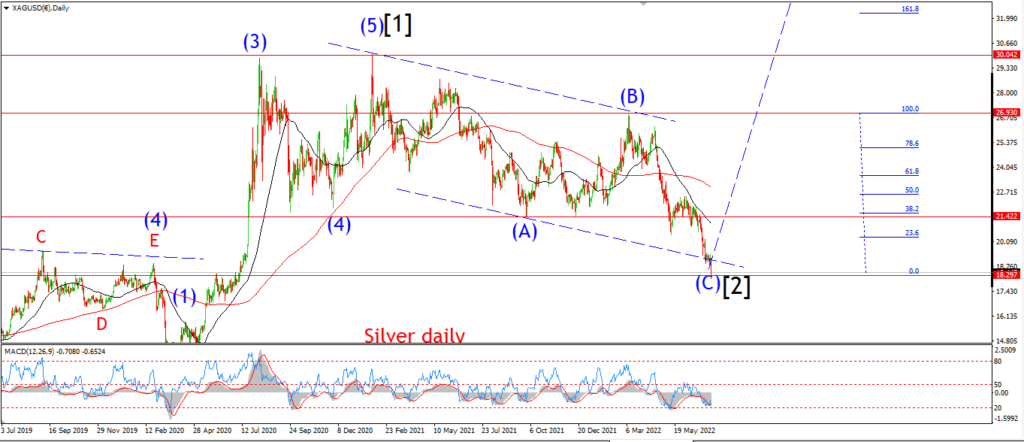
SILVER daily.
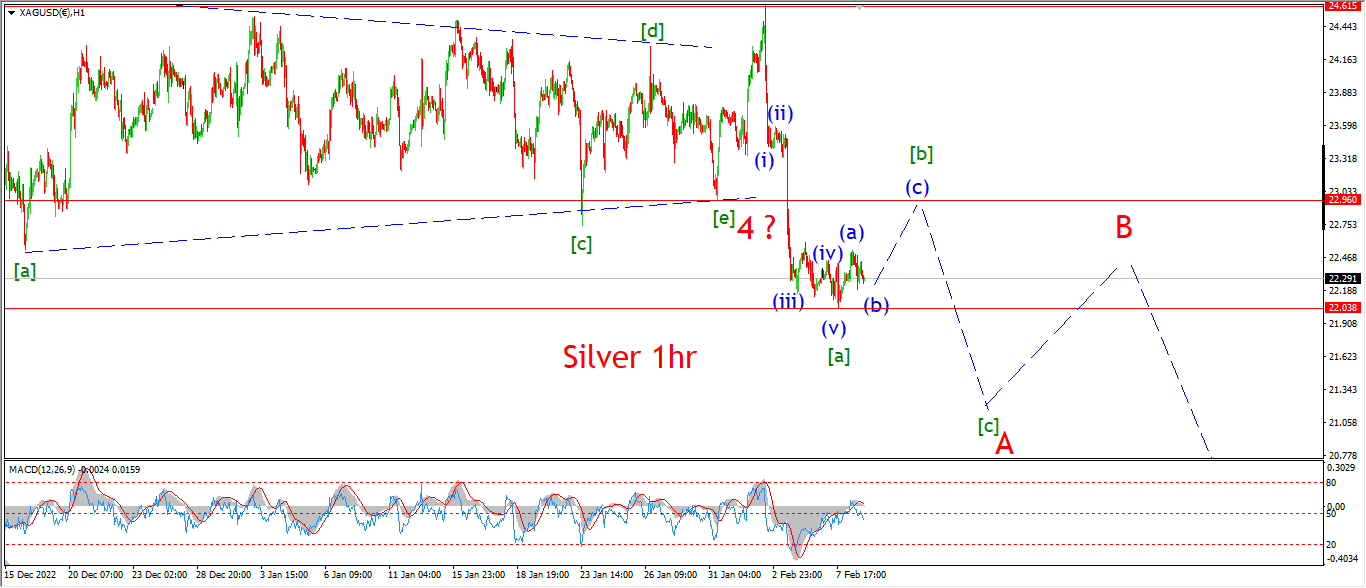
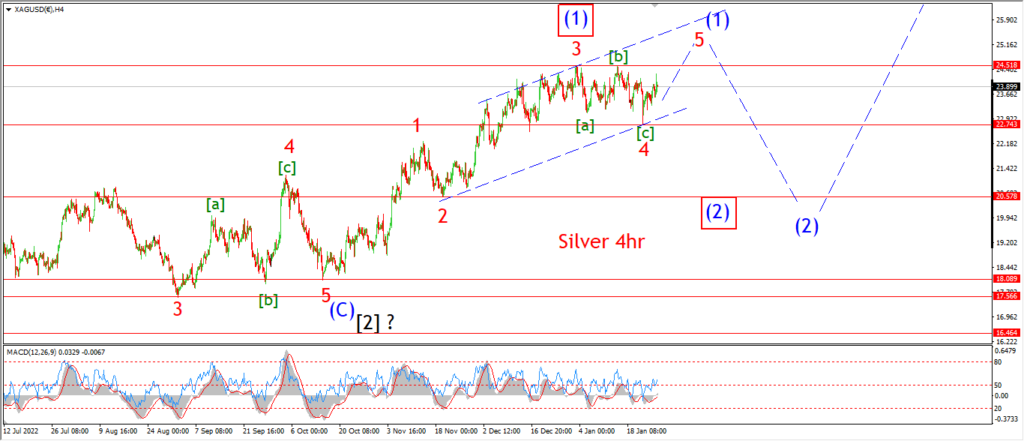
The pattern in wave [a] has reached an interim low at 22.03 today and that bounce off that low is suggesting that wave [a] is now complete.
Wave [b] should take the price higher from here in three waves as shown.
And we may even have wave (a) and (b) of [b] done at this evenings high low.
That remains to be seen,
but if the price manages to push higher towards that 22.90 level tomorrow again,
that will signal wave (c) is in play,
and the wave [b] top will be along pretty soon after that.
If all goes to plan here,
then wave [b] will be complete by Fridays close,
and we can look lower into wave [c] next week.
One step at a time though.
Tomorrow;
Watch for wave (c) to step higher and complete three waves up near 22.90 over the next few sessions.
BITCOIN
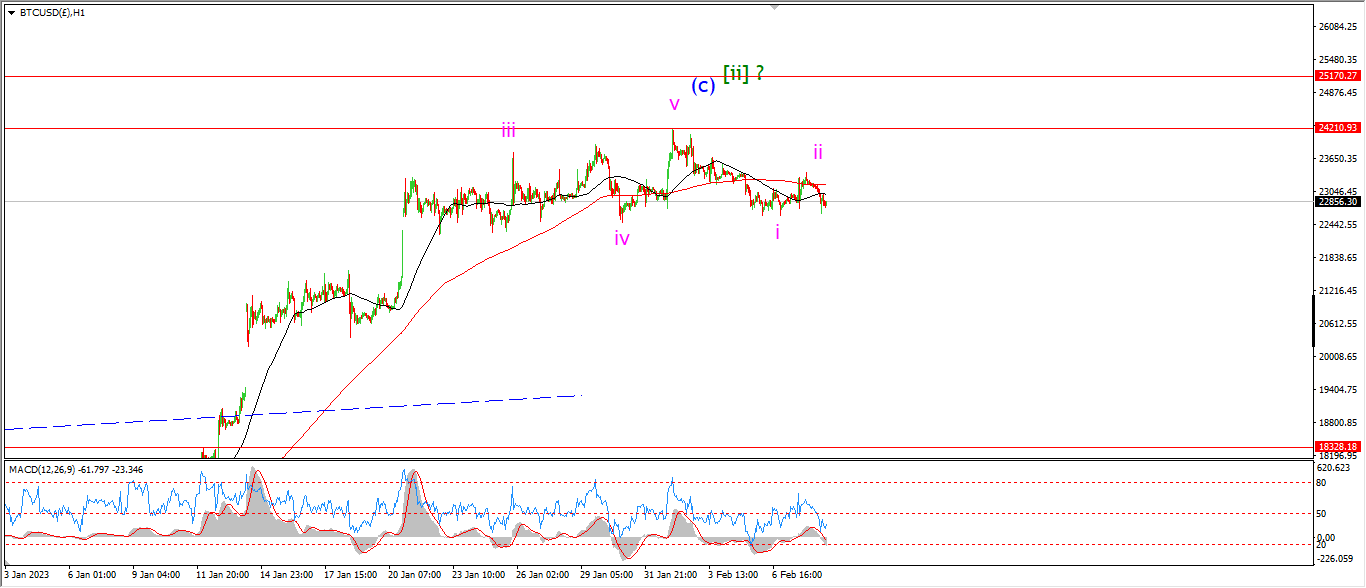
BITCOIN 1hr.
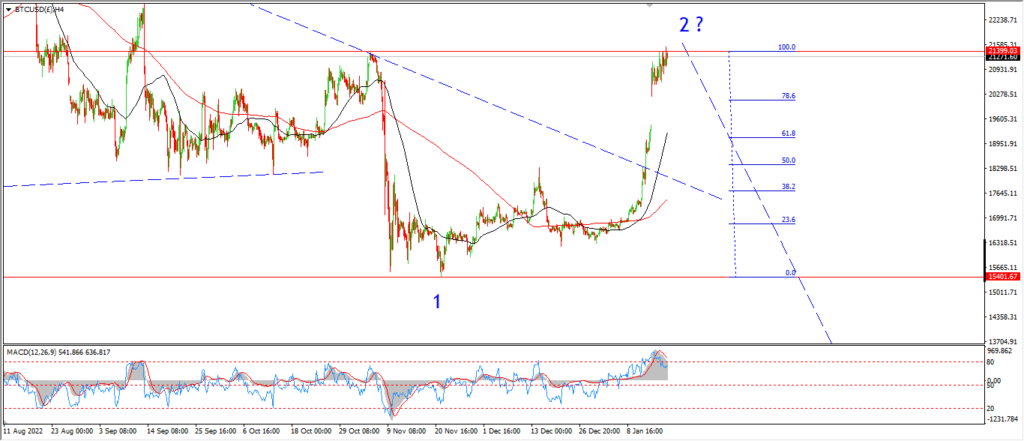
BITCOIN 4hr.

BITCOIN daily.
….
FTSE 100.
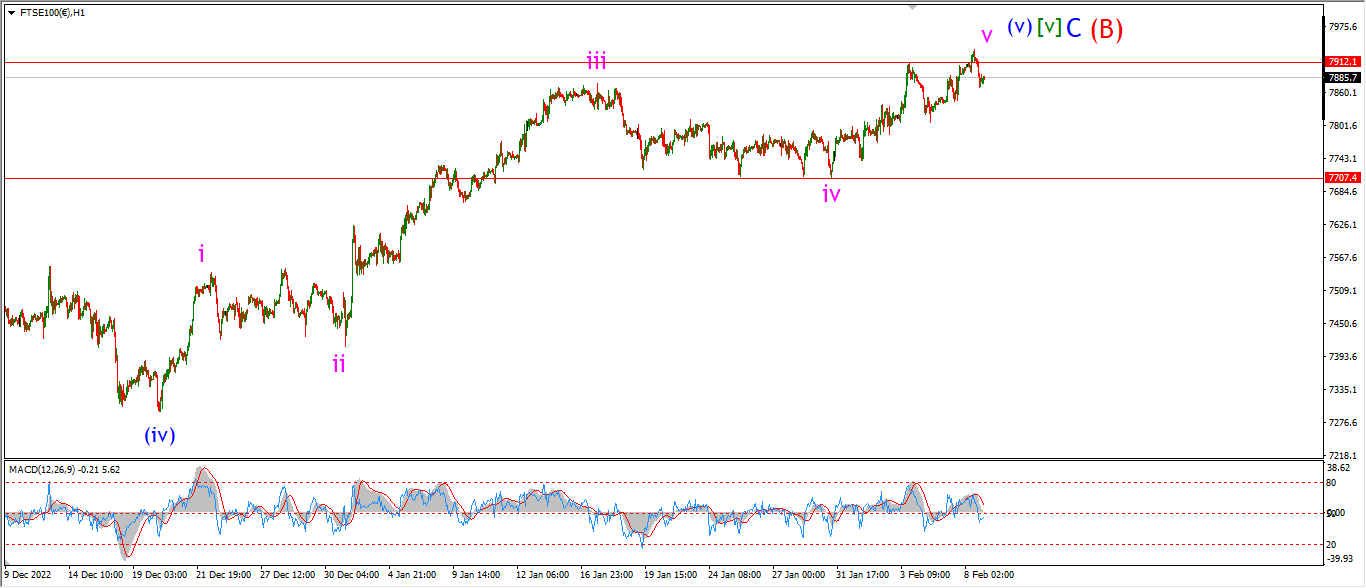
FTSE 100 1hr.
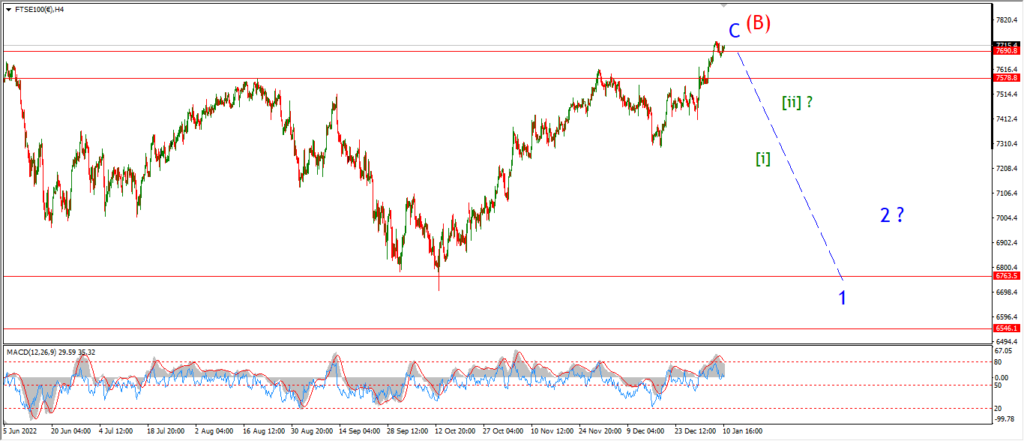
FTSE 100 4hr.

FTSE 100 daily.
….
DAX.
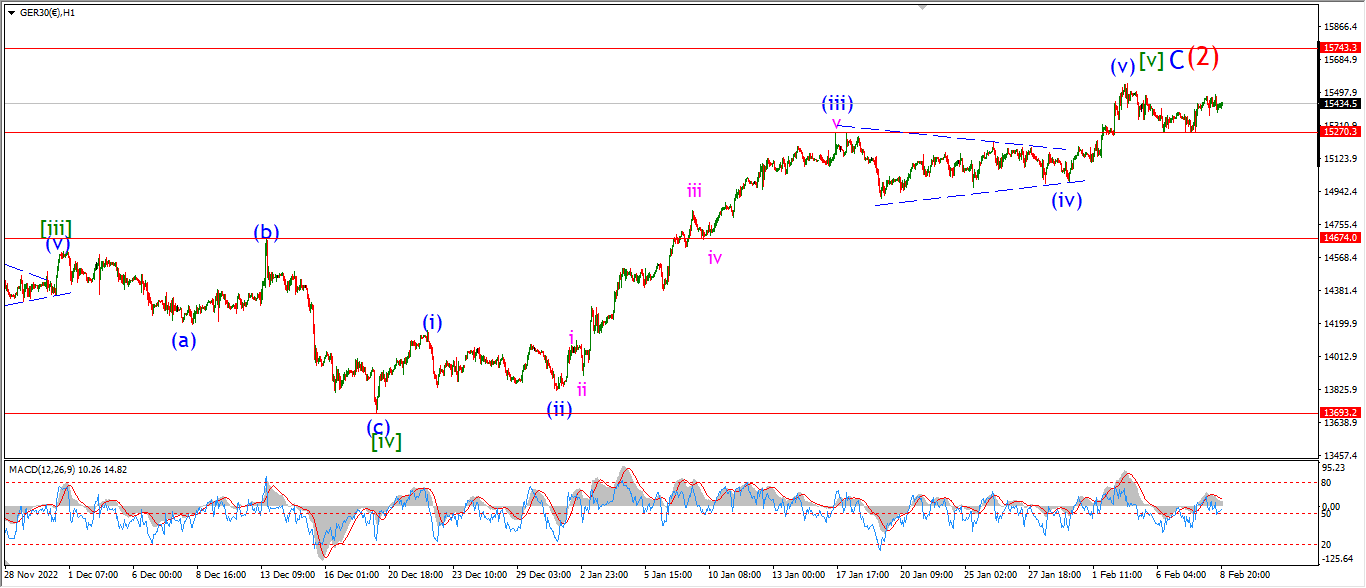
DAX 1hr
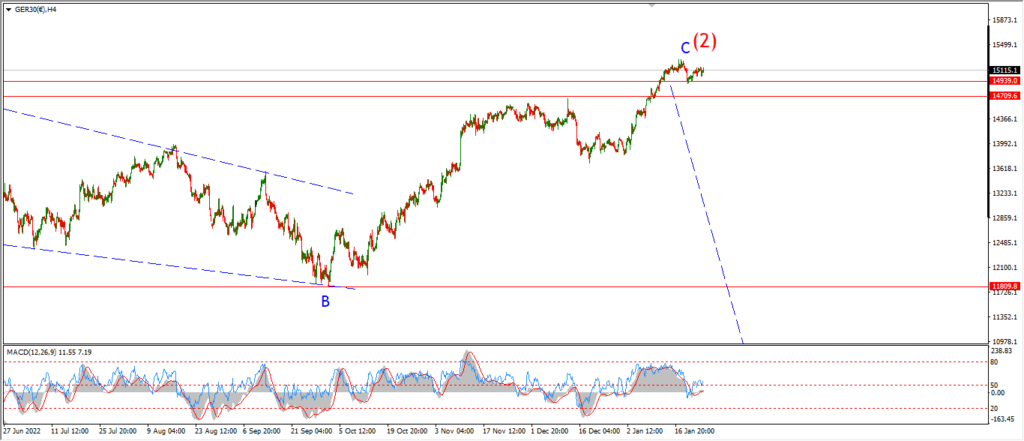
DAX 4hr

DAX daily.
….
NASDAQ 100.
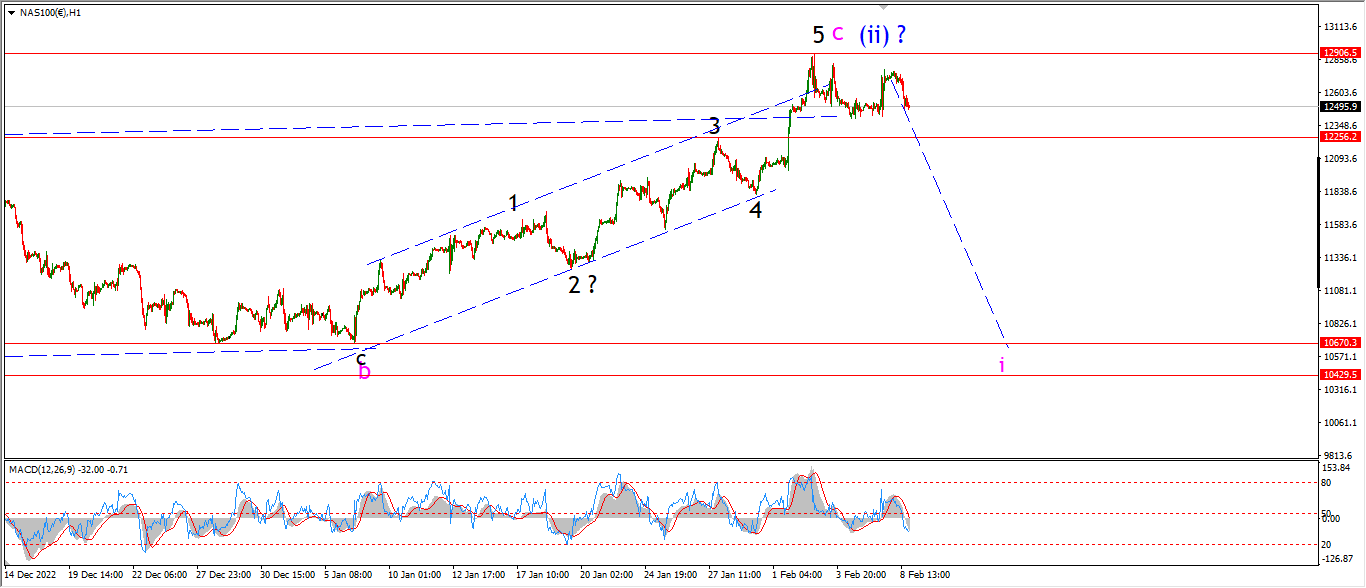
NASDAQ 1hr
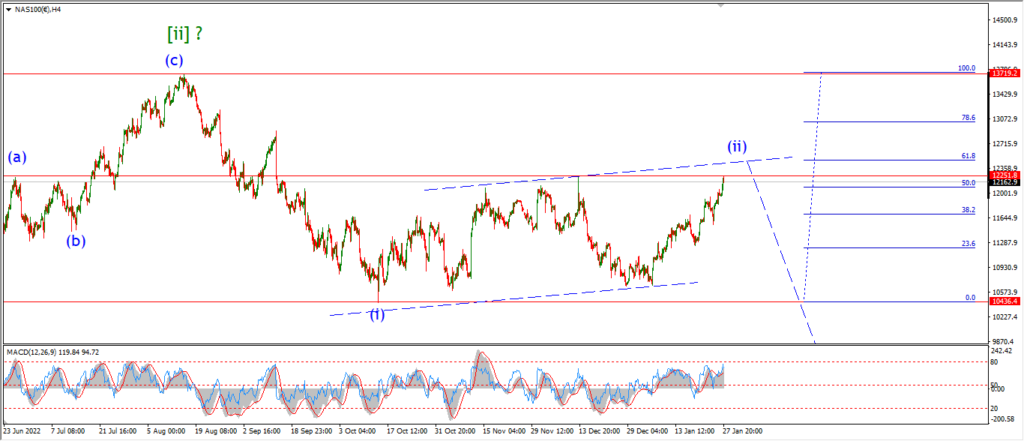
NASDAQ 4hr.

NASDAQ daily.
….