
[vc_row][vc_column][vc_separator border_width=”5″][/vc_column][/vc_row]
[vc_row][vc_column][vc_column_text]
Good evening folks.
[/vc_column_text][/vc_column][/vc_row]
[_s2If current_user_can(access_s2member_ccap_eurusd)]
[vc_row][vc_column][vc_separator border_width=”5″][/vc_column][/vc_row]
[vc_row][vc_column][vc_column_text]
EURUSD
[/vc_column_text][/vc_column][/vc_row]
[vc_row][vc_column][vc_separator border_width=”5″][/vc_column][/vc_row][vc_row][vc_column width=”2/3″][vc_custom_heading text=”1 hr” use_theme_fonts=”yes”][vc_column_text]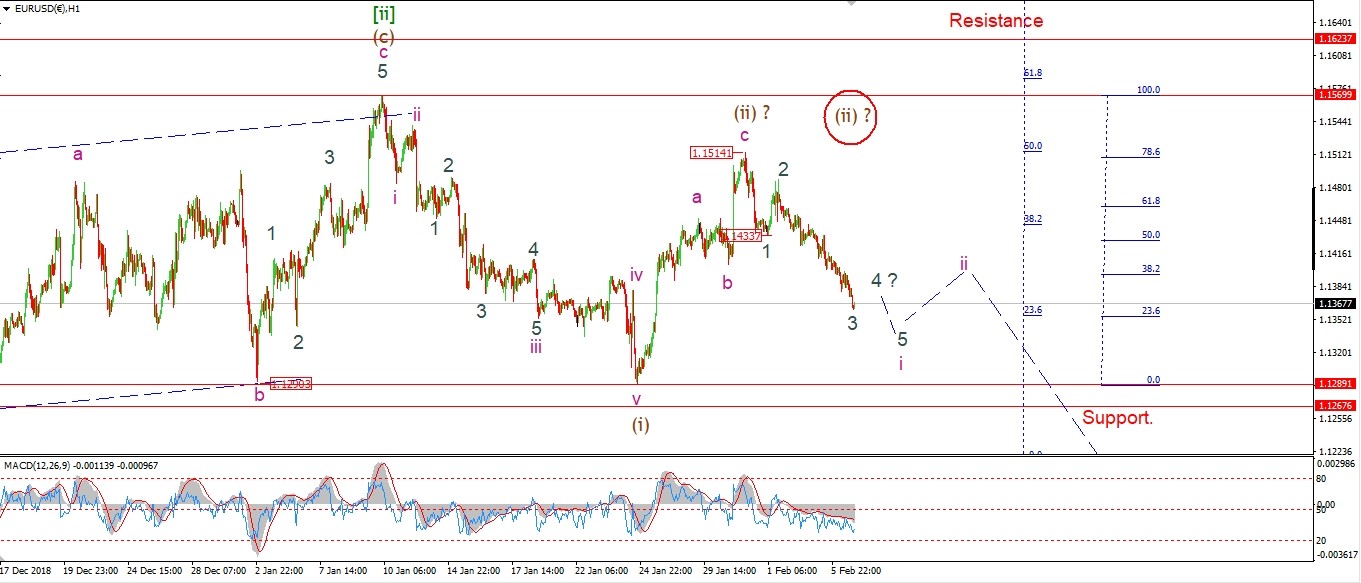 [/vc_column_text][/vc_column][vc_column width=”1/3″][vc_custom_heading text=”4 Hours” use_theme_fonts=”yes”][vc_column_text]
 [/vc_column_text][vc_custom_heading text=”Daily” use_theme_fonts=”yes”][vc_column_text]
 [/vc_column_text][/vc_column][/vc_row]
[vc_row][vc_column][vc_column_text]
Well the bearish case is strengthening today.
The drop in wave ‘3’ is extending,
even if the internal form is not perfect.
There has not been any significant correction to form wave ‘4’ yet,
so I’m running with the idea that this is still wave ‘3’ of ‘i’ down.
Tomorrow;
If we see any corrective action to the upside this will be wave ‘4’ underway.
With wave ‘5’ left to complete.
1.1433 forms the wave ‘1’ low.
The price should hold below this level for the rest of wave ‘i’ down.
[/vc_column_text][/vc_column][/vc_row]
[/_s2If]
[_s2If current_user_can(access_s2member_ccap_gbpusd)]
[vc_row][vc_column][vc_separator border_width=”5″][/vc_column][/vc_row][vc_row][vc_column][vc_column_text]
GBPUSD
[/vc_column_text][/vc_column][/vc_row][vc_row][vc_column][vc_separator border_width=”5″][/vc_column][/vc_row][vc_row][vc_column width=”2/3″][vc_custom_heading text=”1 hr” use_theme_fonts=”yes”][vc_column_text]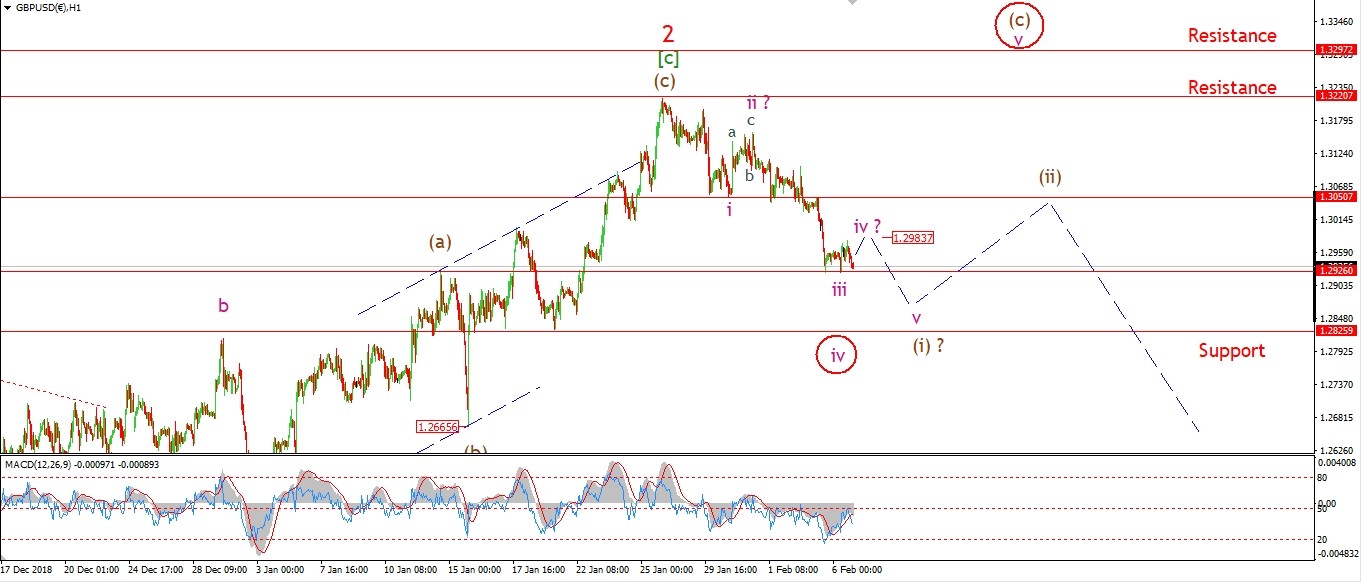 [/vc_column_text][/vc_column][vc_column width=”1/3″][vc_custom_heading text=”4 Hours” use_theme_fonts=”yes”][vc_column_text]
 [/vc_column_text][vc_custom_heading text=”Daily” use_theme_fonts=”yes”][vc_column_text]
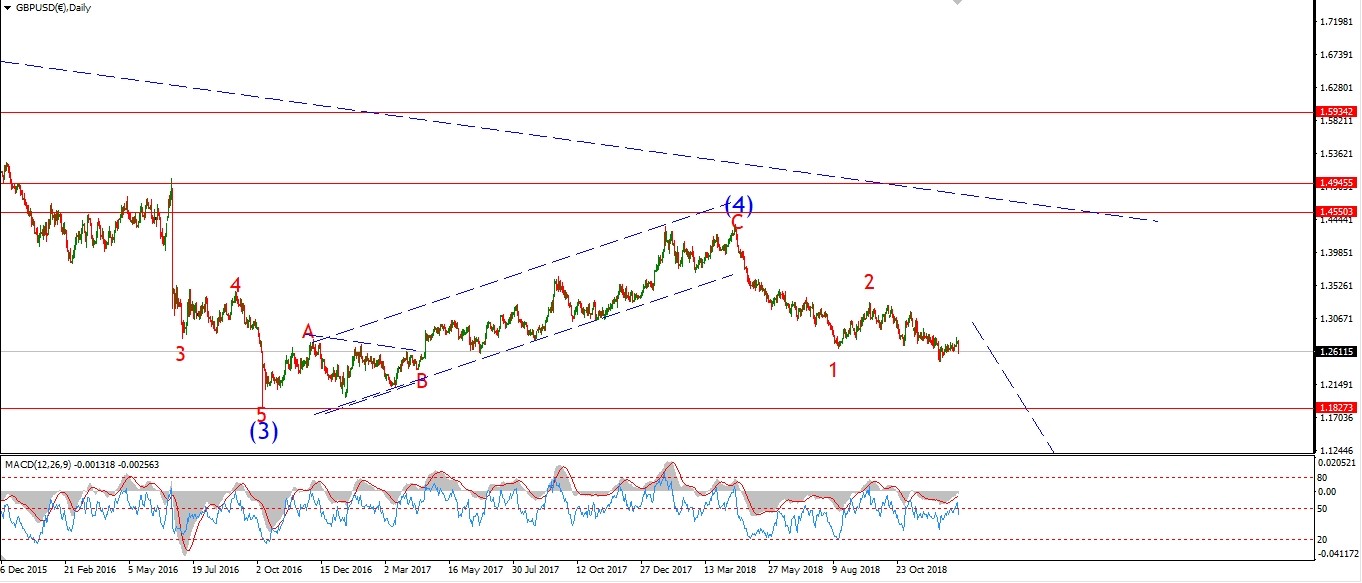 [/vc_column_text][/vc_column][/vc_row]
[vc_row][vc_column][vc_column_text]
The price has held above that 1.2926 level today in a corrective formation.
This could be a correction within wave ‘iii’ down,
or,
the beginning of wave ‘iv’ pink.
Wave ‘iv’ must hold below 1.2926 for now.
And then a further drop in wave ‘5’ to complete wave (i) down.
Tomorrow;
Watch for wave ‘iv’ to complete soon, below 1.3050 the wave ‘i’ low.
Wave ‘v’ should find support at 1.2825.
[/vc_column_text][/vc_column][/vc_row]
[/_s2If]
[_s2If current_user_can(access_s2member_ccap_usdjpy)]
[vc_row][vc_column][vc_separator border_width=”5″][/vc_column][/vc_row][vc_row][vc_column][vc_column_text]
USDJPY
[/vc_column_text][/vc_column][/vc_row][vc_row][vc_column][vc_separator border_width=”5″][/vc_column][/vc_row][vc_row][vc_column width=”2/3″][vc_custom_heading text=”1 hr” use_theme_fonts=”yes”][vc_column_text]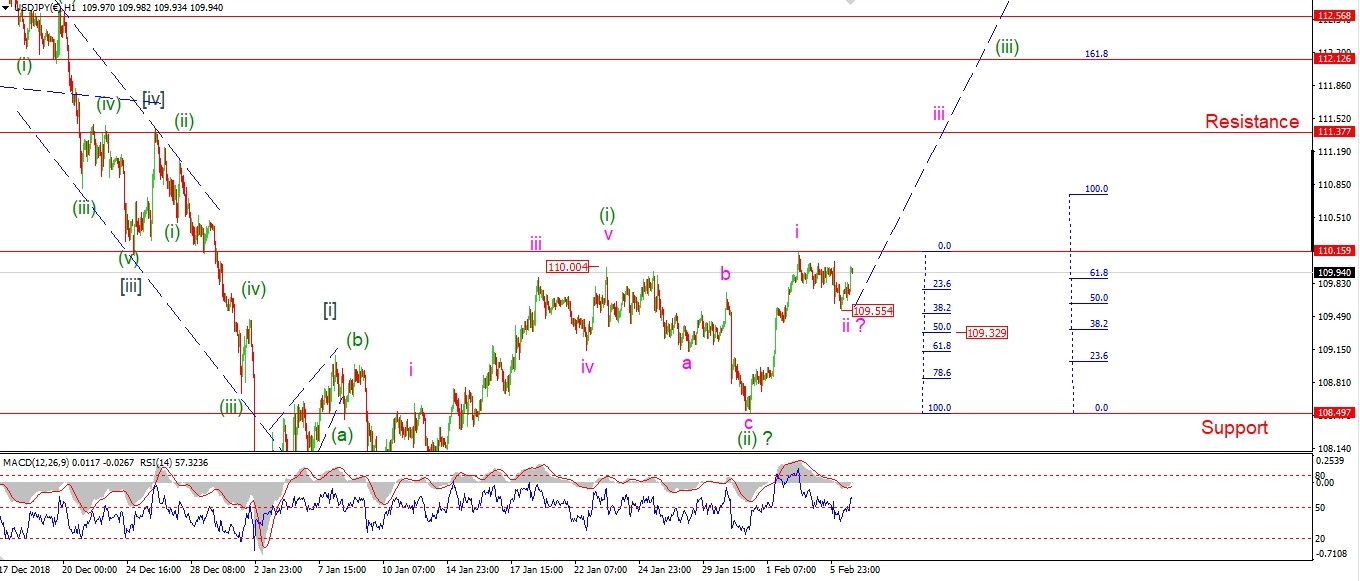 [/vc_column_text][/vc_column][vc_column width=”1/3″][vc_custom_heading text=”4 Hours” use_theme_fonts=”yes”][vc_column_text]
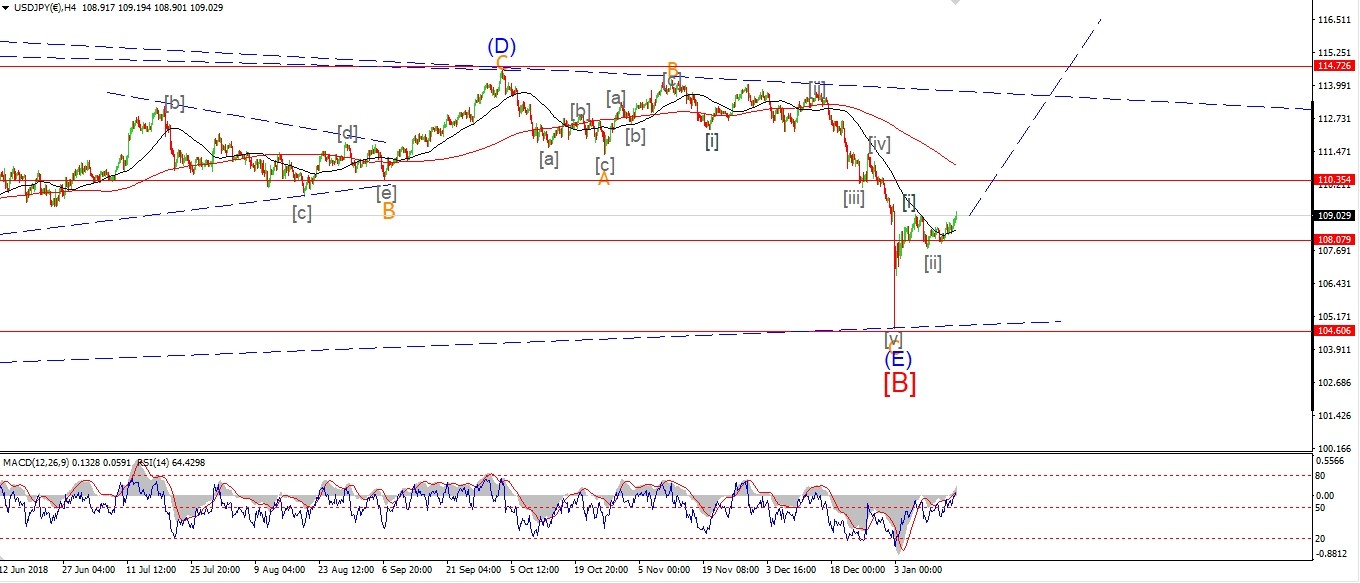 [/vc_column_text][vc_custom_heading text=”Daily” use_theme_fonts=”yes”][vc_column_text]
 [/vc_column_text][/vc_column][/vc_row]
[vc_row][vc_column][vc_column_text]
The price has pushed higher off a possible low at wave ‘ii’ pink today.
Todays low reached 109.55 in a corrective drop off the wave ‘i’ high.
This level coincides with the 38% retracement level.
If wave ‘ii’ is in,
then 109.55 should hold as wave ‘iii’ rallies.
A break above 110.15 again will confirm wave ‘iii’ up.
Tomorrow;
watch for Wave ‘iii’ up to get underway with a break of 110.15.
[/vc_column_text][/vc_column][/vc_row]
[/_s2If]
[_s2If current_user_can(access_s2member_ccap_dow_jones)]
[vc_row][vc_column][vc_separator border_width=”5″][/vc_column][/vc_row][vc_row][vc_column][vc_column_text]
DOW JONES INDUSTRIALS
[/vc_column_text][/vc_column][/vc_row][vc_row][vc_column][vc_separator border_width=”5″][/vc_column][/vc_row][vc_row][vc_column width=”2/3″][vc_custom_heading text=”1 hr” use_theme_fonts=”yes”][vc_column_text] [/vc_column_text][/vc_column][vc_column width=”1/3″][vc_custom_heading text=”4 Hours” use_theme_fonts=”yes”][vc_column_text]
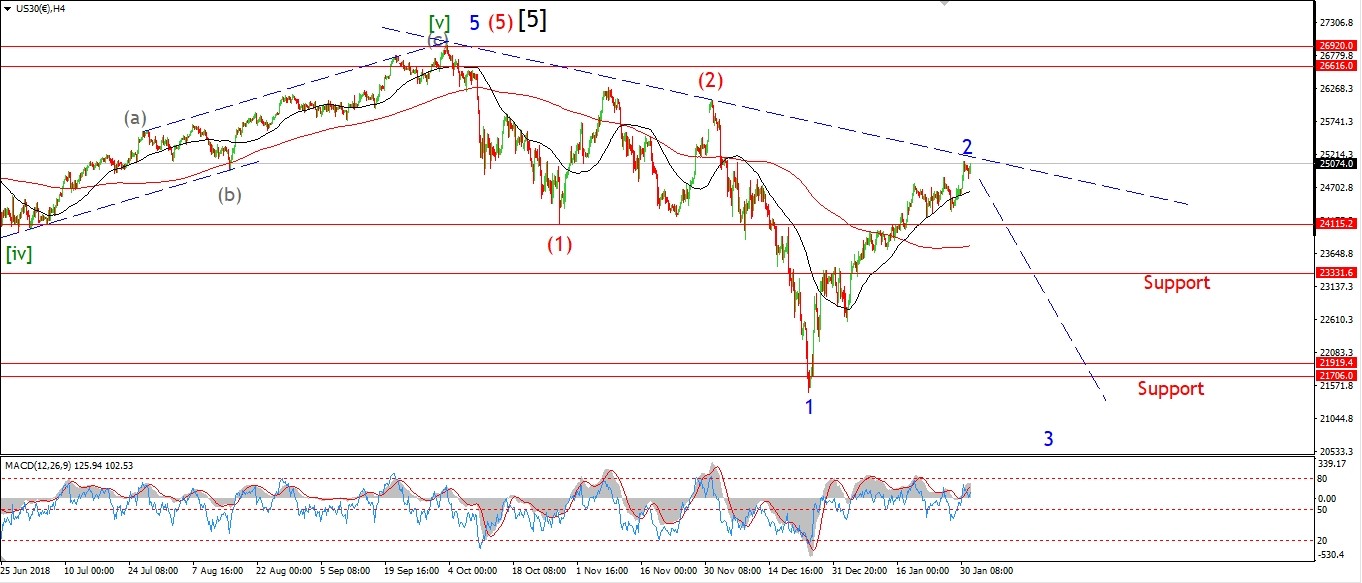 [/vc_column_text][vc_custom_heading text=”Daily” use_theme_fonts=”yes”][vc_column_text]
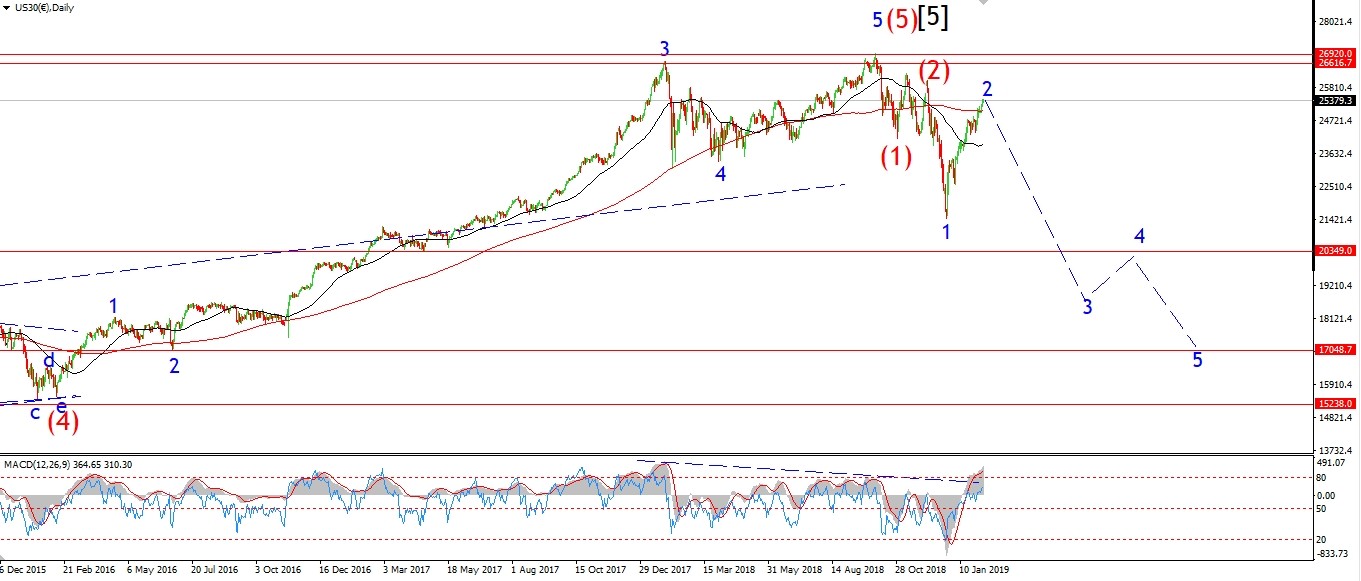 [/vc_column_text][/vc_column][/vc_row]
[vc_row][vc_column][vc_column_text]
Calling a top in this market is proving a dangerous game.
So far the market is marching on higher,
absolutely oblivious to the dangerous territory we are in.
But again,
this is exactly the same situation that was on display at the wave ‘2’ high on December 3rd last.
The market kept moving higher without a care in the world.
I kept hearing ‘the Christmas rally is here’ and that new all time highs are coming.
Then we had the worst December in living memory.
Forgive me for not ‘believing’ the hype!
The ferocious rally over the last month has driven the Daily MACD and RSI back above the September all time highs,
and almost to the extremes of the January 2018 highs!
The market is holding flat for the last two sessions.
while we still have not seen any decline to work with,
I do think this week has the hall marks of a perfect opportunity to turn.
Tomorrow;
Awaiting the turn.
[/vc_column_text][/vc_column][/vc_row]
[/_s2If]
[_s2If current_user_can(access_s2member_ccap_gold)]
[vc_row][vc_column][vc_separator border_width=”5″][/vc_column][/vc_row][vc_row][vc_column][vc_column_text]
GOLD
[/vc_column_text][/vc_column][/vc_row][vc_row][vc_column][vc_separator border_width=”5″][/vc_column][/vc_row][vc_row][vc_column width=”2/3″][vc_custom_heading text=”1 hr” use_theme_fonts=”yes”][vc_column_text]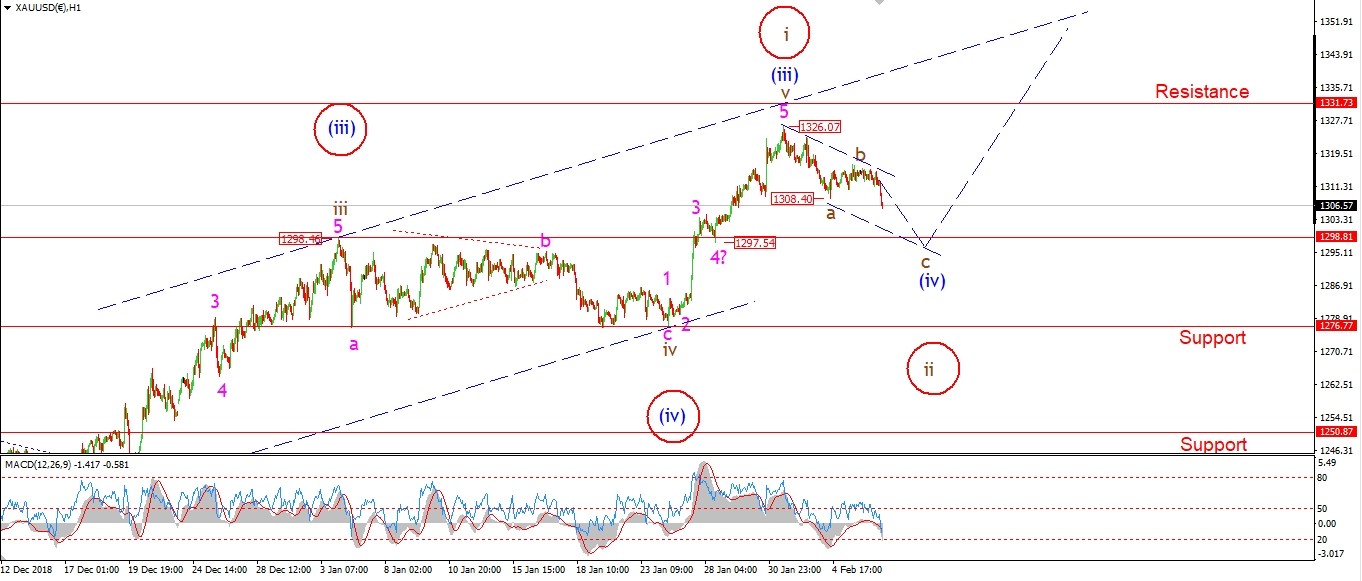 [/vc_column_text][/vc_column][vc_column width=”1/3″][vc_custom_heading text=”4 Hours” use_theme_fonts=”yes”][vc_column_text]
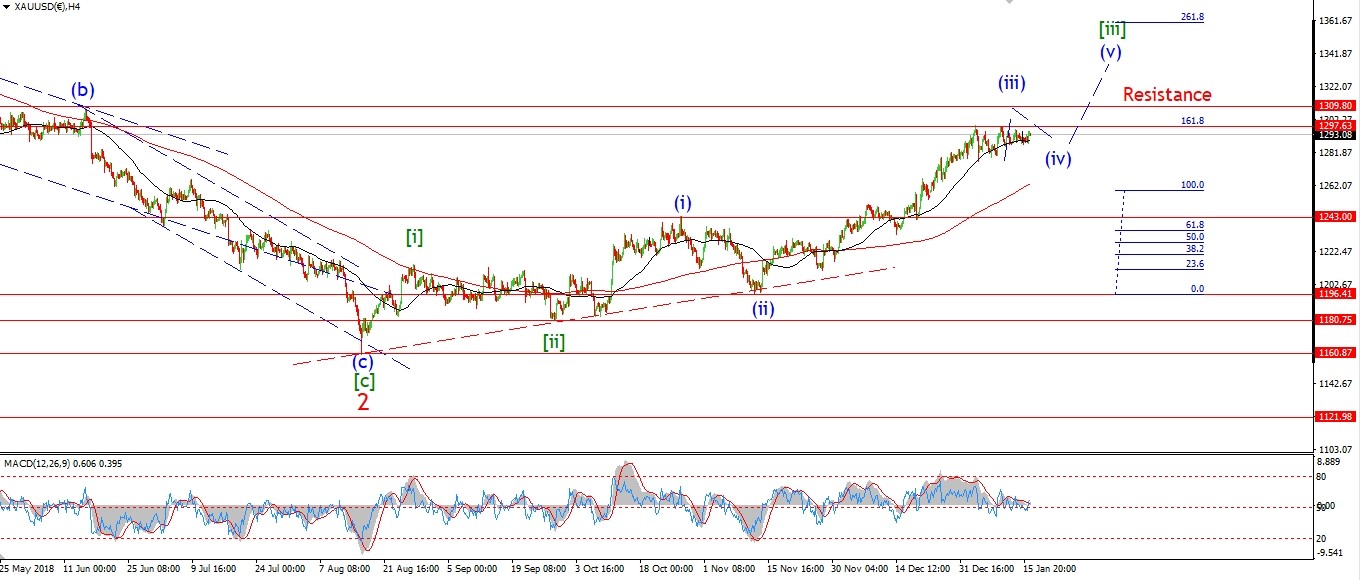 [/vc_column_text][vc_custom_heading text=”Daily” use_theme_fonts=”yes”][vc_column_text]
 [/vc_column_text][/vc_column][/vc_row]
[vc_row][vc_column][vc_column_text]
It looks like wave ‘c’ of (iv) is now underway this evening.
the price is declining with a nice sharp spike lower
as you would expect to see in a ‘c’ wave.
and has now taken out the low of wave ‘a’ at 1308.
This is the minimum target,
but the trend channel and the previous fourth wave both suggest a low for wave ‘c’ at about 1298.
Tomorrow;
Wave ‘c’ should continue lower and hit that lower trend line.
We may even get a reaction higher to begin wave (v) by the end of tomorrows session.
[/vc_column_text][/vc_column][/vc_row]
[/_s2If]
[_s2If current_user_can(access_s2member_ccap_crude)]
[vc_row][vc_column][vc_separator border_width=”5″][/vc_column][/vc_row][vc_row][vc_column][vc_column_text]
U.S CRUDE OIL
[/vc_column_text][/vc_column][/vc_row][vc_row][vc_column][vc_separator border_width=”5″][/vc_column][/vc_row][vc_row][vc_column width=”2/3″][vc_custom_heading text=”1 hr” use_theme_fonts=”yes”][vc_column_text] [/vc_column_text][/vc_column][vc_column width=”1/3″][vc_custom_heading text=”4 Hours” use_theme_fonts=”yes”][vc_column_text]
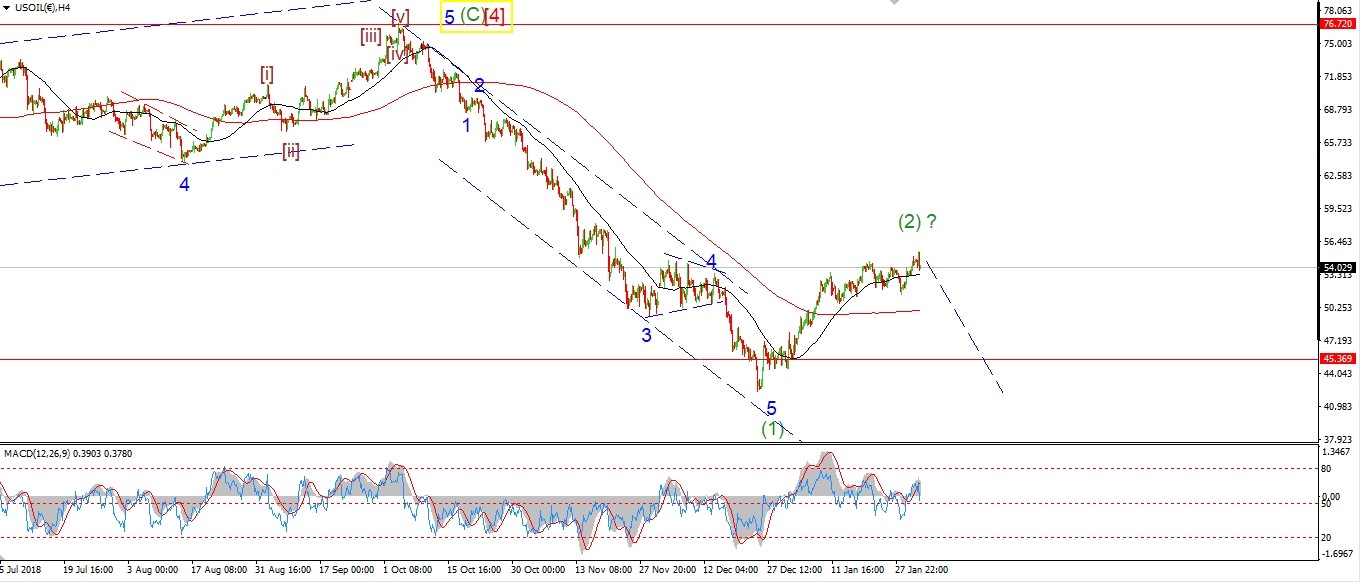 [/vc_column_text][vc_custom_heading text=”Daily” use_theme_fonts=”yes”][vc_column_text]
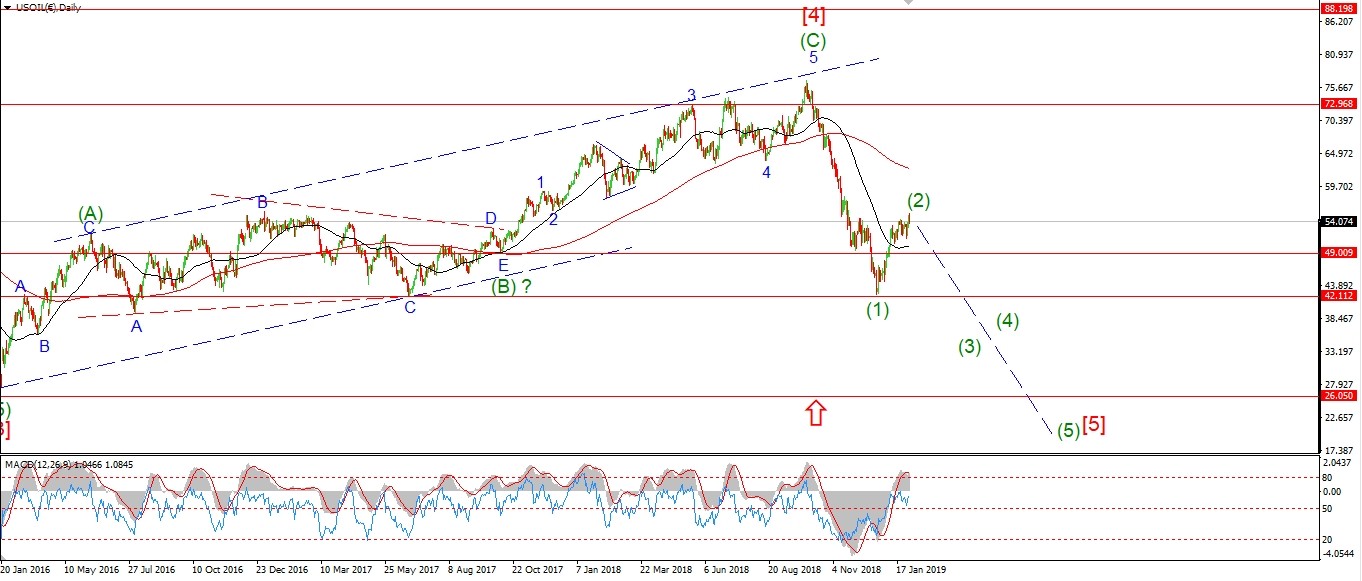 [/vc_column_text][/vc_column][/vc_row]
[vc_row][vc_column][vc_column_text]
Crude has failed to show its hand just yet.
The price has rebounded again today,
but this is possibly a corrective rise in wave ‘ii’ of (iii).
A break of the 53 level again will signal wave ‘iii’ has begun.
I have changed the alternate count this evening
it now shows the recent low at 51.40 as wave ‘B’ of (2).
If this is correct,
then wave ‘C’ of (2) could rally back up to the 60.00 area before wave (3) down begins.
Tomorrow;
55.20 must hold as wave ‘ii’ of (iii) completes,
Wave ‘iii’ of (iii) will be confirmed with a break of 53.00 again.
[/vc_column_text][/vc_column][/vc_row]
[/_s2If]
[_s2If current_user_can(access_s2member_ccap_us10yr)]
[vc_row][vc_column][vc_separator border_width=”5″][/vc_column][/vc_row][vc_row][vc_column][vc_column_text]
US 10 yr Treasuries.
[/vc_column_text][/vc_column][/vc_row][vc_row][vc_column][vc_separator border_width=”5″][/vc_column][/vc_row][vc_row][vc_column width=”2/3″][vc_custom_heading text=”1 hr” use_theme_fonts=”yes”][vc_column_text]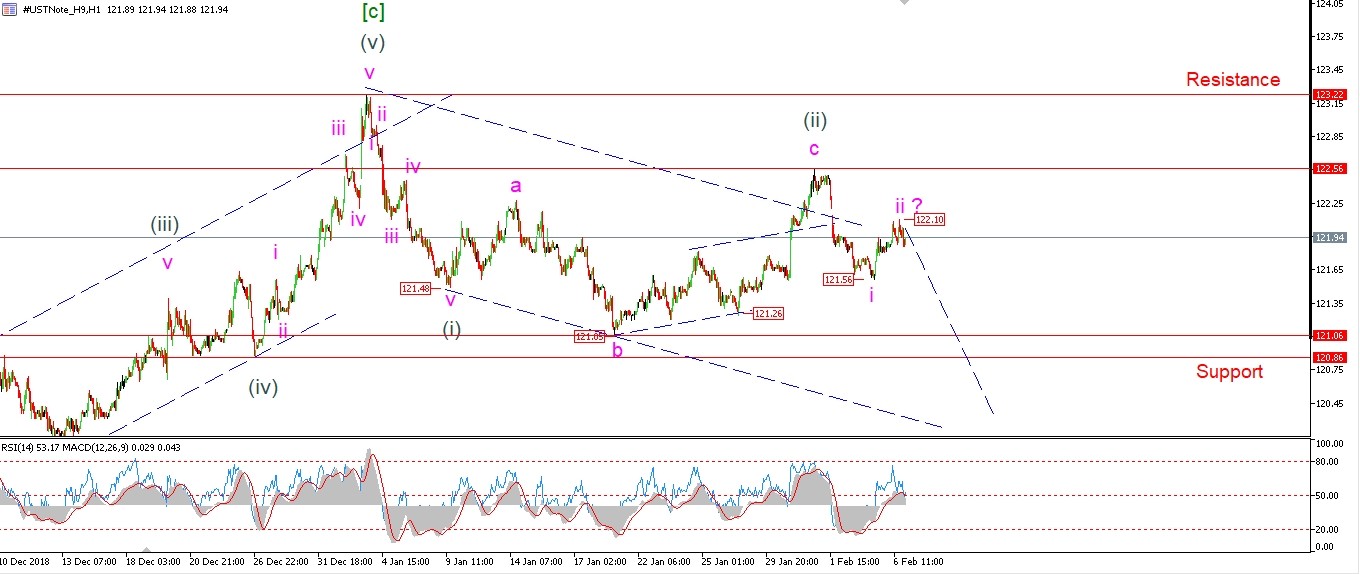 [/vc_column_text][/vc_column][vc_column width=”1/3″][vc_custom_heading text=”4 Hours” use_theme_fonts=”yes”][vc_column_text]
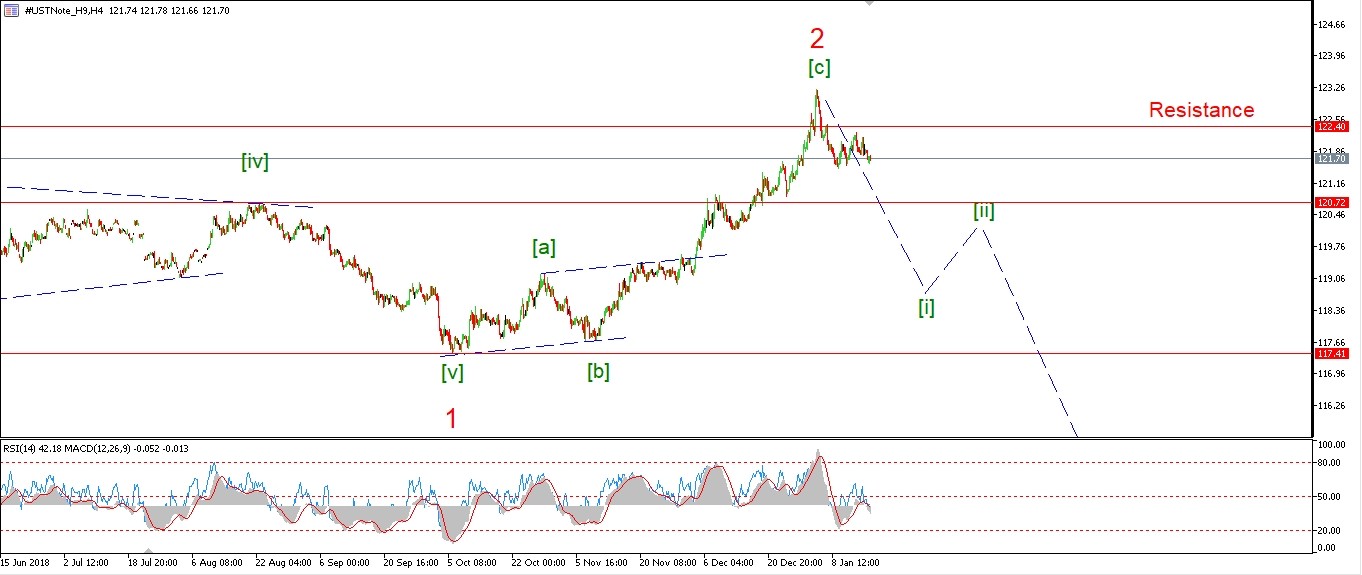 [/vc_column_text][vc_custom_heading text=”Daily” use_theme_fonts=”yes”][vc_column_text]
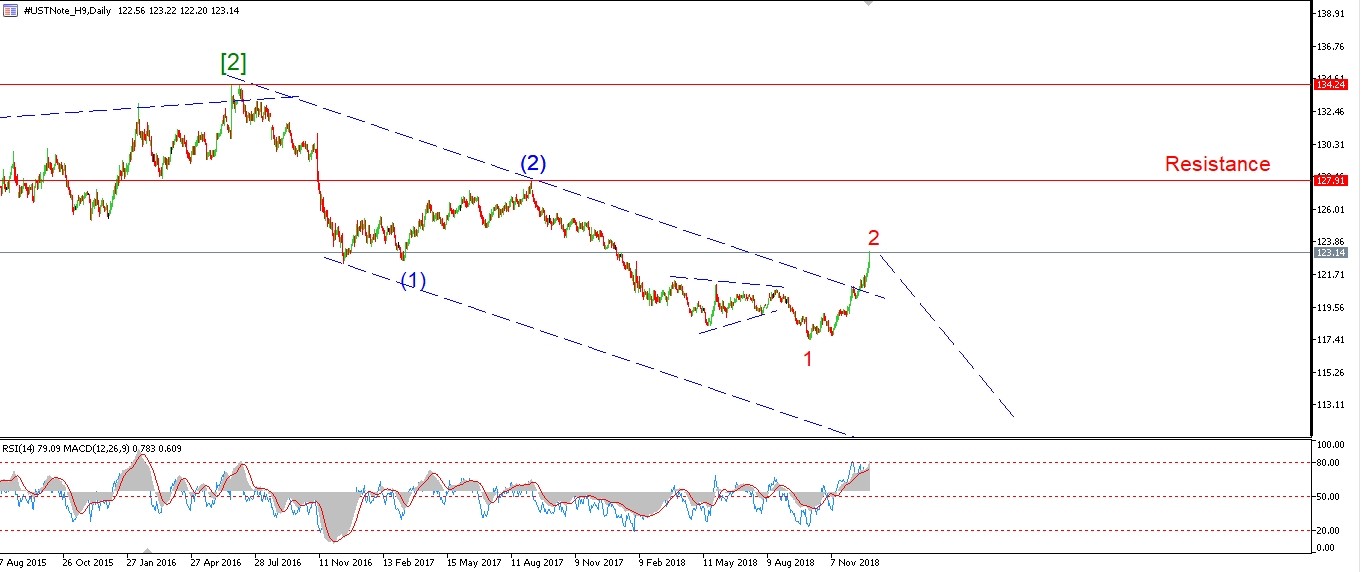 [/vc_column_text][/vc_column][/vc_row]
[vc_row][vc_column][vc_column_text]
A fairly quiet session offers little in the way of clarification on wave ‘ii’ pink yet.
The price is off yesterdays highs at 122.10 alright,
but we have not seen any decline to suggest that wave ‘iii’ down is underway.
It is possible that wave ‘ii’ is still in charge
and in that case we will sinply grind sideways for the next few days before turning lower again in wave ‘iii’.
Tomorrow;
A break of 121.56 will signal that wave ‘iii’ has begun,
For now,
the high at 122.56 must hold.
[/vc_column_text][/vc_column][/vc_row]
[/_s2If]
[_s2If current_user_can(access_s2member_ccap_silver)]
[vc_row][vc_column][vc_separator border_width=”5″][/vc_column][/vc_row][vc_row][vc_column][vc_column_text]
SILVER
[/vc_column_text][/vc_column][/vc_row][vc_row][vc_column][vc_separator border_width=”5″][/vc_column][/vc_row][vc_row][vc_column width=”2/3″][vc_custom_heading text=”1 hr” use_theme_fonts=”yes”][vc_column_text]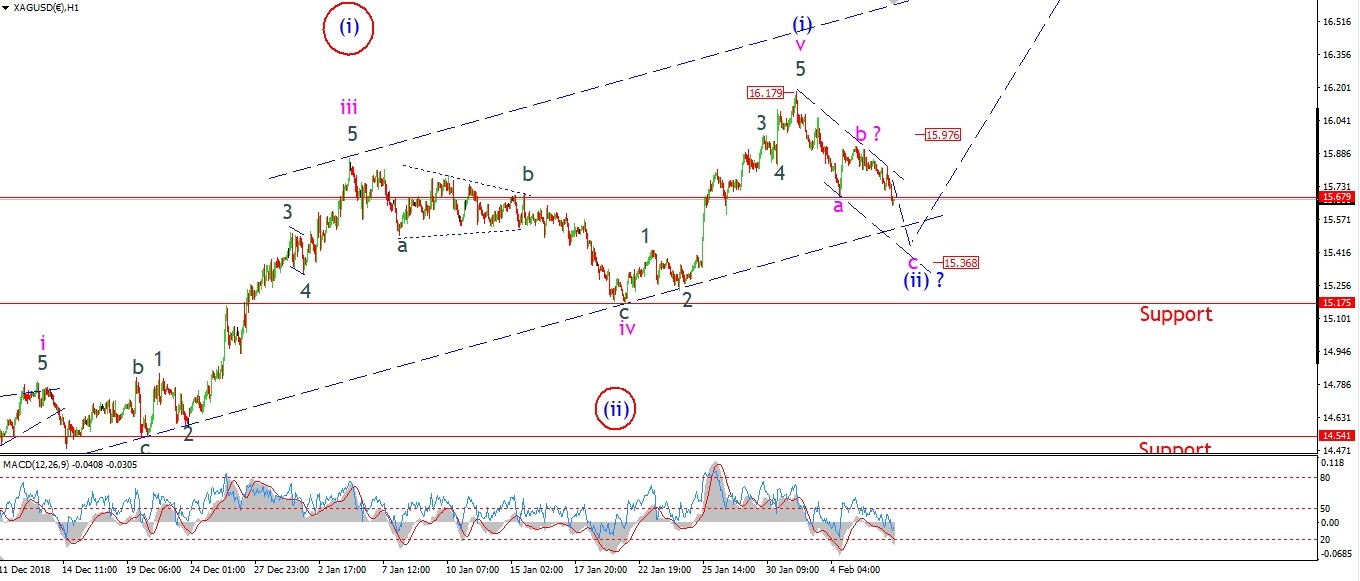 [/vc_column_text][/vc_column][vc_column width=”1/3″][vc_custom_heading text=”4 Hours” use_theme_fonts=”yes”][vc_column_text]
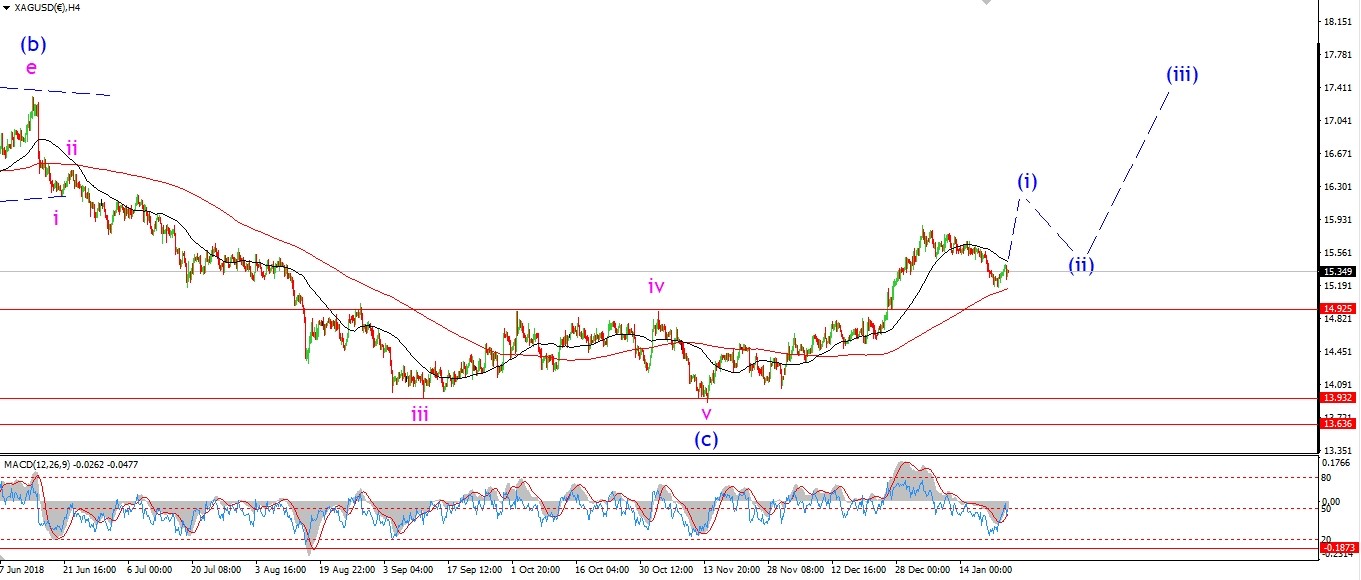 [/vc_column_text][vc_custom_heading text=”Daily” use_theme_fonts=”yes”][vc_column_text]
 [/vc_column_text][/vc_column][/vc_row]
[vc_row][vc_column][vc_column_text]
Silver has broken the wave ‘a’ low at 15.67 this evening.
The price is now moving lower in wave ‘c’ of (ii).
And we should see wave ‘c’ hit that lower trend channel line at 15.36
The previous fourth wave offers the first major support to the price at 15.17.
Tomorrow;
Watch for wave ‘c’ to continue lower into that initial target at 15.36
to complete a three wave correction in wave (ii).
[/vc_column_text][/vc_column][/vc_row]
[/_s2If]
[_s2If current_user_can(access_s2member_ccap_sp500)]
[vc_row][vc_column][vc_separator border_width=”5″][/vc_column][/vc_row][vc_row][vc_column][vc_column_text]
S&P 500.
[/vc_column_text][/vc_column][/vc_row][vc_row][vc_column][vc_separator border_width=”5″][/vc_column][/vc_row][vc_row][vc_column width=”2/3″][vc_custom_heading text=”1 hr” use_theme_fonts=”yes”][vc_column_text]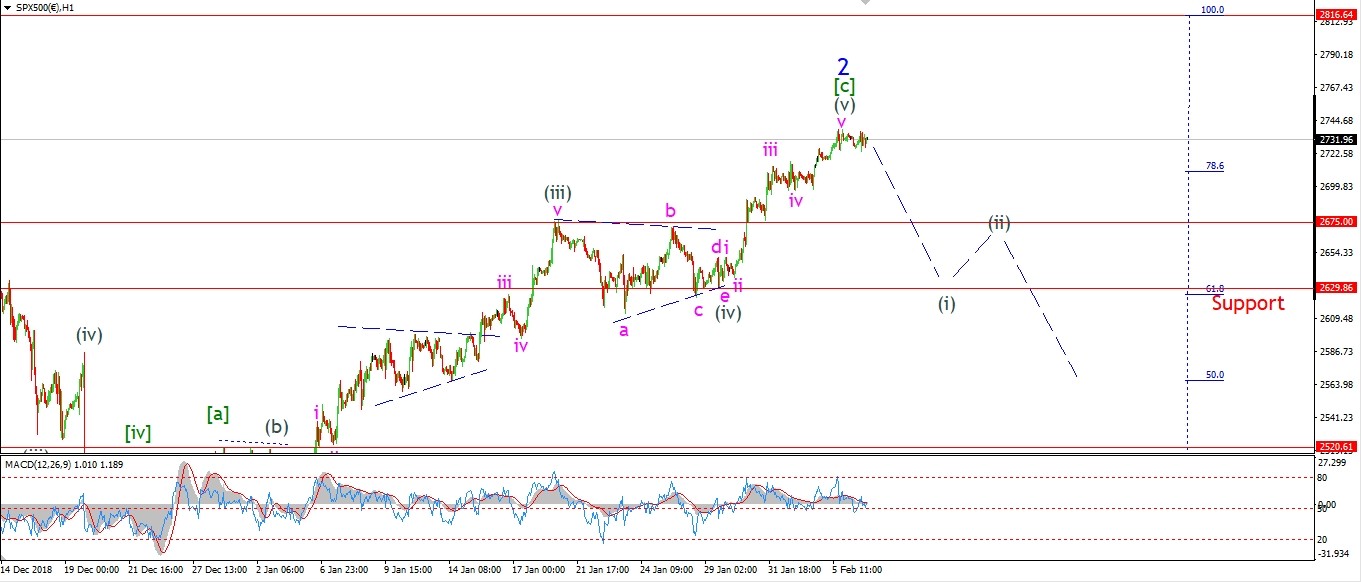 [/vc_column_text][/vc_column][vc_column width=”1/3″][vc_custom_heading text=”4 Hours” use_theme_fonts=”yes”][vc_column_text]
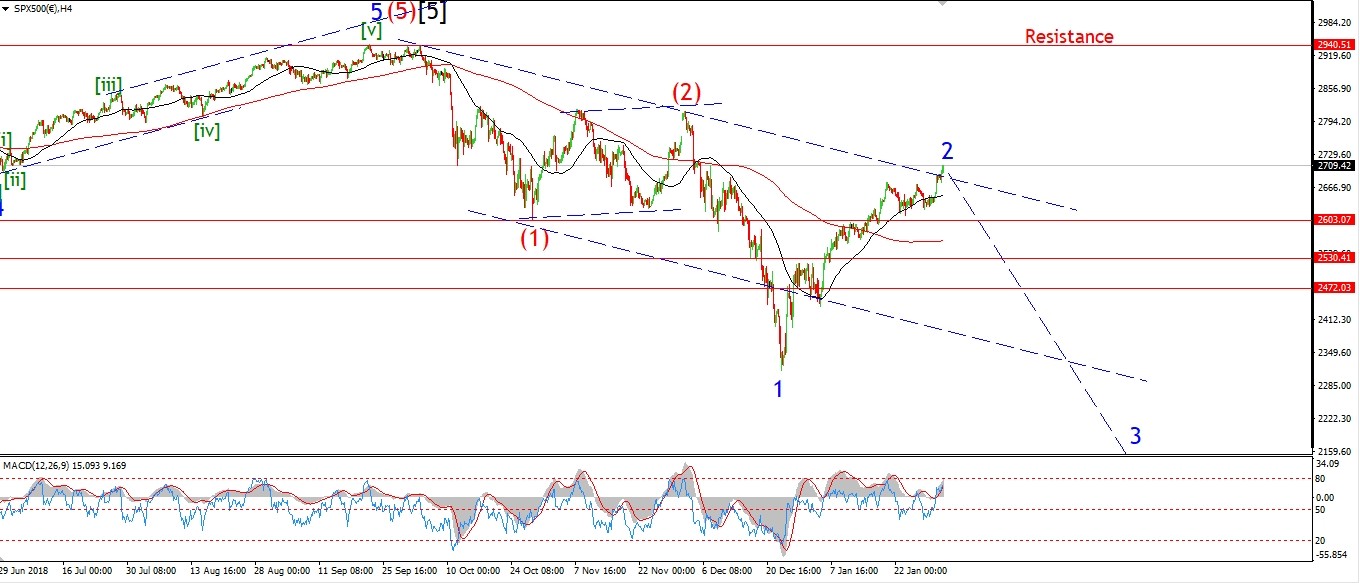 [/vc_column_text][vc_custom_heading text=”Daily” use_theme_fonts=”yes”][vc_column_text]
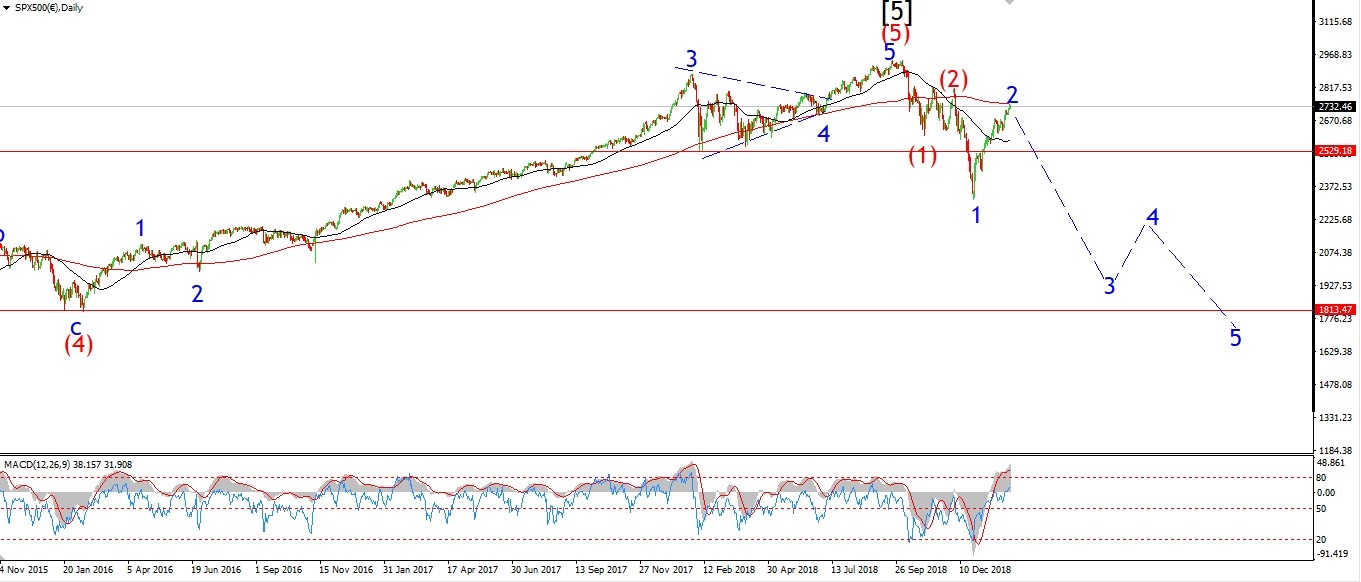 [/vc_column_text][/vc_column][/vc_row]
[vc_row][vc_column][vc_column_text]
The S&P did not make a new high today along with the DOW,
the price has just languished below that high all day holding flat so far.
The same extreme high in momentum is evident on the daily chart.
MACD has flat lined at an extreme to match the last January’s highs.
The very same outcome should follow on this occasion also.
Tomorrow;
For the moment 2675 is the level to watch as the high of wave (iii).
I remain on the lookout for that initial drop to indicate wave (i) down has arrived.
[/vc_column_text][/vc_column][/vc_row]
[/_s2If]
[vc_row][vc_column][vc_column_text]
[/vc_column_text][/vc_column][/vc_row]
[vc_row][vc_column][vc_separator border_width=”5″][/vc_column][/vc_row]