
Good evening to one and all.
The Lord’s Blessing’s to you all again tonight.
https://twitter.com/bullwavesreal
EURUSD.
EURUSD 1hr.
EURUSD 4hr.

EURUSD daily.
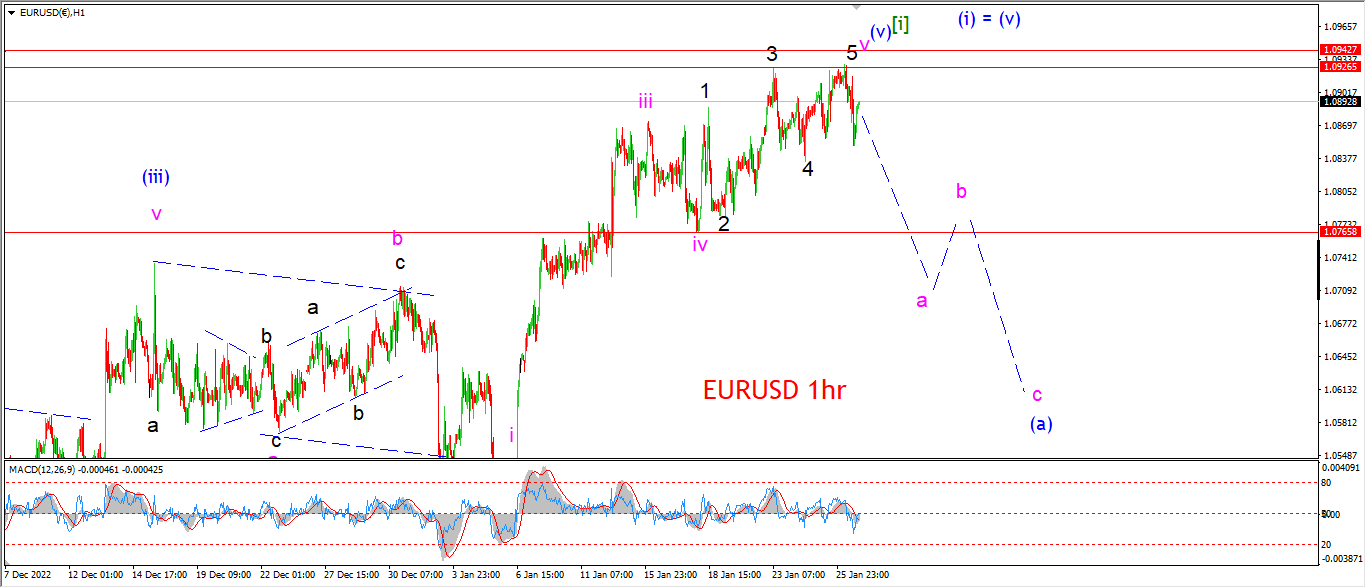
A miniscule new high today in wave ‘v’ of (v) and that was followed by a 60 pip drop.
It is another day of no changes to the wave count though.
I can’t decide if the top is in for wave ‘v’ or if there is something different going on here.
It is a pretty strange topping pattern going on here in general.
I have shown a possible alternate way of labelling the action as an ending diagonal fifth wave.
But in general the action is all pointing to a topping formation here no matter how I look at it.
Tomorrow;
the signal level for this reversal in wave (a) is now droped to 1.0765.
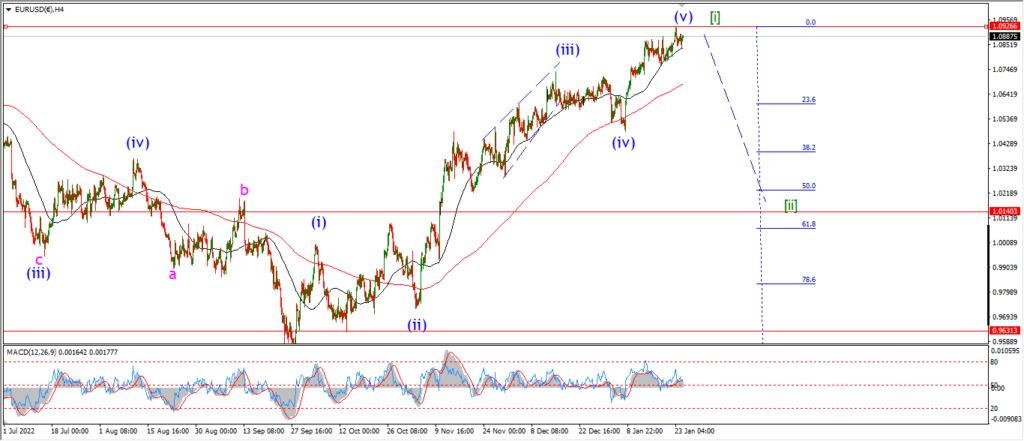
So I am watching for a break of that level to begin the journey down into wave [ii].
GBPUSD
GBPUSD 1hr.
GBPUSD 4hr.

GBPUSD daily.
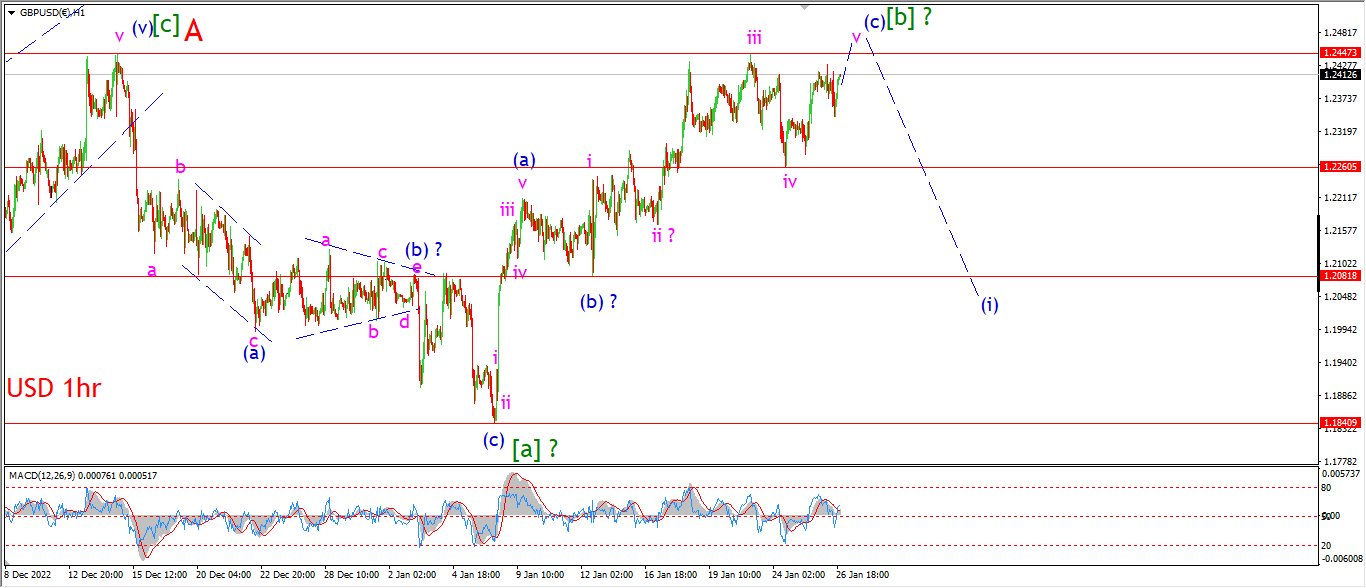
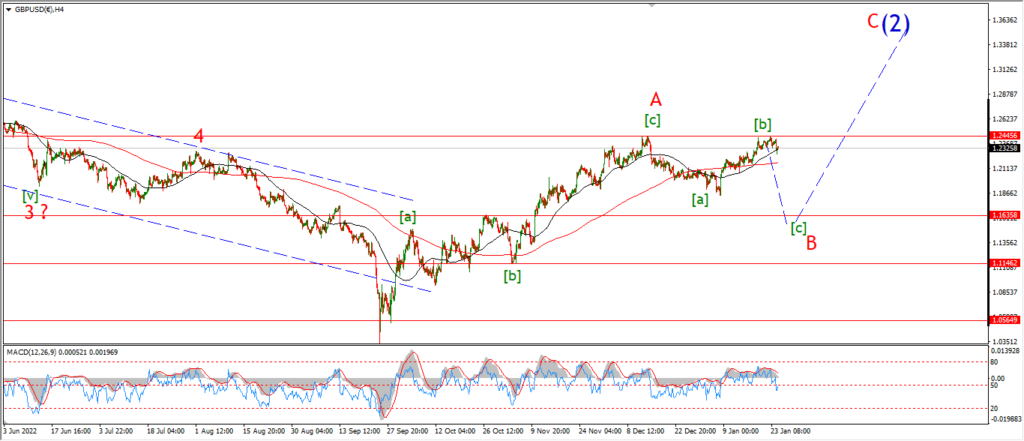
the hunt for a top in wave [b] is proving just as difficult here as in EURUSD.
The price is stuck in a range for the last week now with no resolution either way.
I am again looking at a possible new high for wave ‘v’ of (c) this evening.
and until wave ‘v’ resolves,
I cant look lower into wave (i) of [c] with any confidence.
Tomorrow;
Watch for wave ‘v’ of (c) to top out again.
Wave ‘iv’ lies at 1.2260 so that level remains the signal level for a possible reversal.
USDJPY.
USDJPY 1hr.
USDJPY 4hr.

USDJPY daily.
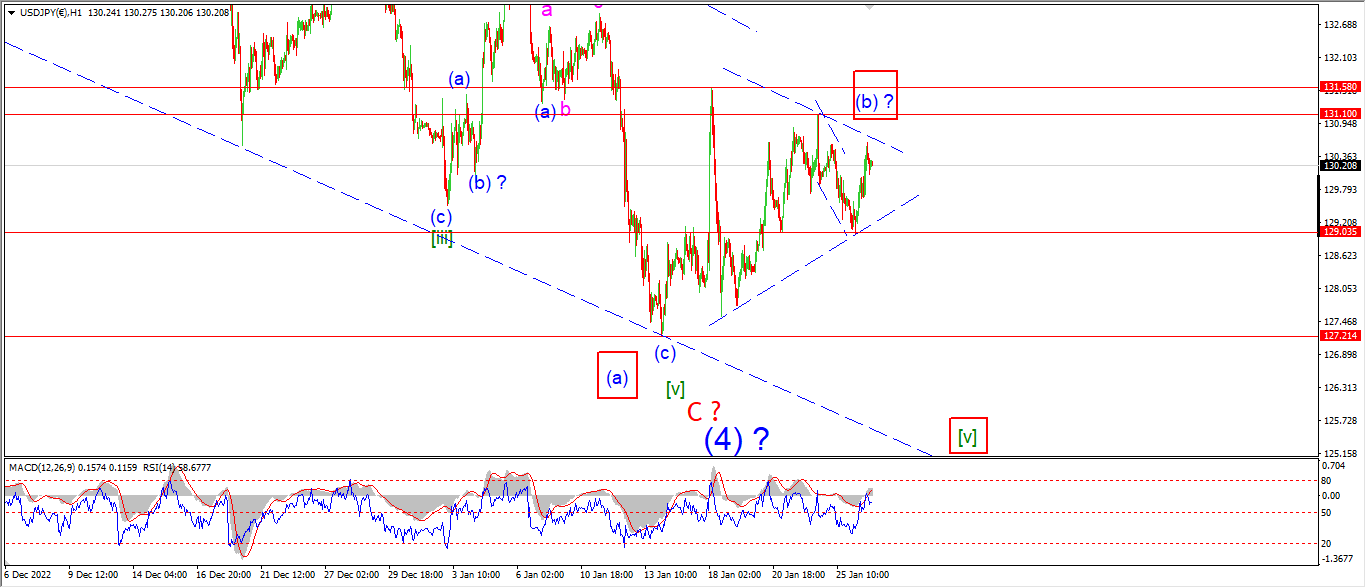
USDJPY has jumped around an awful lot over the last 10 days,
but in the end the price has met net zero actual progress in any direction.
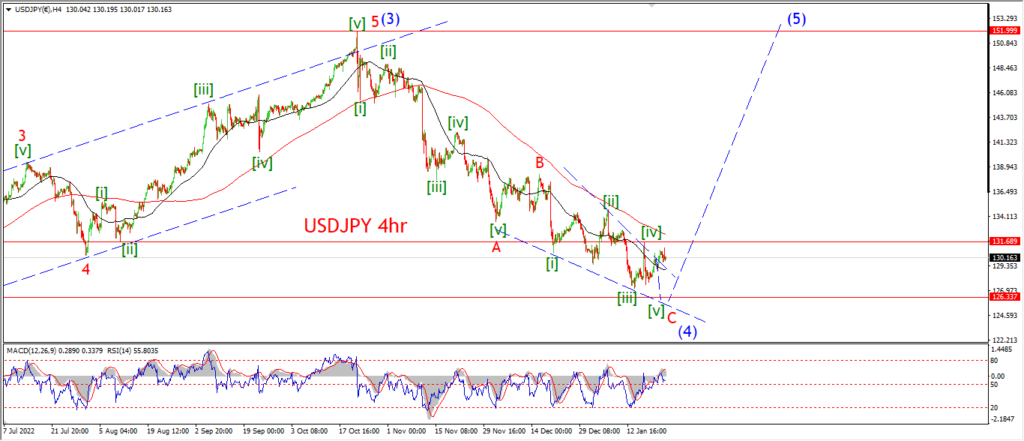
The actoin has neither confirmed that the low is in for wave (4),
or has it confirmed that a new impulsive pattern is underway into wave (5) yet either.
So we are stuck in this waiting period looking for something to happen in order to breath life back into the pattern here.
I have shown a possible developing triangle as an alternate wave (b) of [v].
If the price breaks down out of this triangle tomorrow then I think we can look to a new low in wave (c) of [v] next week.
But even this pattern has its problems!
So again I am going to wait for the market to make a decision.
Tomorrow;
We will get an answer on the operating pattern when the market decides how it will break the converging trend lines.
A break higher will signal the bullish interpretation is correct,
and a break lower will favor the bearish.
DOW JONES.
DOW 1hr.
DOW 4hr
DOW daily.
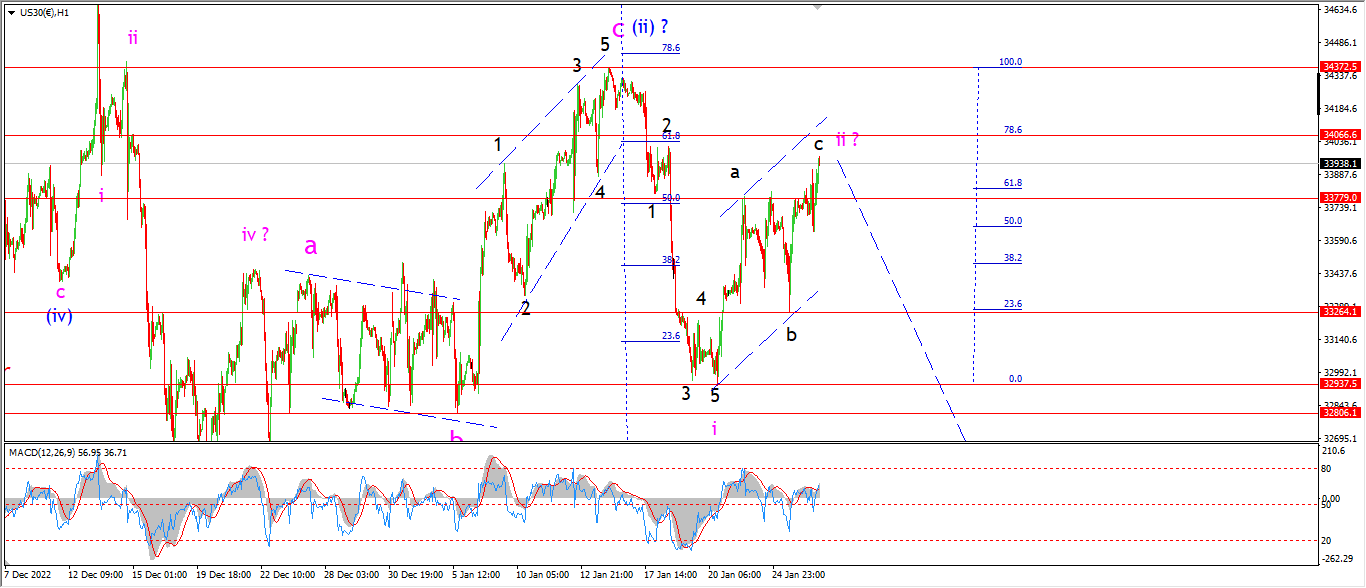
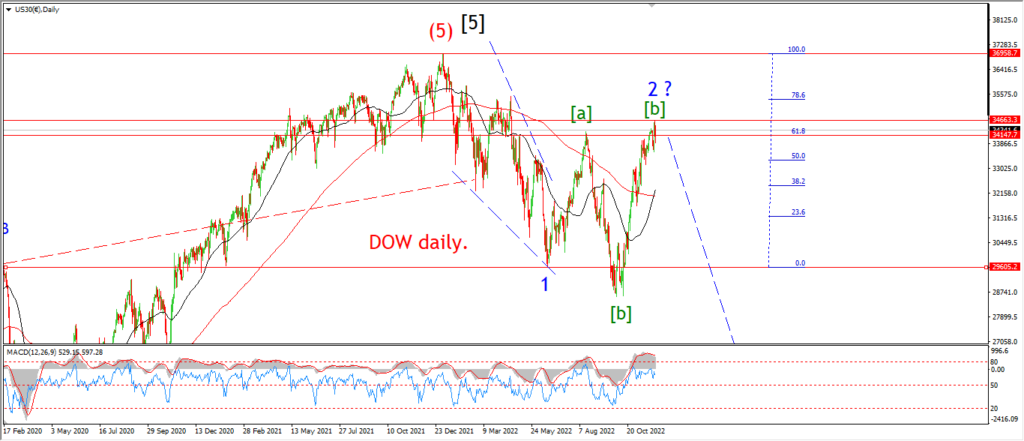
We remain on cloud 9 here today with wave ‘c’ of ‘ii’ holding onto the action for one more day.
The pattern in wave ‘ii’ is holding a three wave corrective form.
And right now the market has rallied back into the usual Fibonacci zone between the 62% and 78% retracement levels of wave ‘i’.
As I mentioned a few nights ago,
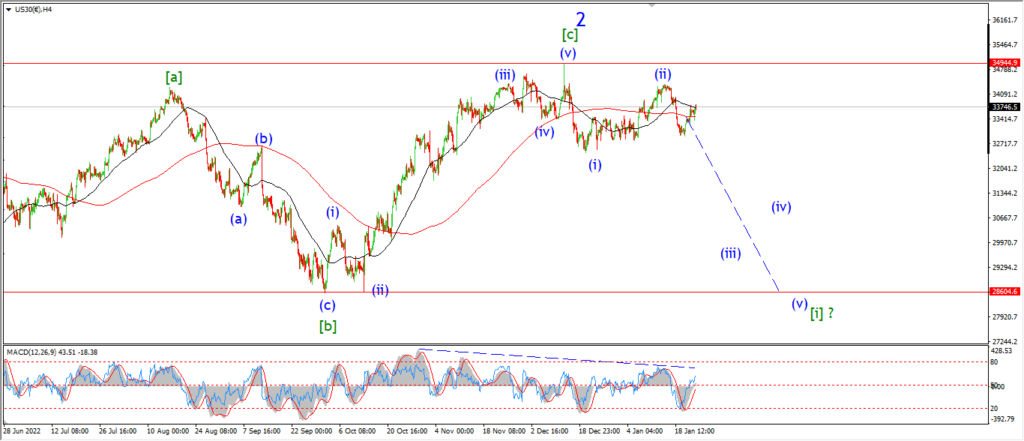
this impulse pattern in waves ‘i’ and’ii’ is an almost carbon copy of the higher degree impulse in waves (i) and (ii).
Wave (ii) failed just under the 78% retracement level and then fell rapidly into wave ‘i’.
I think we should be expecting a similar outcome here to kick off wave ‘iii’ of (iii).
Tomorrow;
the market may well hold on for Fridays trade before rolling over next week.
I know this is frustrating,
waiting and nothing happening!
I can only point to the patterns that are building and suggest that the outcome remains the very same here.
Watch for this wave ‘c’ of ‘ii’ rally to complete.
A break of the wave ‘b’ low at 33260 will signal wave ‘1’ of ‘iii’ has begun.
GOLD
GOLD 1hr.
GOLD 4hr.

GOLD daily.
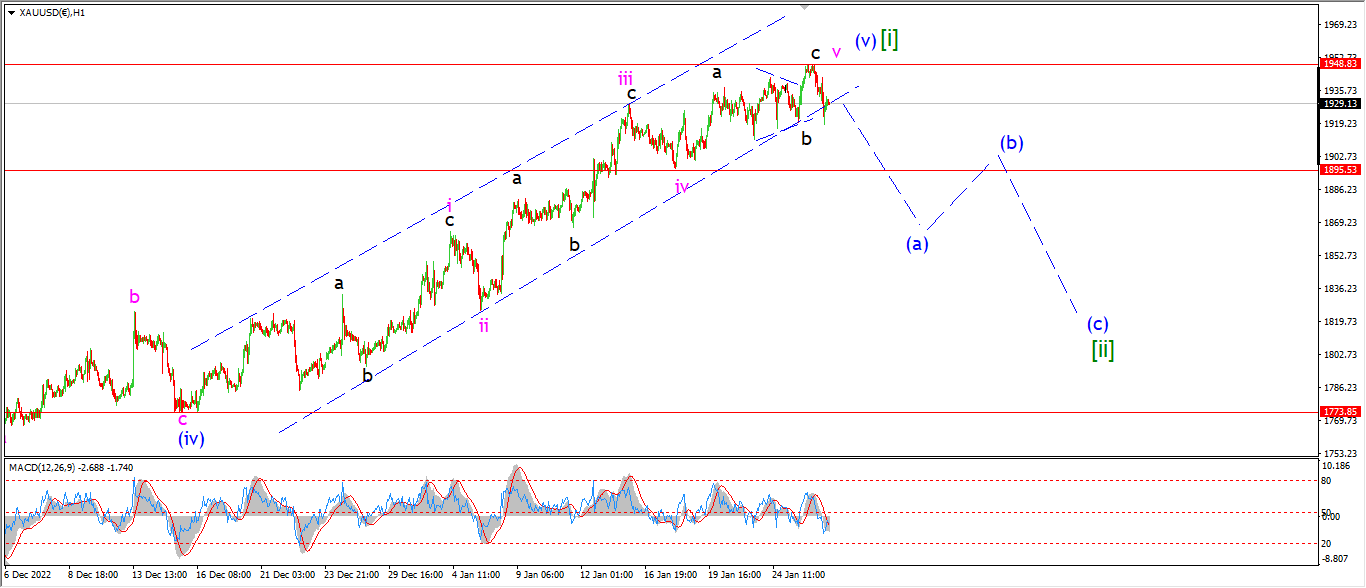
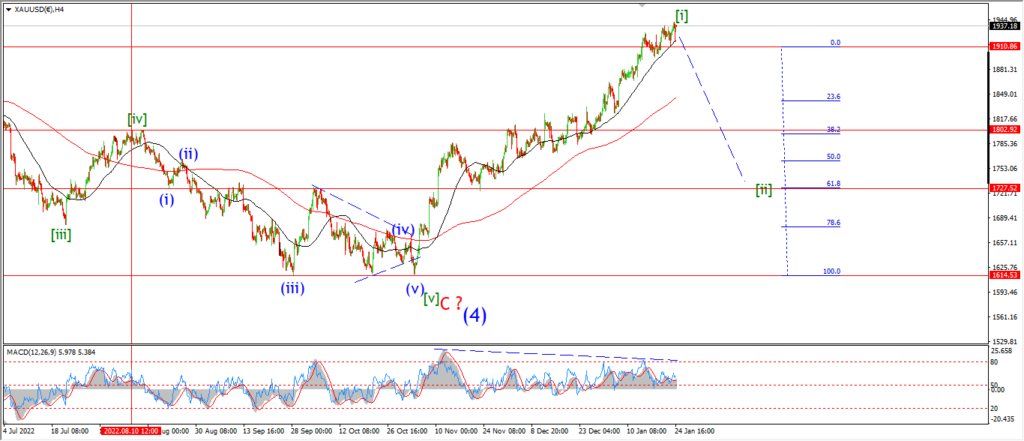
gold managed a step lower today after reaching that new high in wave ‘c’ of ‘v’.
The initial support level has not broken yet,
so there is no supporting evidence for a top in place yet.
That 1895 level remains key to this pattern rolling over.
A solid break of 1895 again will signal wave (a) is underway.
Tomorrow;
Watch for wave (v) to hold at todays highs of 1948.
Wave (a) of [ii] should begin with a break of the wave ‘iv’ low at 1895.
CRUDE OIL.
CRUDE OIL 1hr.
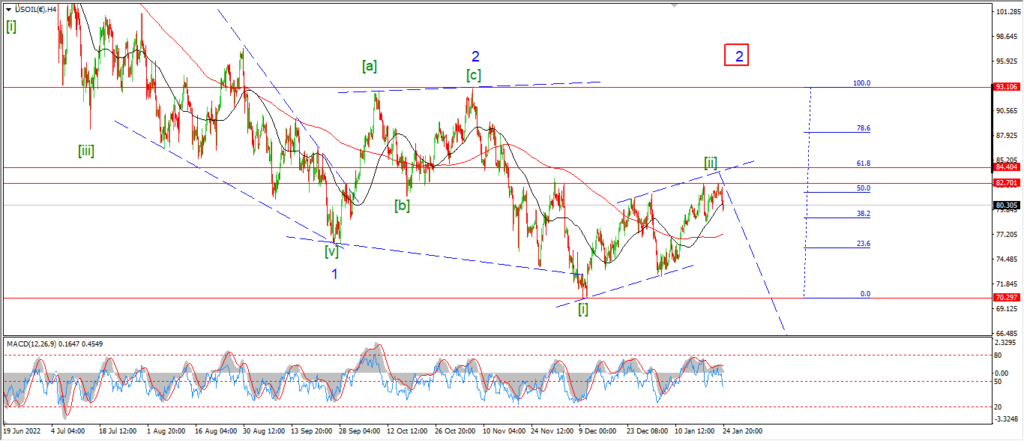
CRUDE OIL 4hr.
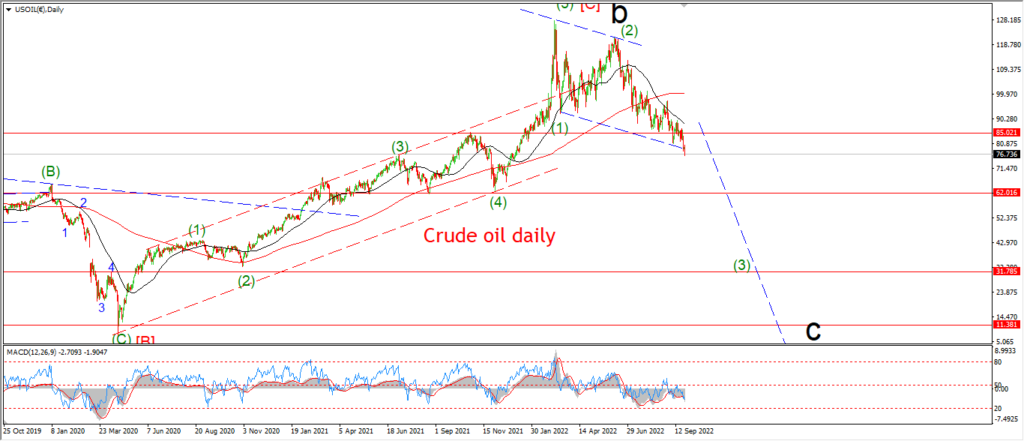
CRUDE OIL daily.
The markets have been so quiet and resigned this week that it is hard to offer new insight each night!
That won’t stop me talking though!
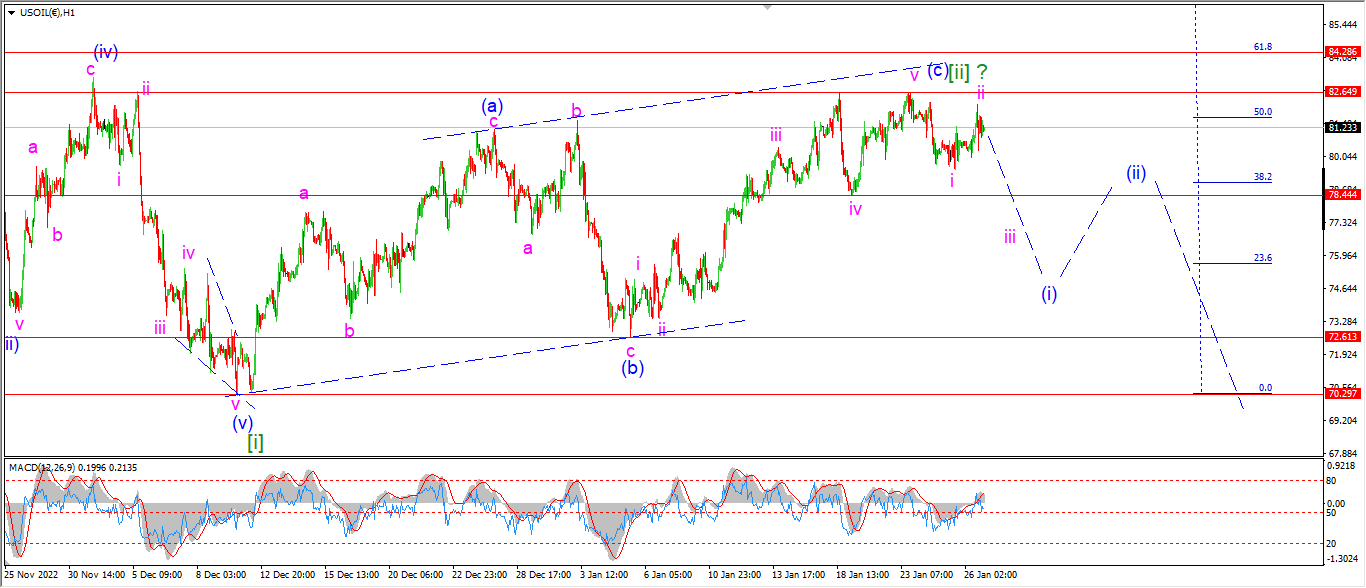
Crude is holding below the recent high again tonight and as long as that wave [ii] high remains unchallenged,
then we have a chance that wave (i) of [iii] is beginning.
This market is mirroring the stock market very well these days.
Both classes of asset are stepping their way down in a dance into the coming third wave.
And in the case of crude oil,
we have all the markers of a completed correction in place.
all we need now os for that third wave down to begin.
Tomorrow;
Watch for wave ‘i’ and ‘ii’ to hold below that recent high at wave [ii].
A break below 78.40 again will signal wave (i) of [iii] is underway.
S&P 500.
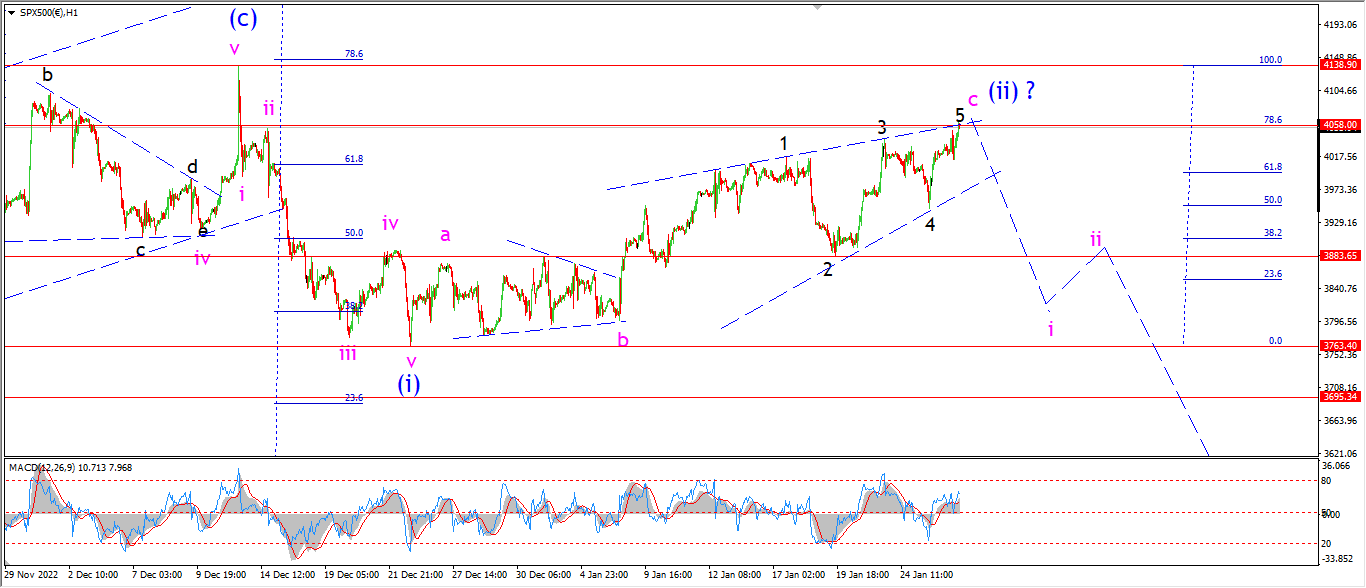
S&P 500 1hr
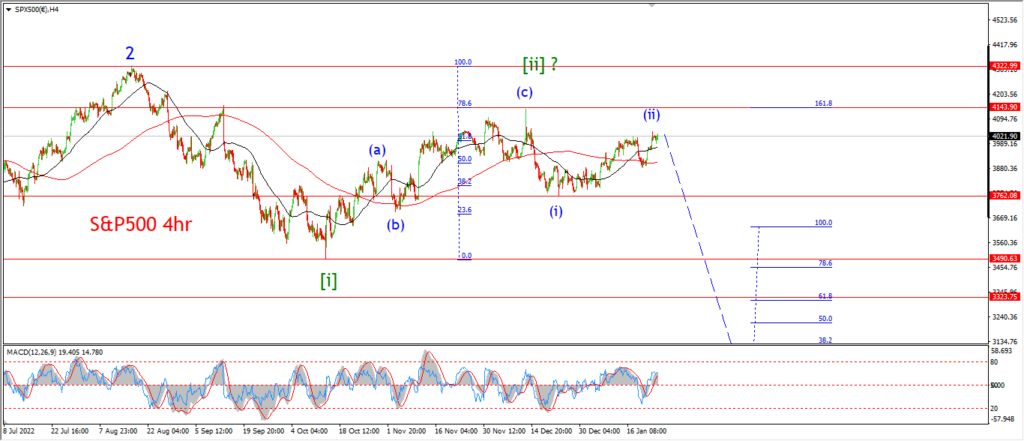
S&P 500 4hr
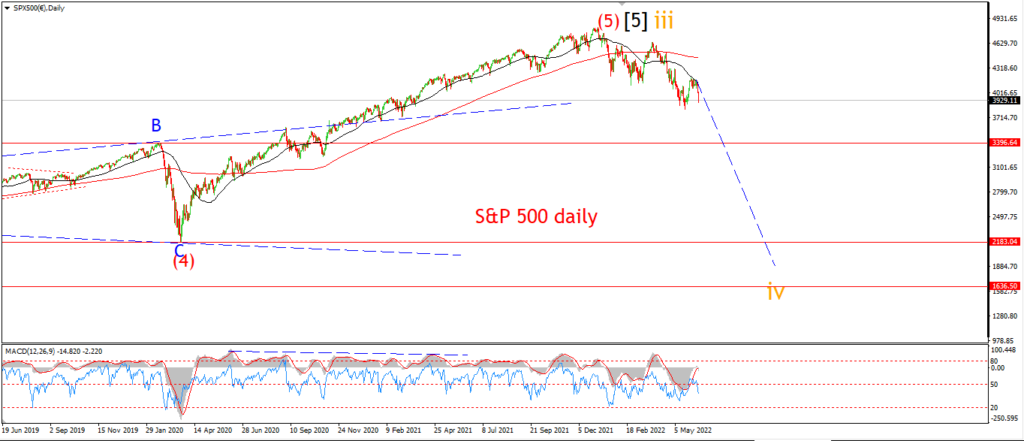
S&P 500 daily.
The S&P has now closed in on the upper trend line of the diagonal pattern this evening.
The wedge shape of that action is getting tight here.
And the market is now sitting on that 78.6% retracement level of wave (i) as we close.
Is that Fib level going to stop this rally now?
well I sure hope so,
A break above that wave [ii] high at 4138 will really complicate matters here,
so I am not going to follow this pattern to its end until it is invalidated or priven correct.
Tomorrow;
Watch for that top line of the ending diagonal pattern to hold and wave ‘i’ of (iii) to tiurn lower.
if the market manages to drop out of the wedge tomorrow,
that will favor the idea that wave ‘c’ is complete.
A break of 3880 again will signal wave ‘i’ is underway.
SILVER.
SILVER 1hr
SILVER 4hr.
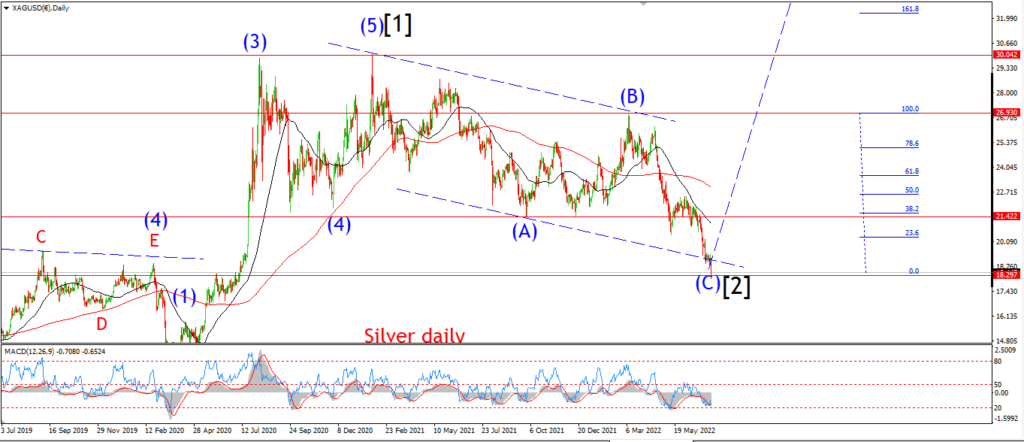
SILVER daily.
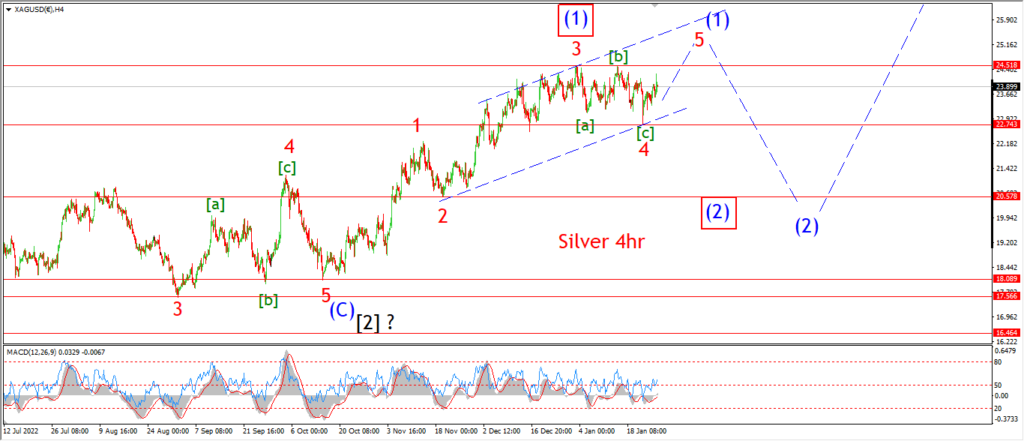
take a look at the 4hr chart to begin with.
I have now dropped the idea that we are correcting higher into wave ‘4’,
and I have adopted a similar idea to gold for the main wave count.
This rally can be viewed as an ongoing impulse wave higher in wave (1) of [3] up.
And if this count is correct here,
then we are about to begint he biggest rally in the history of the silver market over the coming years.
But before we tuen all in bullish here,
there is the little matter of a second wave retracement to navigate first.
And I can be sure if wave (2) has already begun,
or if there is still one more leg higher into wave ‘5’ of (1) left.
you can see that illustrated by the alternate count.
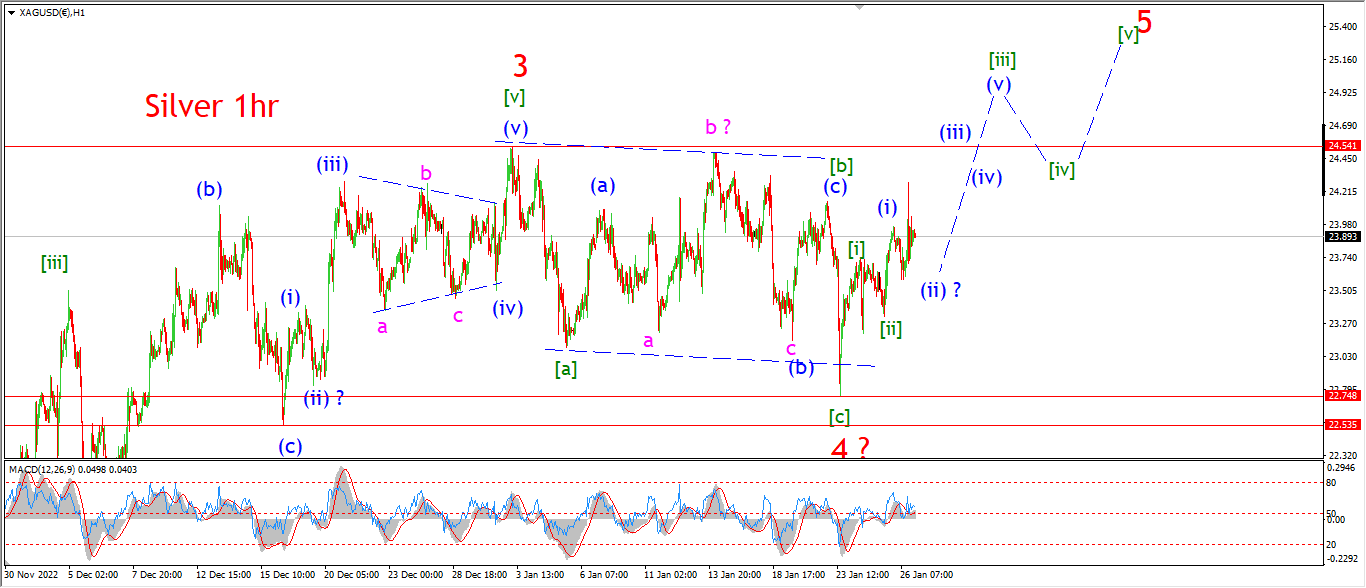
As for the hourly chart,
The action is just as confusing today as it has been.
I am running with the idea that wave ‘5’ of (1) is underway.
Wave [i] and [ii] of ‘5’ may be complete,
with wave [iii] now beginning.
If that is correct then we will see afurther rally next week into a new high in wave [iii] of ‘5’.
As I said before,
the action is not very clear at all here,
and with a new count things can change quickly.
That alternate count on the 4hr chart may come back into focus again and clear the whole pattern up next week.
I will have to wait and see.
Tomorrow;
I still think that there is a bigger opportunity to buy into silver at a second wave higher low as shown on the 4hr chart.
that will come near the 20.00 handle again.
Lets see how wave ‘5’ of (1) develops over the next few days to see if the pattern clears up.
BITCOIN
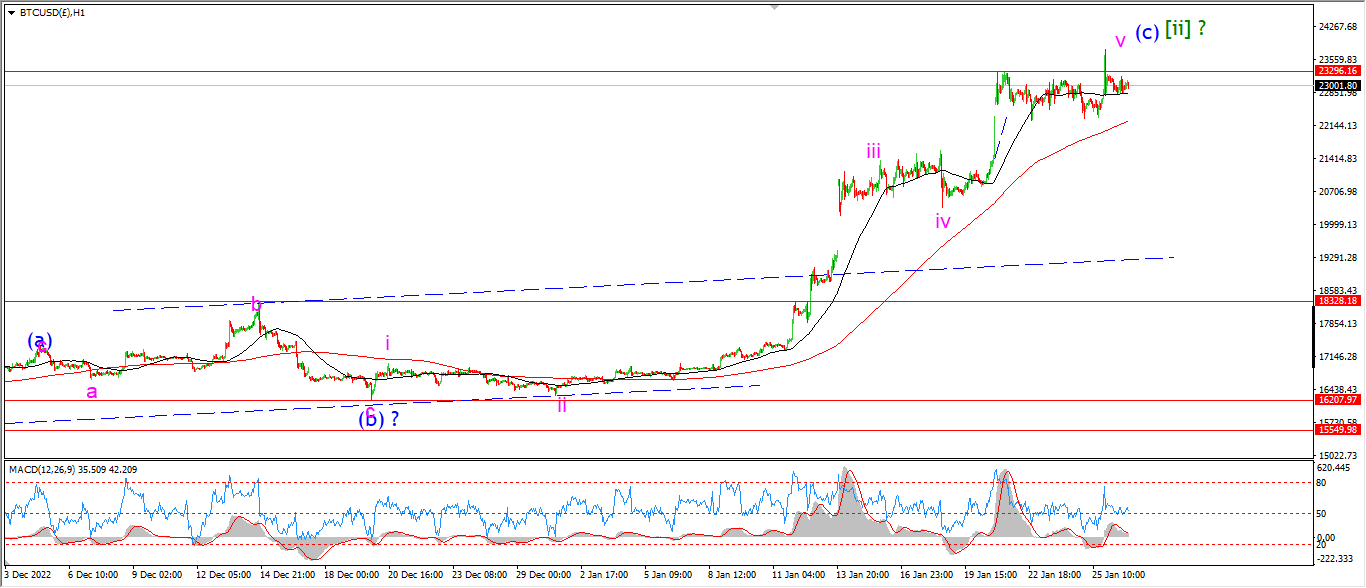
BITCOIN 1hr.
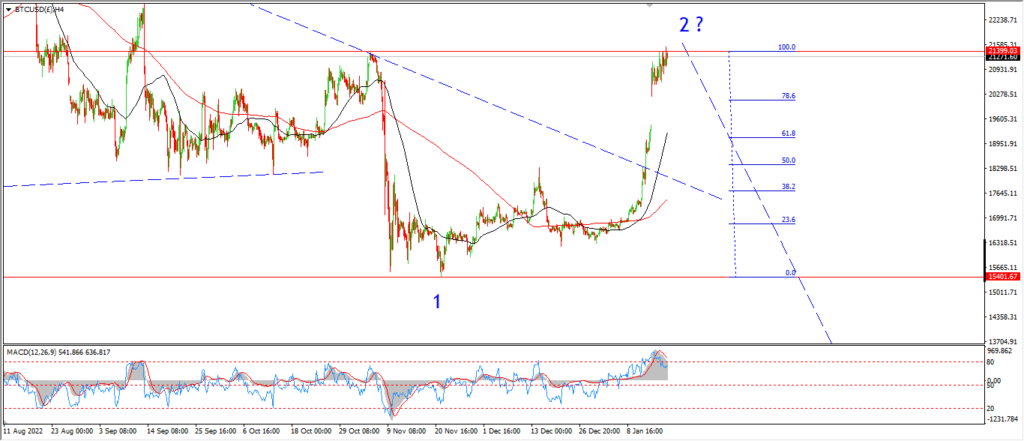
BITCOIN 4hr.

BITCOIN daily.
….
FTSE 100.
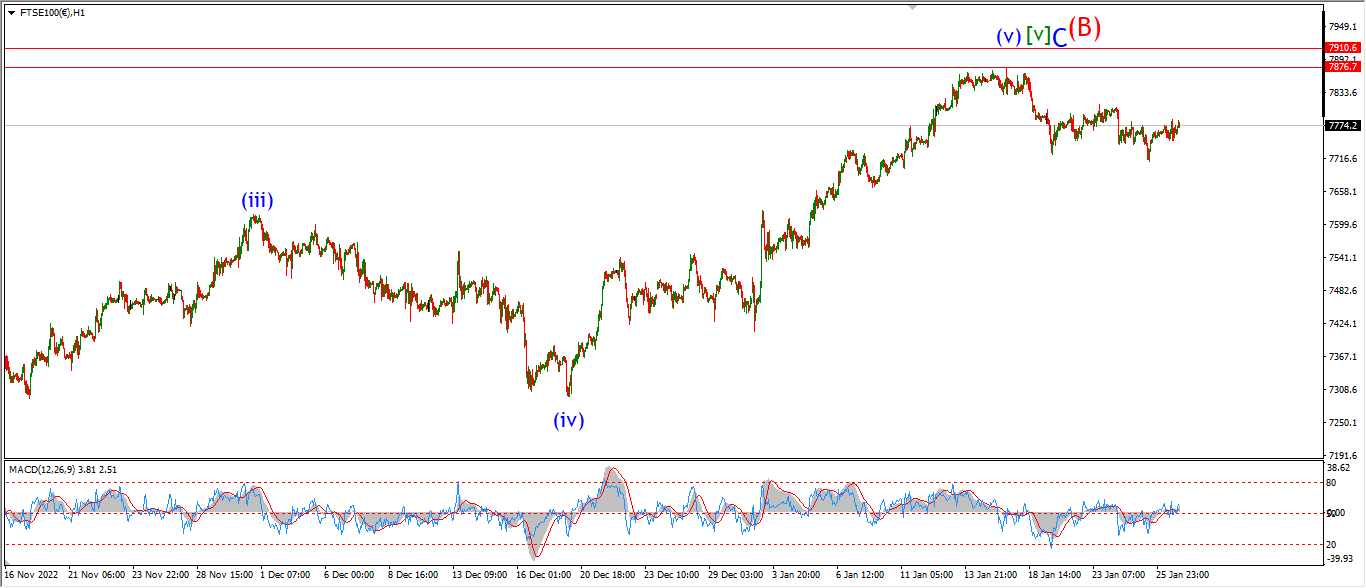
FTSE 100 1hr.
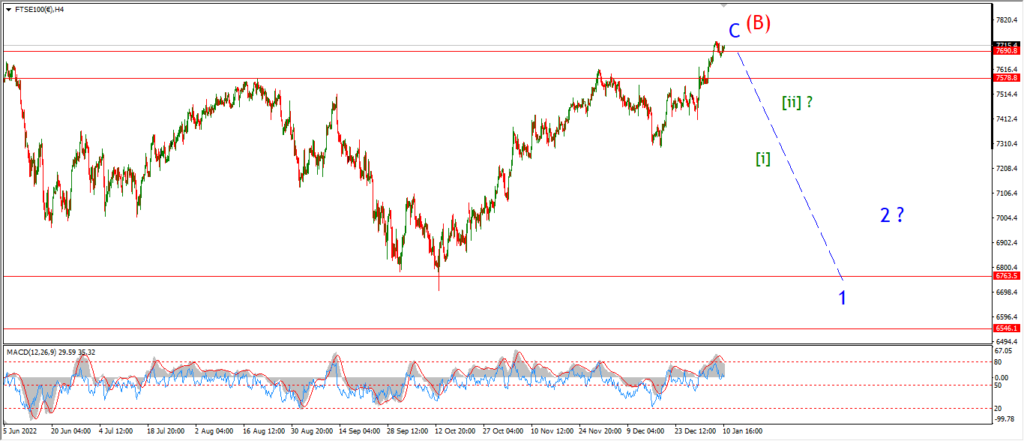
FTSE 100 4hr.

FTSE 100 daily.
….
DAX.
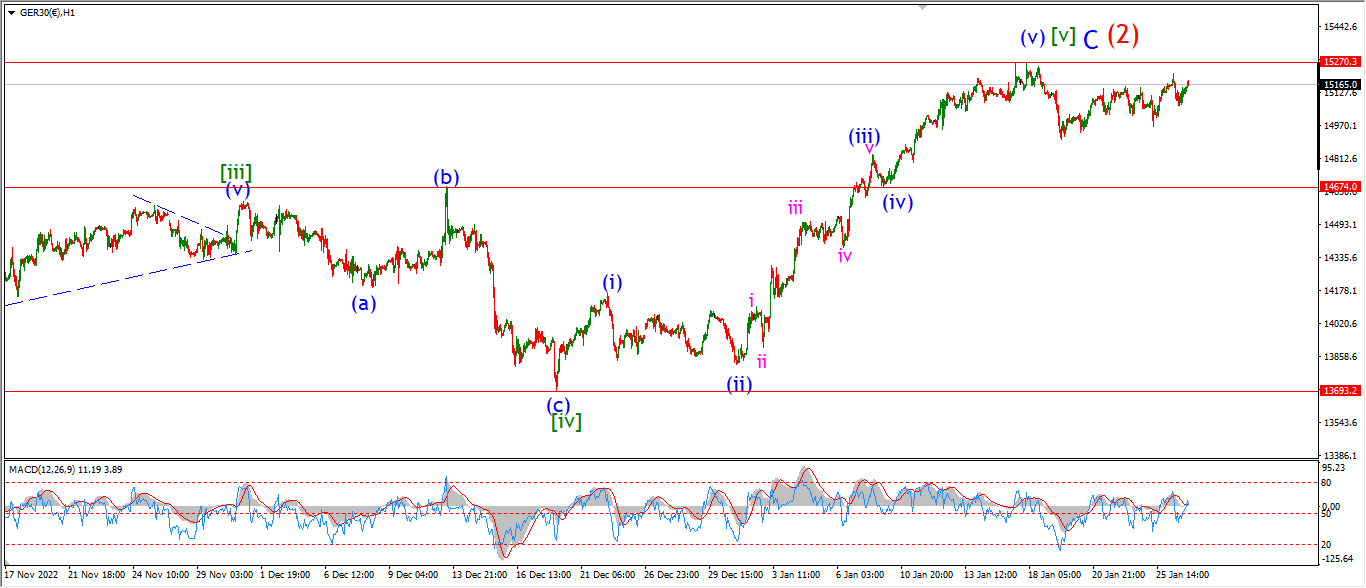
DAX 1hr
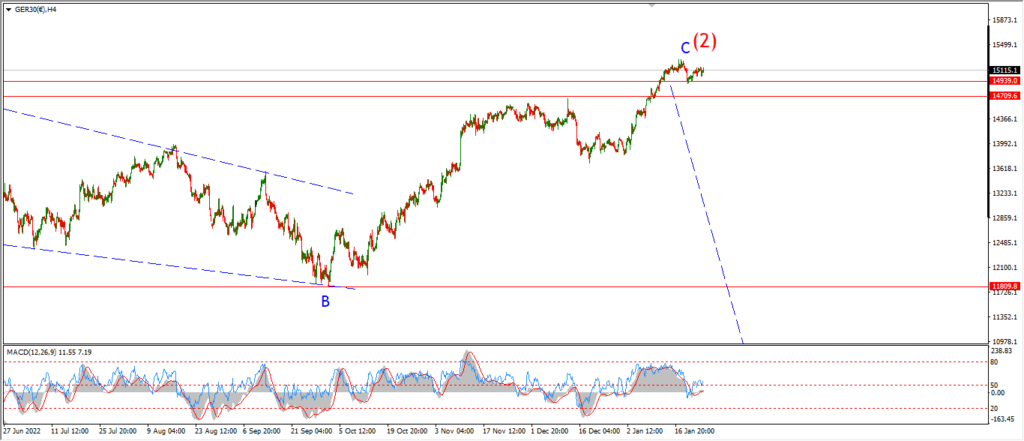
DAX 4hr

DAX daily.
….
NASDAQ 100.
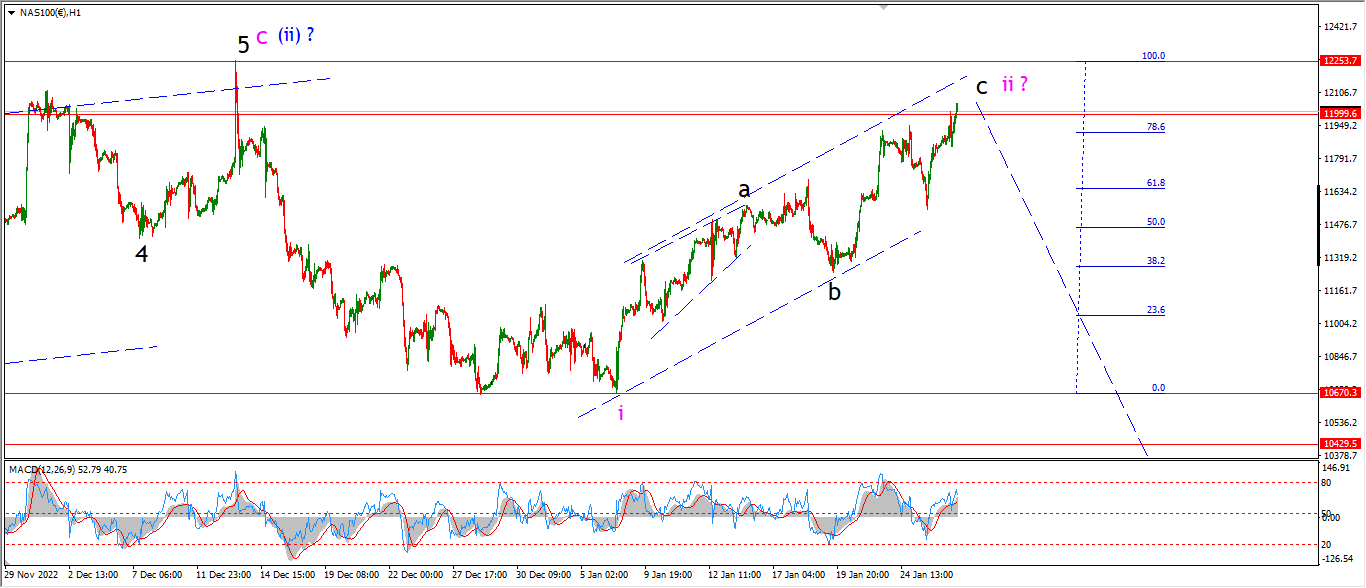
NASDAQ 1hr
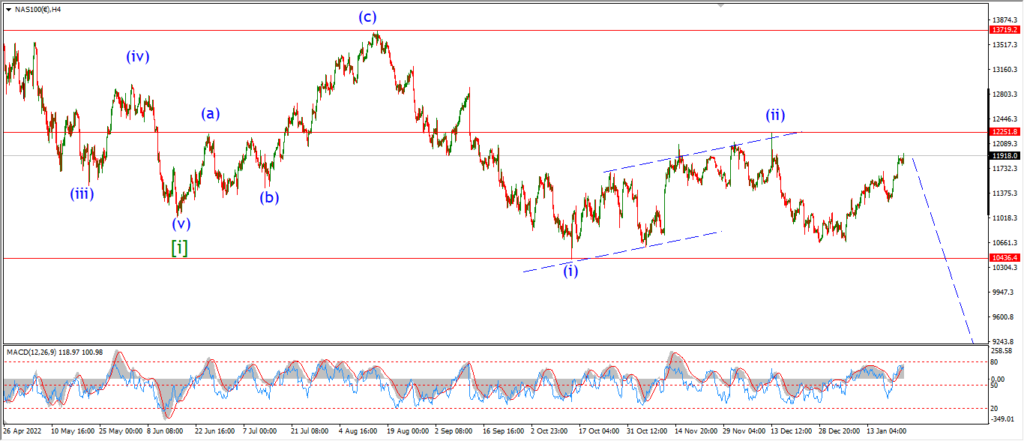
NASDAQ 4hr.

NASDAQ daily.
….