
Good evening to one and all.
The Lord’s Blessing’s to you all again tonight.
Another drift day today and I am at that point where my patience is getting thin!
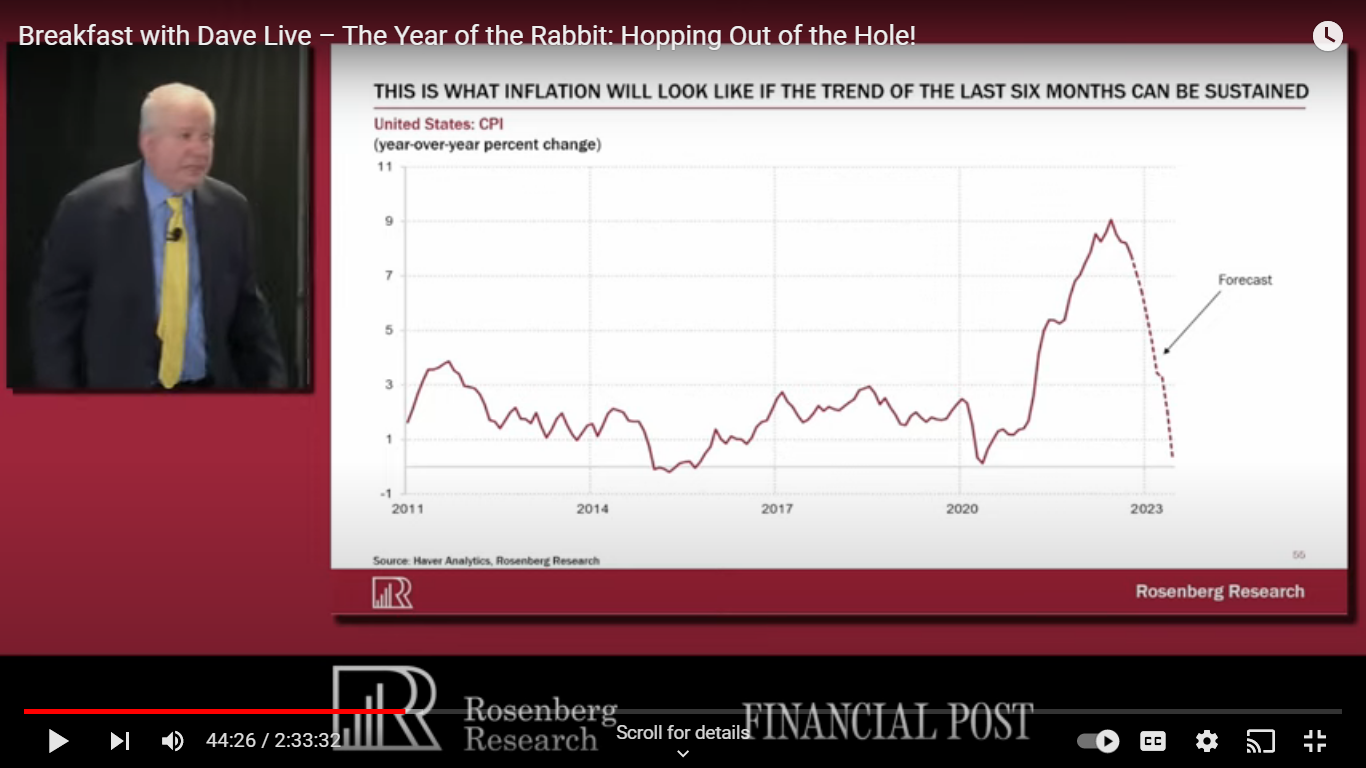
It really does seem like the market is in a kind of dream state.
The reality of the mean reversion has not sunk in yet at all.
I am getting a clear memory over the last few days of early 2008.
everyone though the worst was behind us and whatever was going on was well under control.
meanwhile people just soldiered on with their lives as if everything was fine.
The markets had declined a little on paper,
but there was no economic fallout and people still had their jobs for the most part.
then one little thing happened,
and all hell broke loose.
credit markets froze.
nobody trusted anyone.
the markets went into freefall.
asset prices collapsed.
Banks shut down overnight.
companies began drop kicking everyone out the door.
unemployment went through the roof.
social unrest climbed.
and then people began to panic.
A sleepwalking world, suddenly woke up in a nightmare.
And here we are,
sleepwalking again,
with a nightmare building quickly around us.
https://twitter.com/bullwavesreal
EURUSD.
EURUSD 1hr.
EURUSD 4hr.

EURUSD daily.
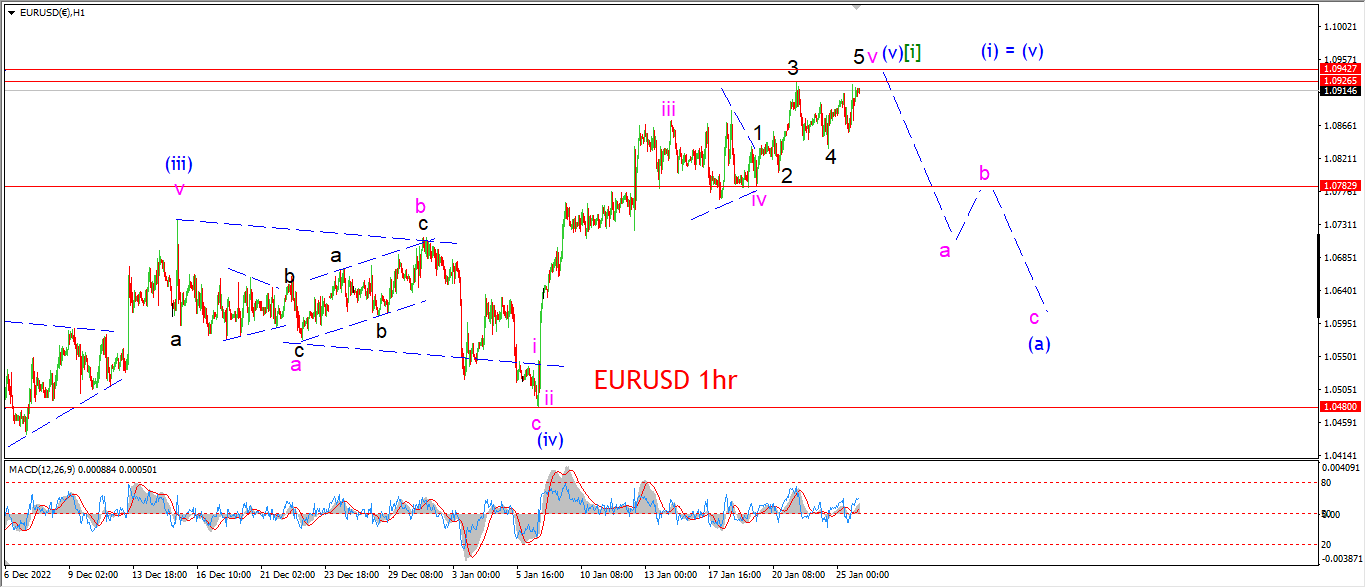
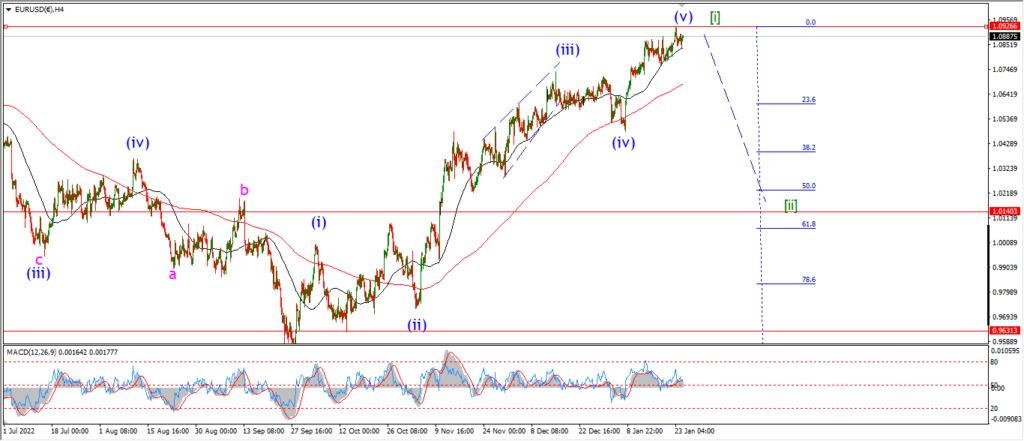
EURUSD is moving in a corrective pattern this week and that is confirmed with todays sideways trade, again!
There is another possiblity for wave ‘iv’ and ‘v’ that gives us maybe another session to complete the pattern in wave (v) blue.
but then we really must seee progress to the downside to begin wave (a).
Overall nothing has changed in the larger pattern for wave [i] and [ii].
The real issue is my capacity to remain patient!
Tomorrow;
The pattern in wave (a) will show its hand eventually.
I may even be too forgiving by allowing wave ‘v’ another chance at a new high this week.
Wave ‘a’ down can also trace out three waves down and if we see a drop below 1.0783 tomorrow,
that is the pattern I will switch to.
GBPUSD
GBPUSD 1hr.
GBPUSD 4hr.

GBPUSD daily.
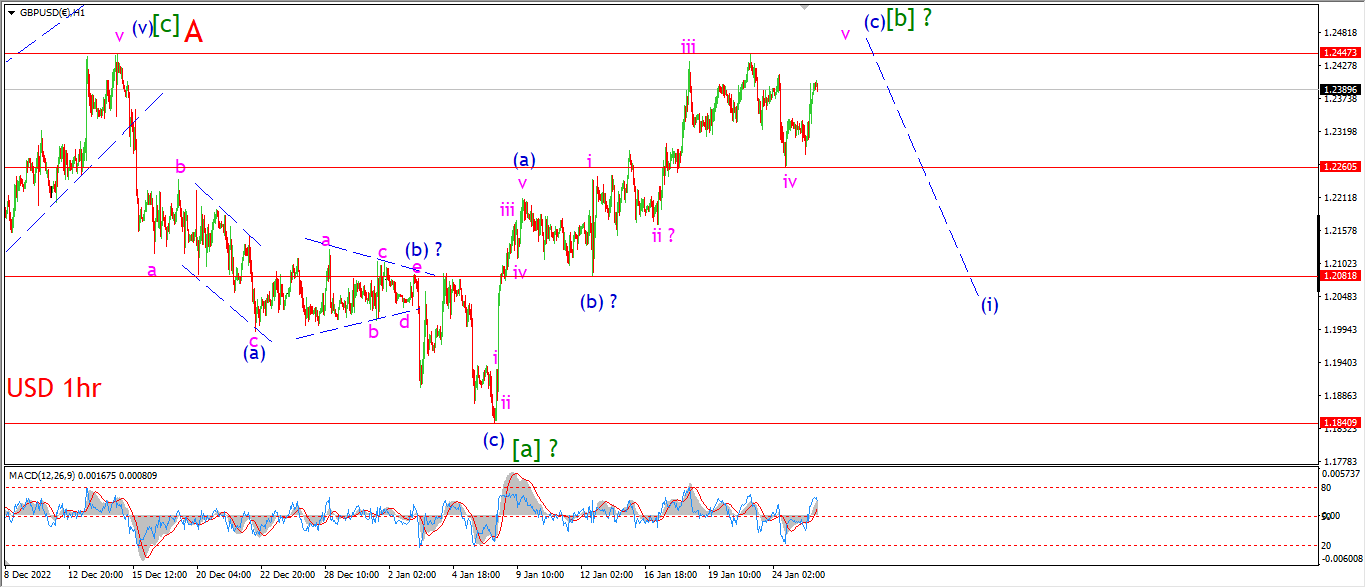
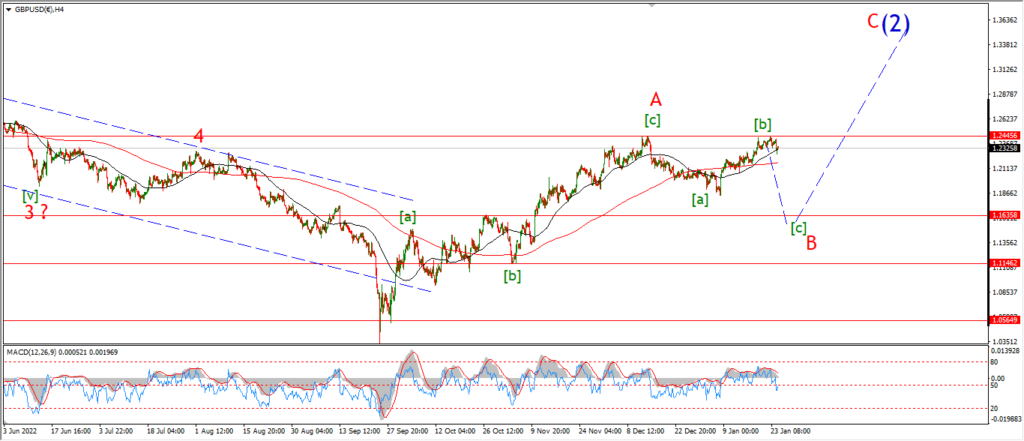
At the moment in cable we have a three wave pattern higher into todays high.
The price is still holding a lower high below the recent top.
But I am not happy that an impulsive pattern lower is underway here after todays rally.
There is a possibility that wave ‘iv’ traced out a complex expanded flat pattern into this weeks lows.
And now the rally off wave ‘iv’ is turning higher in wave ‘v’ of (c).
That high at 1.2447 has been hit twice now and so far that has proved the stopping point to the rally.
A third failure below that level will pretty much confirm wave [c] is underway.
Tomorrow;
Watch for wave ‘v’ of (c) of [b] to complete that final top and roll over before the end of this week.
A break of 1.2260 again will signal wave (i) of [c] is underway.
USDJPY.
USDJPY 1hr.
USDJPY 4hr.

USDJPY daily.
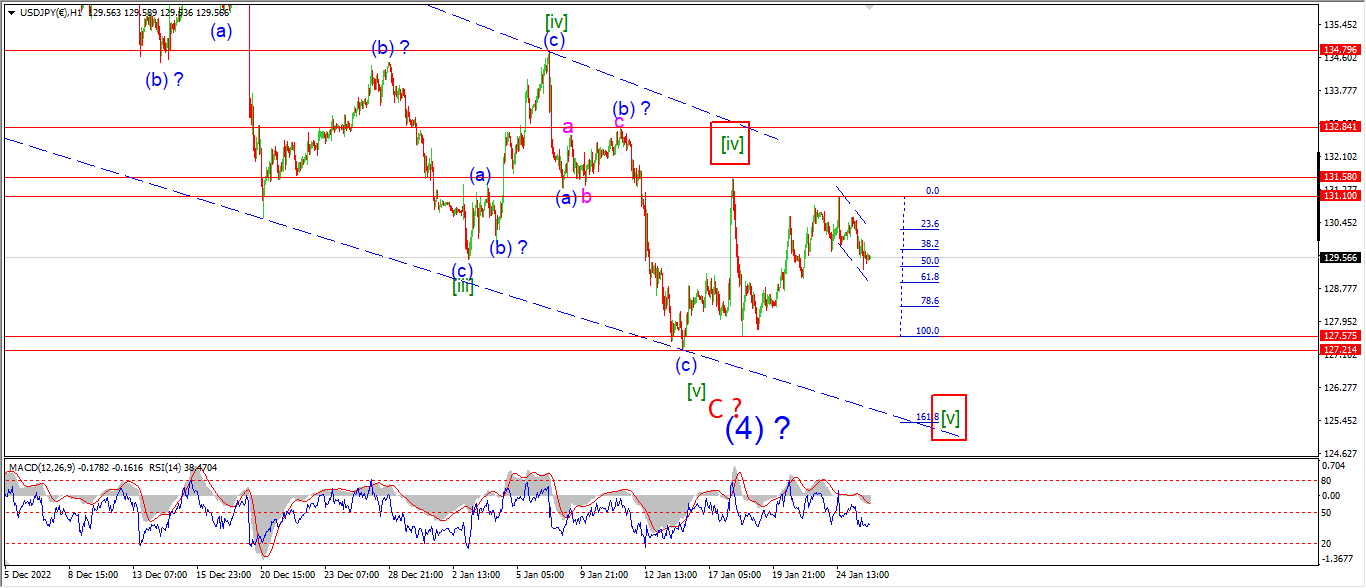
There is a positive to the action today and that is USDJPY.
The price has fallen today,
but so far that decline is a three wave pattern lower off Tuesdays high.
And if that three wave pattern holds,
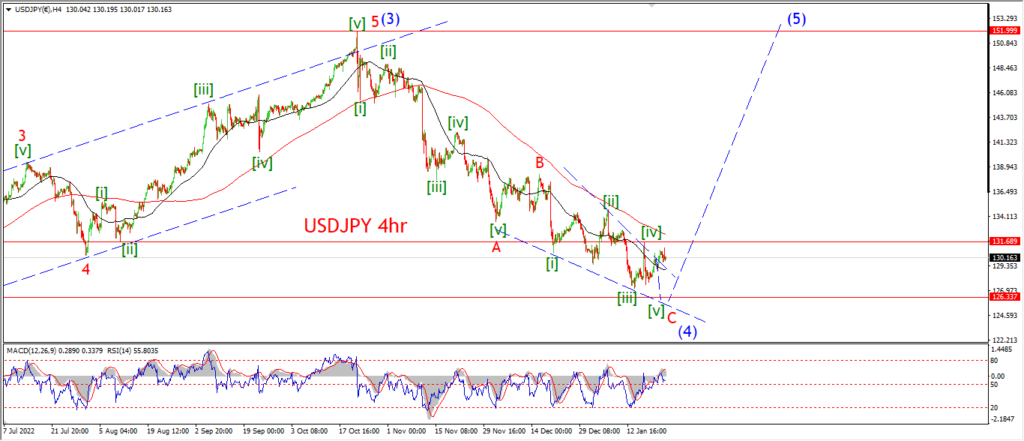
then we have a correction in place off Tuesdays high and we can expect this pair to continue higher towards resistance at 131.58 at the very least.
If the price does manage to break above 132.84 again,
that will suggest we have a failed (c) wave low at 127.57.
and then a new impulse pattern higher off that low.
I know this pattern is less than ideal here,
but I am following the short term patterns to make a judgement on the longer term patterns.
And if the corrections are forming to the downside,
then we are looking at a bottoming process now underway.
Tomorrow;
Watch for that small correction lower to complete a new higher low.
A turn higher tomorrow will favor the bullish idea for wave [i] of ‘1’ of (5) beginning soon.
DOW JONES.
DOW 1hr.
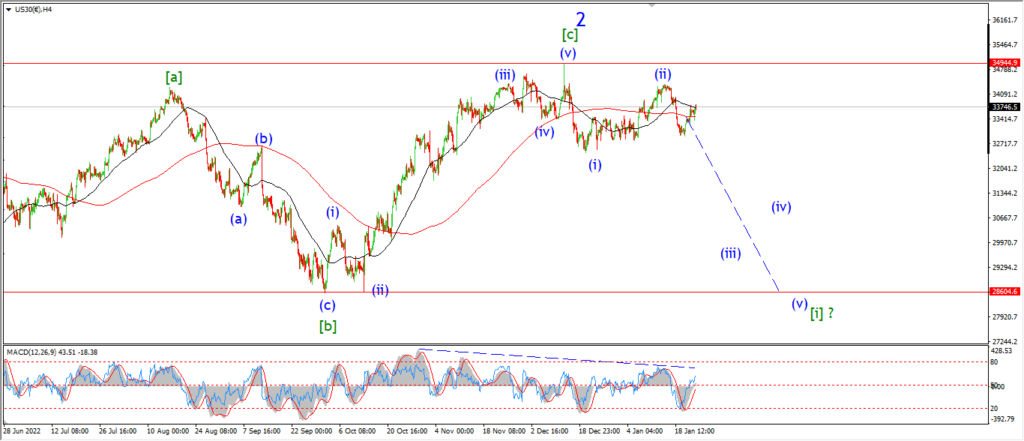
DOW 4hr
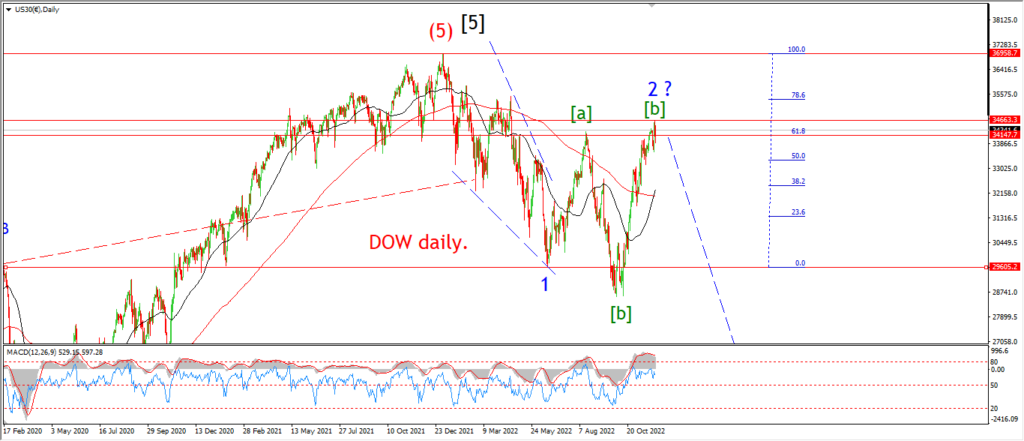
DOW daily.
Another whipsaw week is well underway here.
The market drops sharply and then retraces higher just a quick.
Even though todays action is not ideal in terms of the larger pattern.
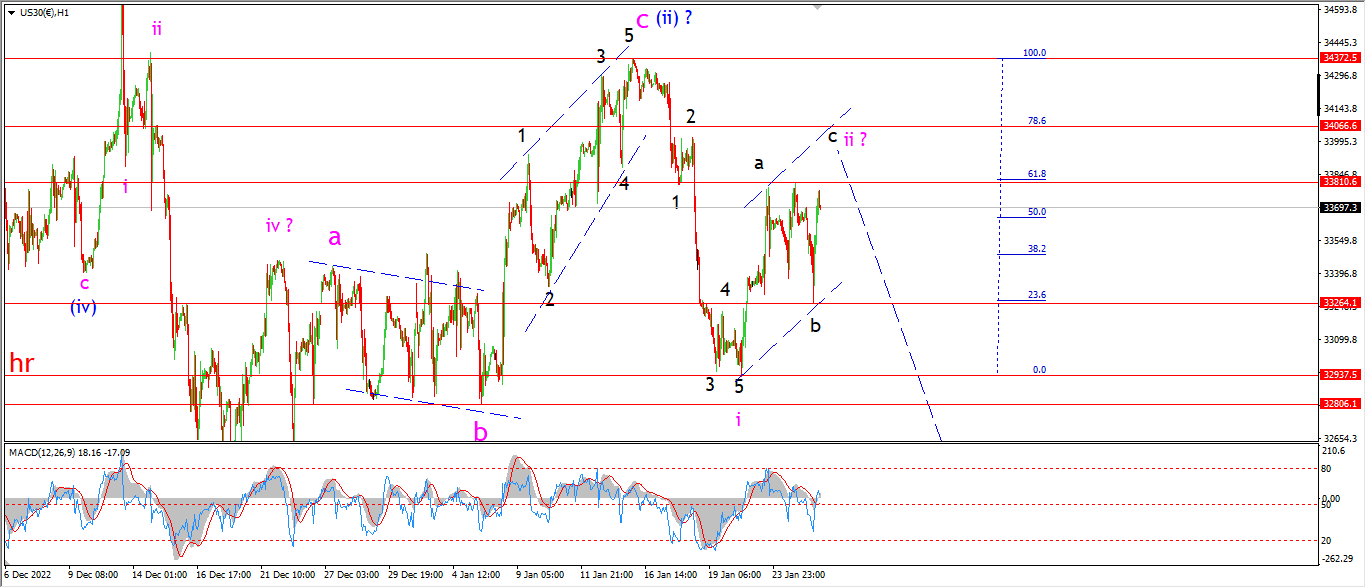
I can still view this as an extended correction in wave ‘ii’ pink.
And just like I wrote about last night,
then end to this correction will come even though it is overdue,
it will come,
once people wake up from this sleepwalking dream they seem to be in here.
Todays decline did actually make a new low for the week,
and the retracement this evening has not broken out above that decline yet.
With that,
there is a small chance that wave ‘ii’ is complete and wave ‘iii’ is now stepping lower off 33810.
However,
tonight I am going to be generous here and view todays low as the end of an expanded flat wave ‘b’.
And the bounce this evening is wave ‘c’ of ‘ii’ still ongoing.
Tomorrow;
The 62% retracement of wave ‘i’ has not been hit yet so that remains the likely target for wave ‘c’ of ‘ii’.
Keep an eye on that wave ‘b’ low at 32260.
The key levels are getting closer to the action now.
A break of that wave ‘b’ low will signal wave ‘iii’ of (iii) is underway.
GOLD
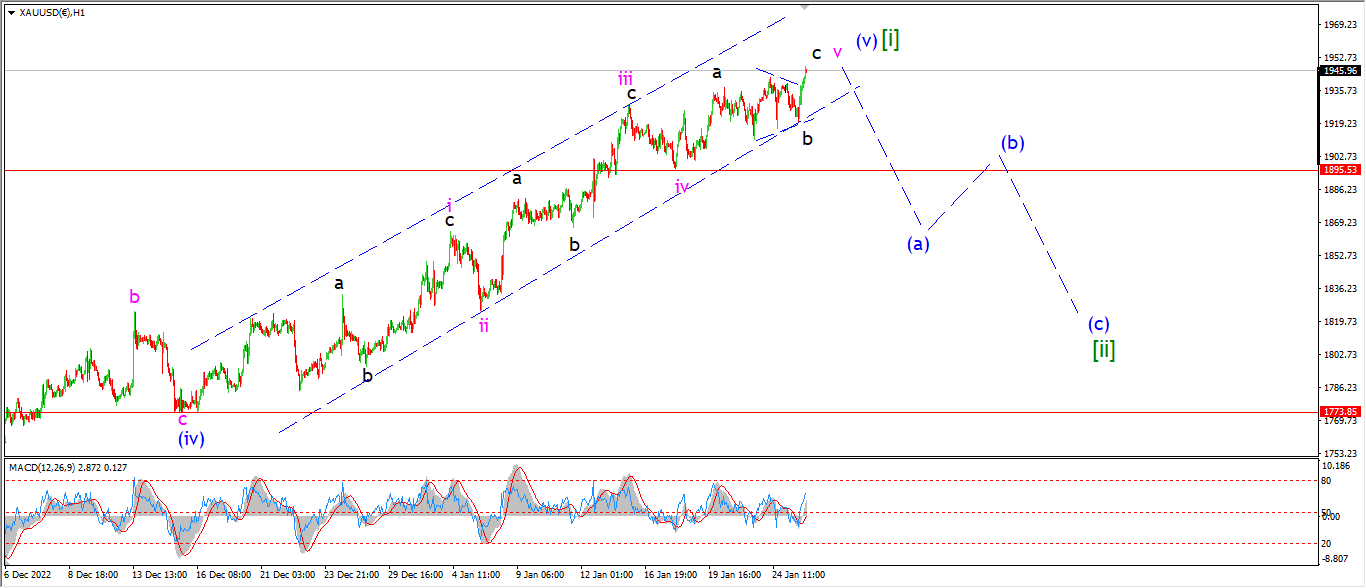
GOLD 1hr.
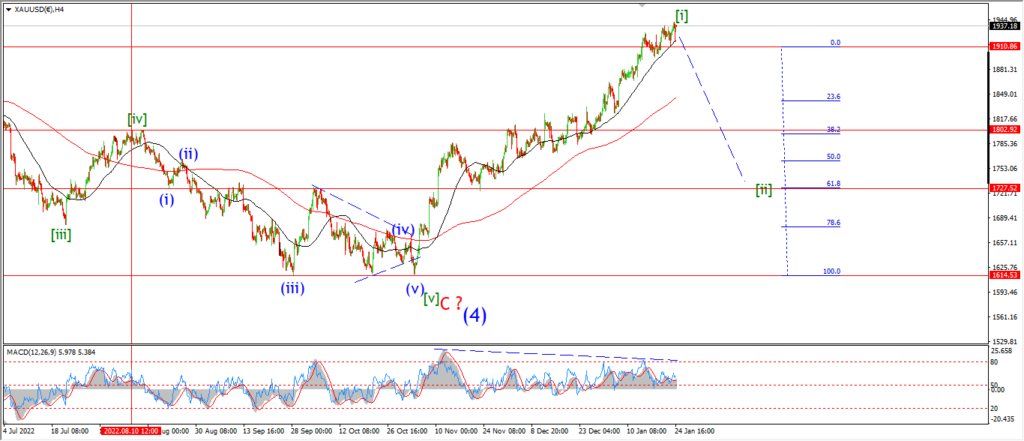
GOLD 4hr.

GOLD daily.
Gold went from the decline that never seems to stop last year,
to the rally that never seems to stop this year!
But that view is simply a manifestation of the normalcy bias in action.
Just because something has been happening for a while,
we tend to believe very easily that the very same thing will continue to go on for ever.
No one like change!
The action over the last few days has compelted a triangle correction wave ‘b’ rather than a flat correction that I showed earlier.
That contracting triangle completed at todays lows,
and now we have a spike to a new high above the range of the triangle.
That is enough to complete this particular pattern,
but I will wait and see if wave ‘v’ does in manage to push higher tomorrow before a top forms.
I am still sticking with the idea that a break of the wave ‘iv’ low will confirm wave (a).
So that 1895 level is important for that reason.
Tomorrow;
Watch for wave ‘c’ to complete this three wave rise in wave ‘v’ by the end of tomorrows session.
CRUDE OIL.
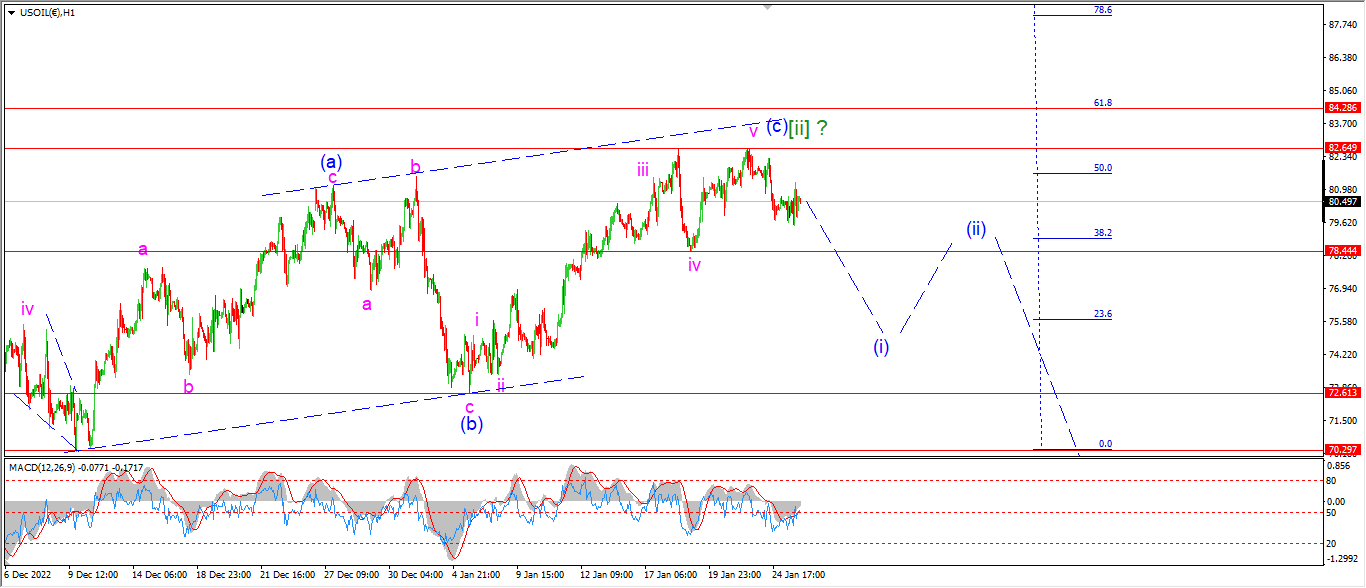
CRUDE OIL 1hr.
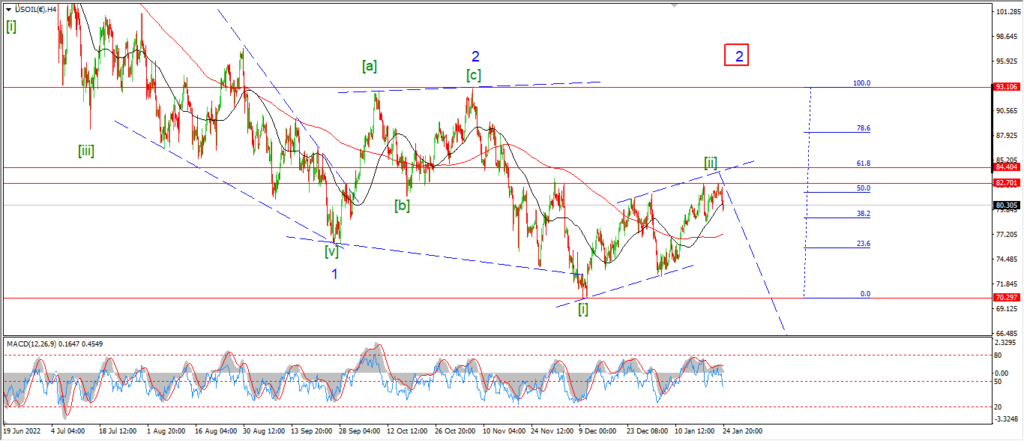
CRUDE OIL 4hr.
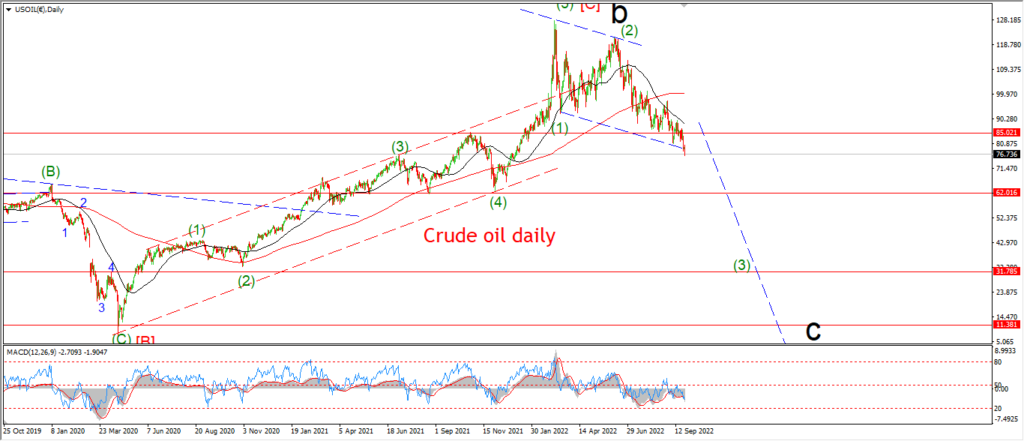
CRUDE OIL daily.
A decline today but no break of support yet to confirm wave (i) is underway.
That wave ‘iv’ low must break in order to concentrate on the possibilities for the downside.
So watch for a break of 78.40 again to signal wave (i) is underway.
In terms of the wave [ii] count,
everything is in place here to call that pattern complete.
Three waves up in a channel,
A nice internal 3,3,5 pattern,
a break of the 50% retracement level to top it off.
All that is neede here is that confirming price action to begin wave (i) down.
Tomorrow;
Watch for a break of initial support to allow us to concentrate on wave (i) down.
S&P 500.
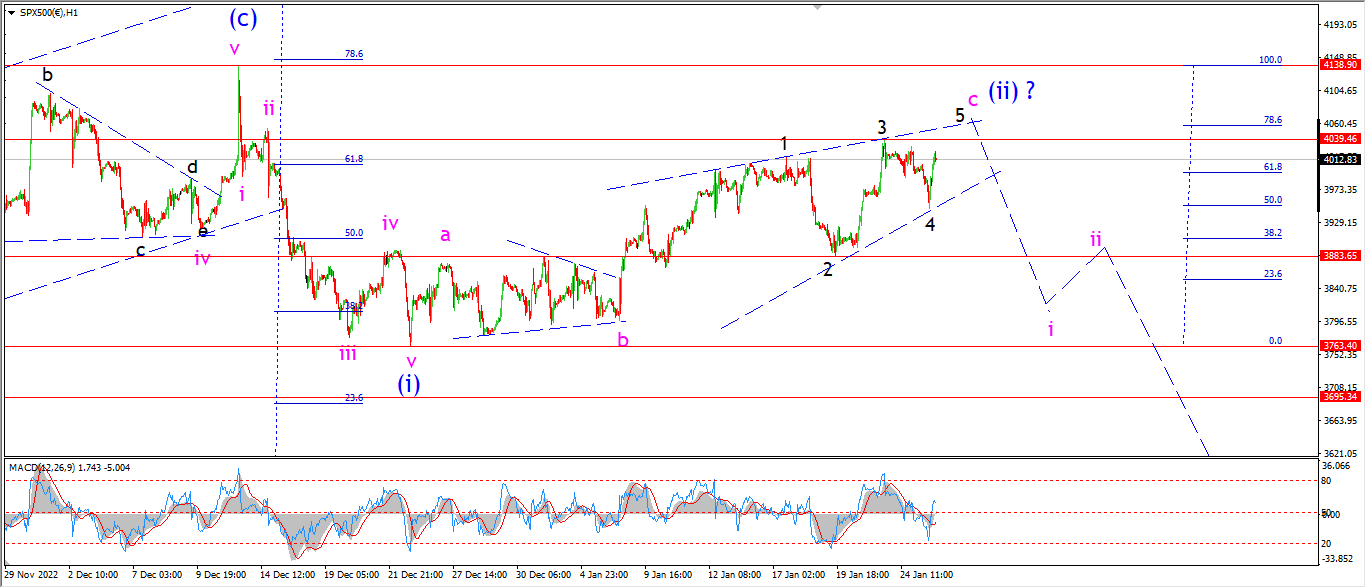
S&P 500 1hr
S&P 500 4hr
S&P 500 daily.
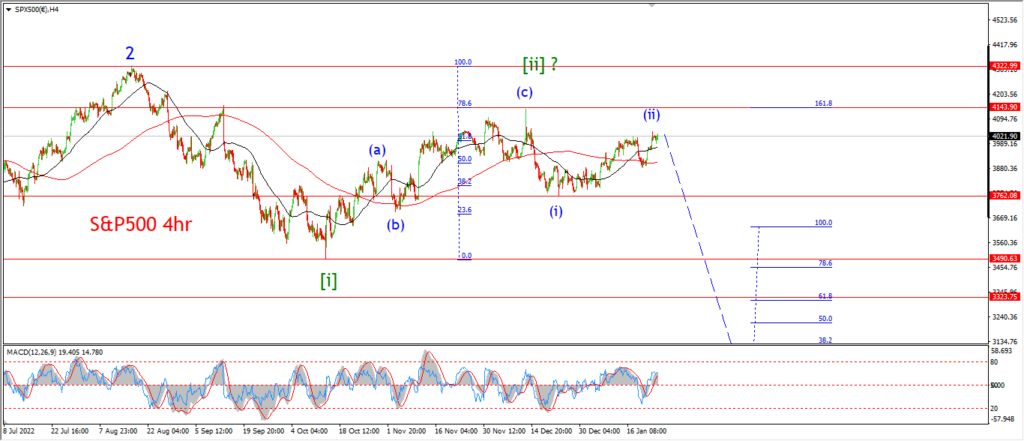
I will freely admit that the pattern over the last week is confusing to say the least.
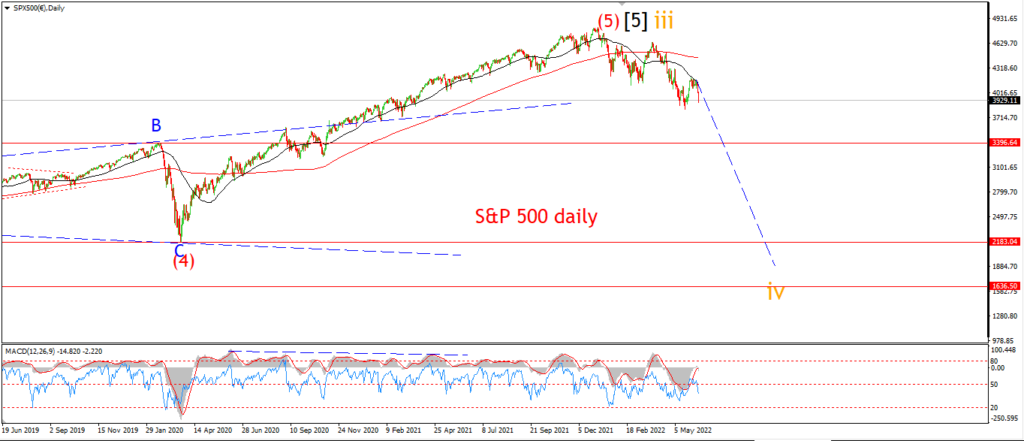
The overall pattern for wave (i) and (ii) is still intact.
however the internal structure of this wave ‘c’ is less than ideal to be honest.
Tomight I am looking at the possibility that we have an ending diagonal patttern underway in wave ‘c’.
It is not a beautiful pattern by any means!
but it does have some merit in the fact that we can discern a narrowing of the action into this top.
And there is a wedge shape to the action.
We can argue over the internal labelling of this wave ‘c’ variation.
But,
I am willing to give this idea a chance to prove itself tomorrow as today rally should be the final move to complete this pattern.
A small new high above 4040 tomorrow,
will complete three internal waves in wave ‘5’ of ‘v’ as shown.
An that again opens the trapdoor under this pattern.
Tomorrow;
Watch for wave ‘c’ to top out again to complete wave (ii).
A break of the recent low at 3880 will tip the balance in favor of wave ‘i’ down again.
SILVER.
SILVER 1hr
SILVER 4hr.
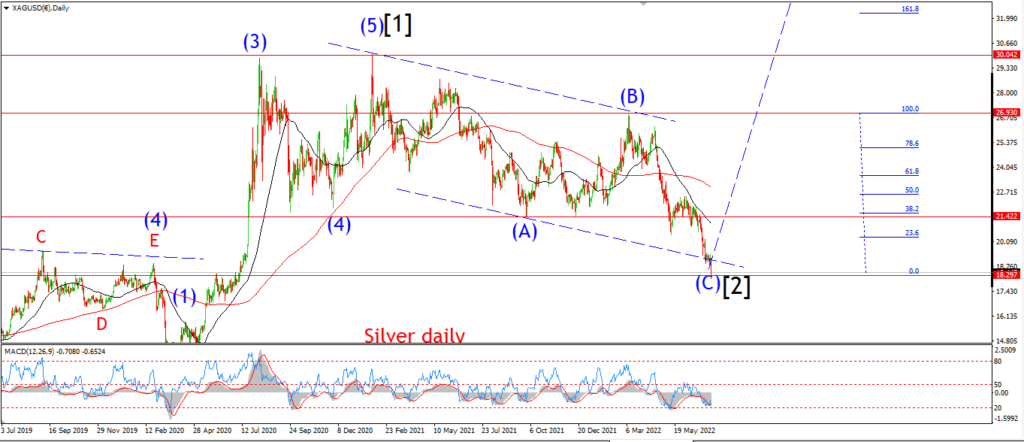
SILVER daily.
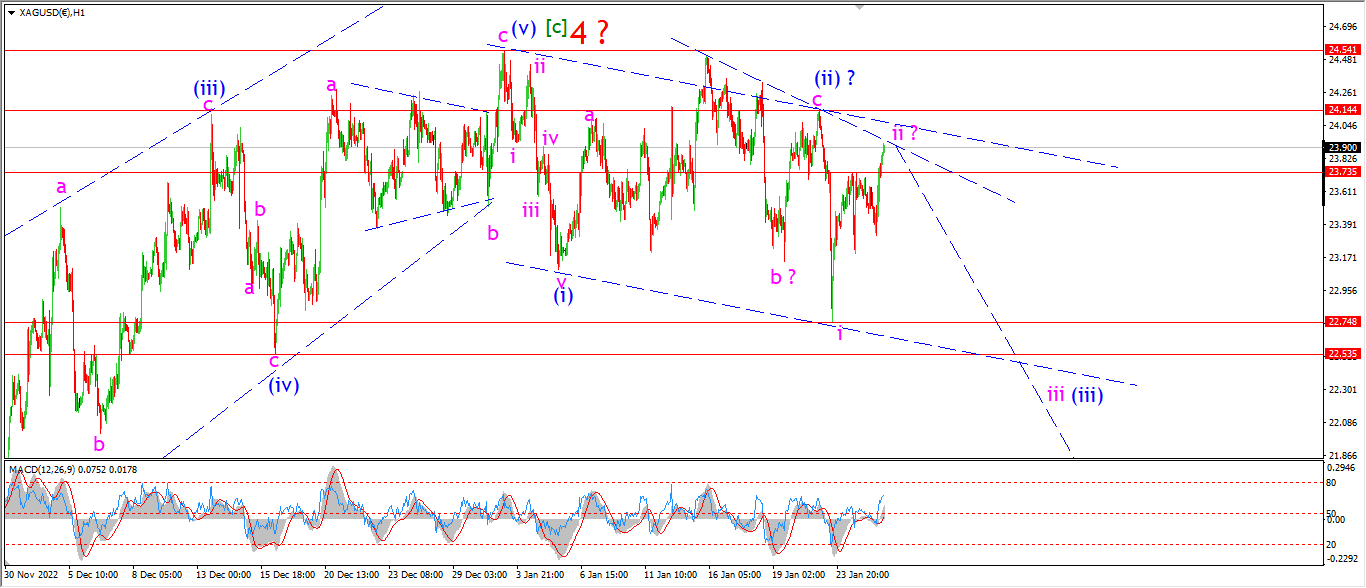
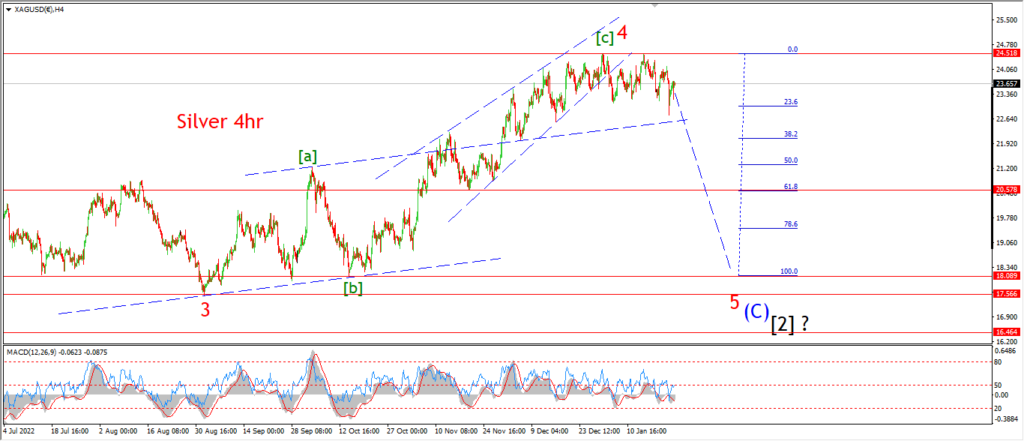
This week we have another five waves down in wave ‘i’,
and now a three wave rally to another lower high in wave ‘ii’ as shown tonight.
The price is reaching a trendline resistance connecting all of the previous lower highs now.
And above that we have a channel resistance formed by the orthodox highs at wave ‘4’ and (ii).
At this point I am in favor of the main wave count reversing in a major way over the next few days.
If that does not happen,
then I will have to rethink my whole take on the patterns in operation here in silver.
Tomorrow;
Watch for wave ‘ii’ to stop and reverse at these trend line resistance levels.
22.75 is the key level to begin the next decline phase.
BITCOIN
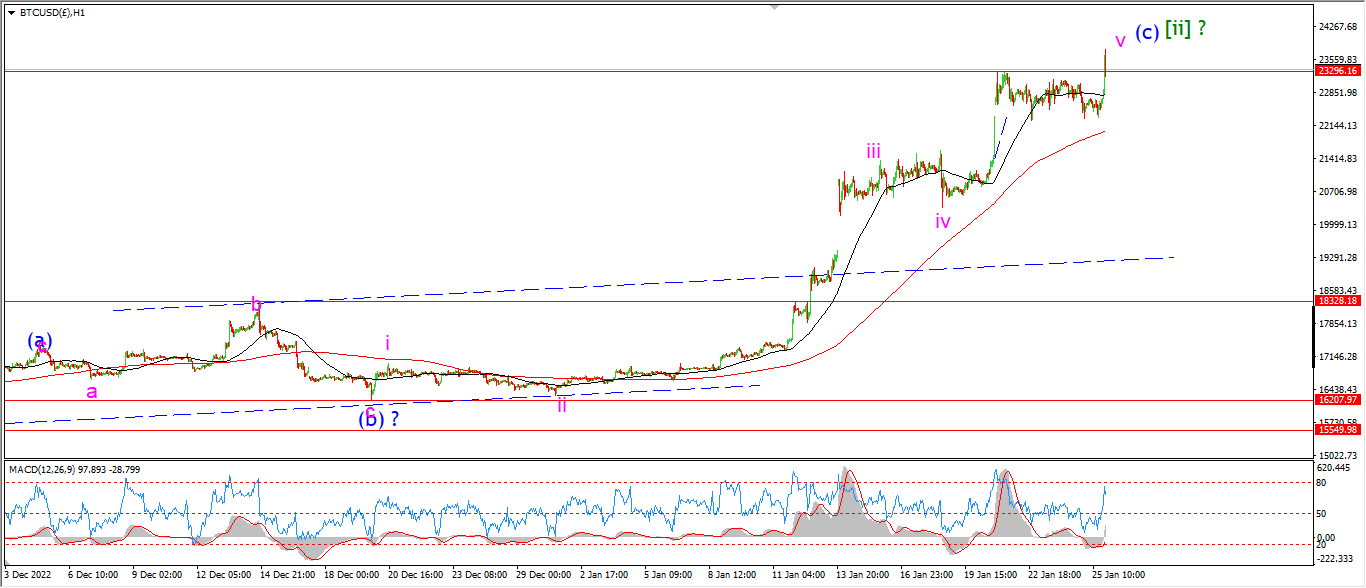
BITCOIN 1hr.
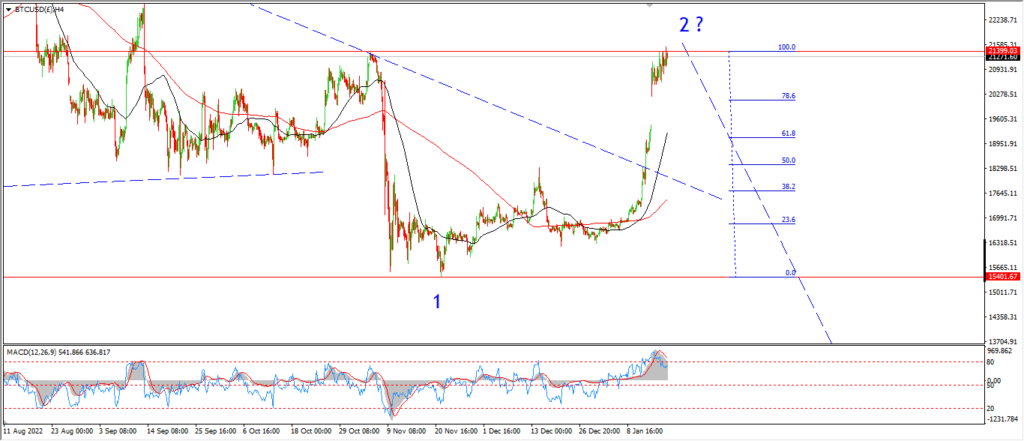
BITCOIN 4hr.

BITCOIN daily.
….
FTSE 100.
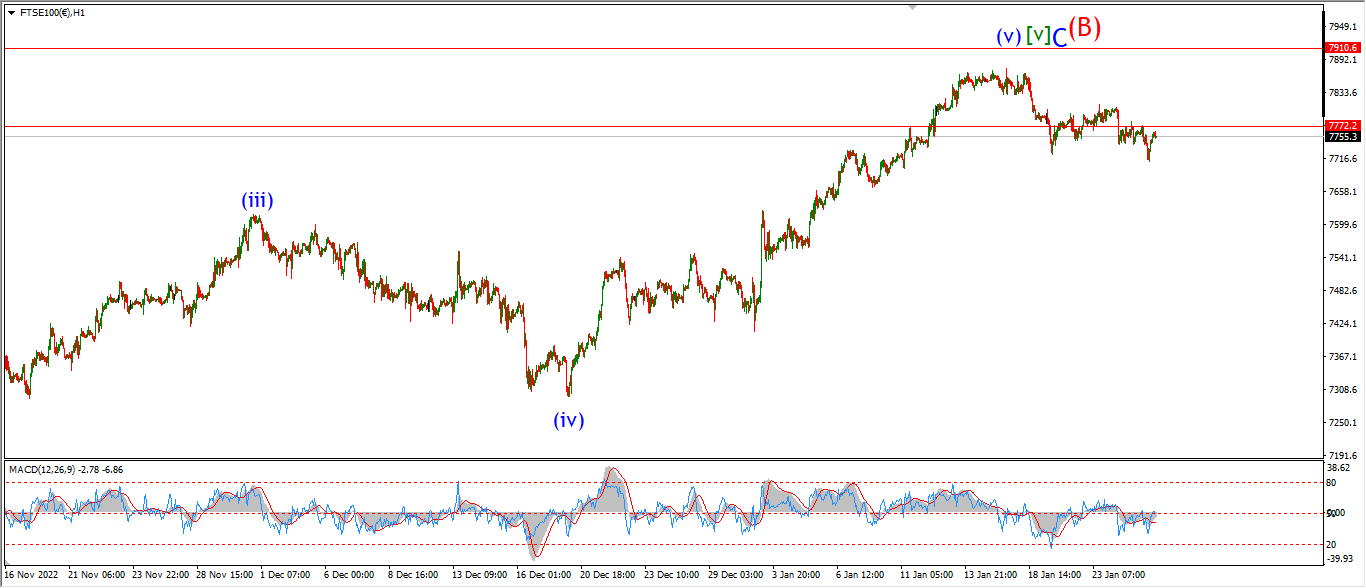
FTSE 100 1hr.
FTSE 100 4hr.

FTSE 100 daily.
….
DAX.
DAX 1hr
DAX 4hr

DAX daily.
….
NASDAQ 100.
NASDAQ 1hr
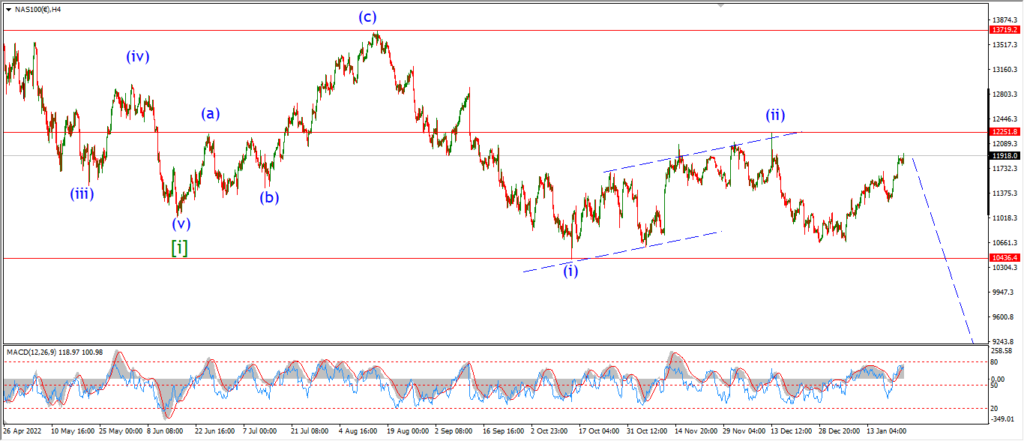
NASDAQ 4hr.

NASDAQ daily.
….