
Hi folks.
Here is an article that really caught my eye earlier this week and it is worth a read for sure – https://www.wsj.com/articles/money-losing-companies-mushroom-even-as-stocks-hit-new-highs-11578608209
Boy oh boy, the similarities with the dotcom bubble keep piling up these days!
on with the show.
EURUSD.
EURUSD 1hr.

EURUSD 4hr.
EURUSD daily.
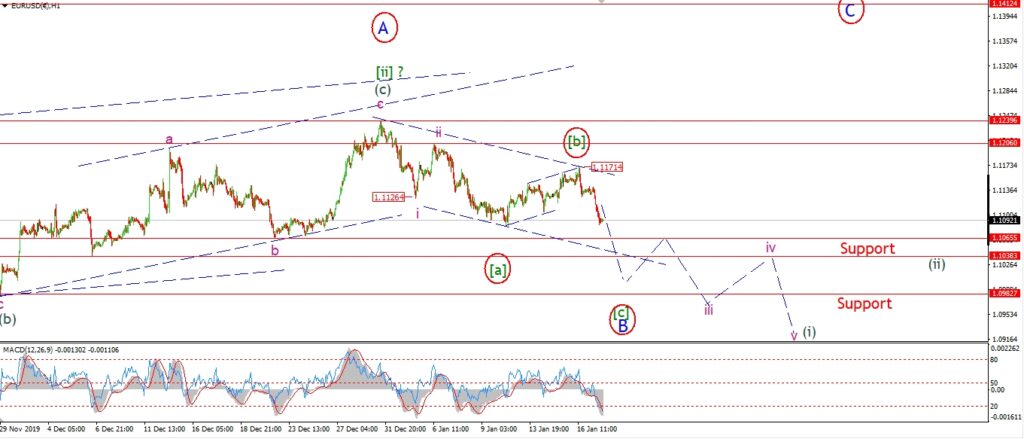
EURUSD is lower today off the corrective high registered yesterday at 1.1172.
This action can still be viewed as either wave ‘iii’ underway,
or wave [b] now complete.
Both wave counts call for a decline to continue into next week,
so for the moment I will leave the wave counts in tact as they are.
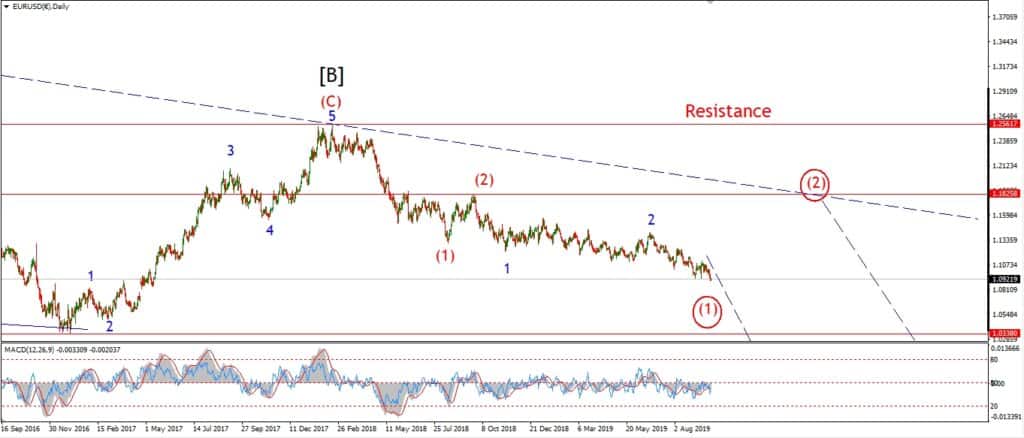
If the alternate count is correct,
we should know by the middle of next week if a rally begins in wave ‘C’ blue as shown.
Monday;
price should continue to fall in towards support at 1.0980.
If support holds, and price rebounds again that action will favor the alternate count.
GBPUSD
GBPUSD 1hr.
GBPUSD 4hr.
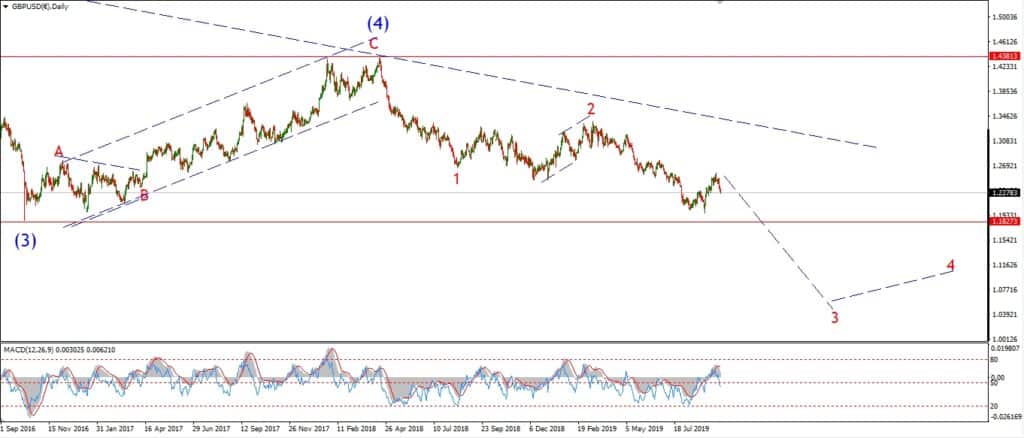
GBPUSD daily.
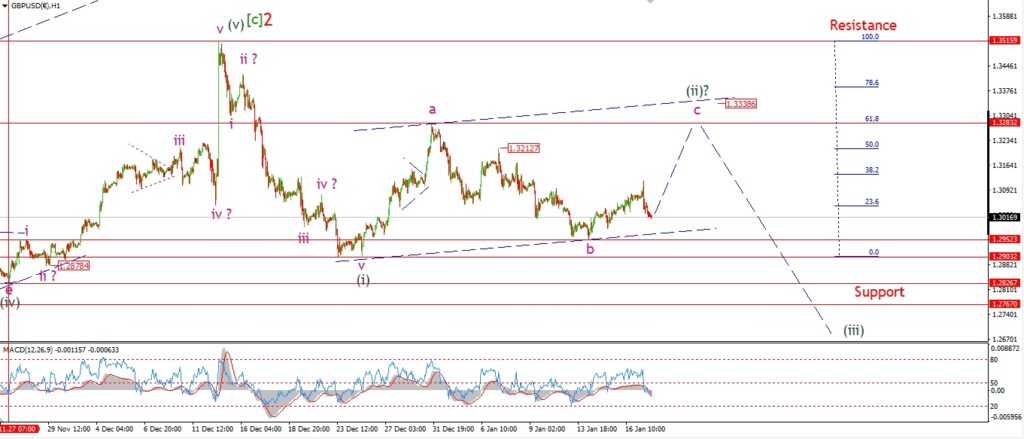
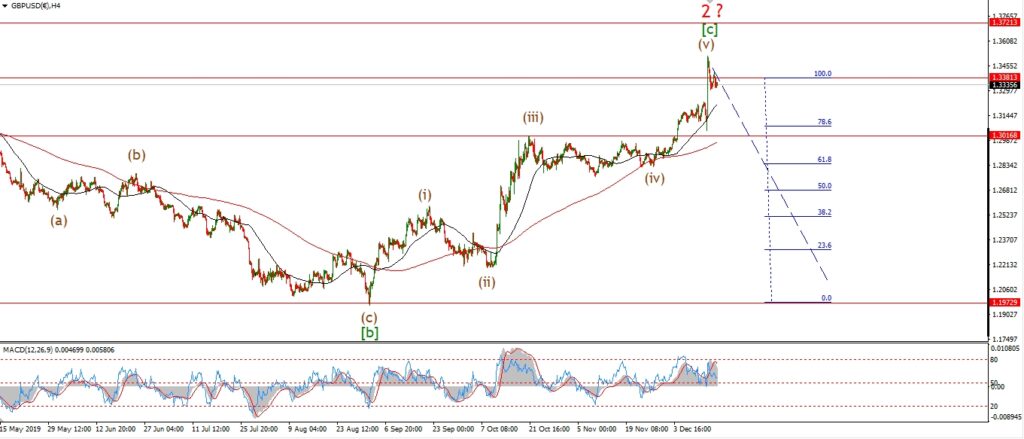
Cable fell today but I still favor the idea that wave ‘c’ is now underway to the upside.
Todays setback should prove to be only a small correction in wave ‘c’.
The rise off the wave ‘b’ high is in three waves so far,
so this rally must continue on Monday and develop into a larger five wave structure to complete wave ‘c’.
Monday;
The price must hold above 1.2952.
A break of that level will invalidate this short term count.
USDJPY.
USDJPY 1hr.
USDJPY 1hr.
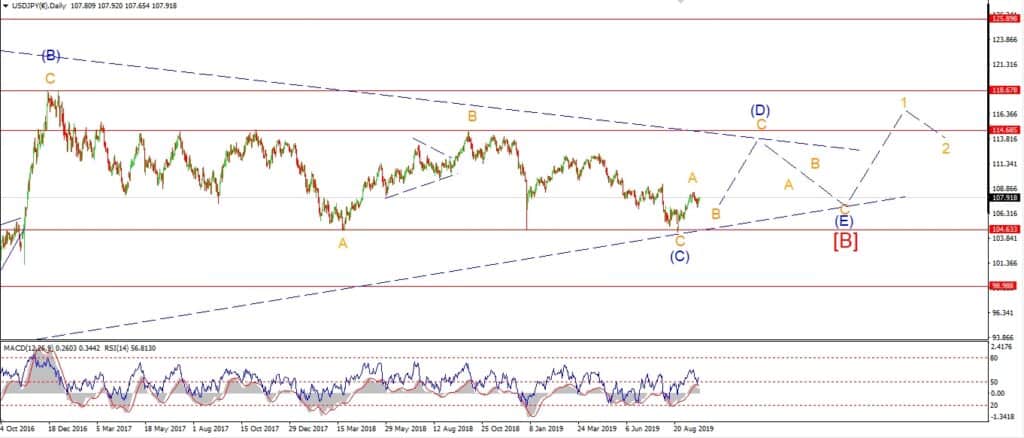
USDJPY daily.
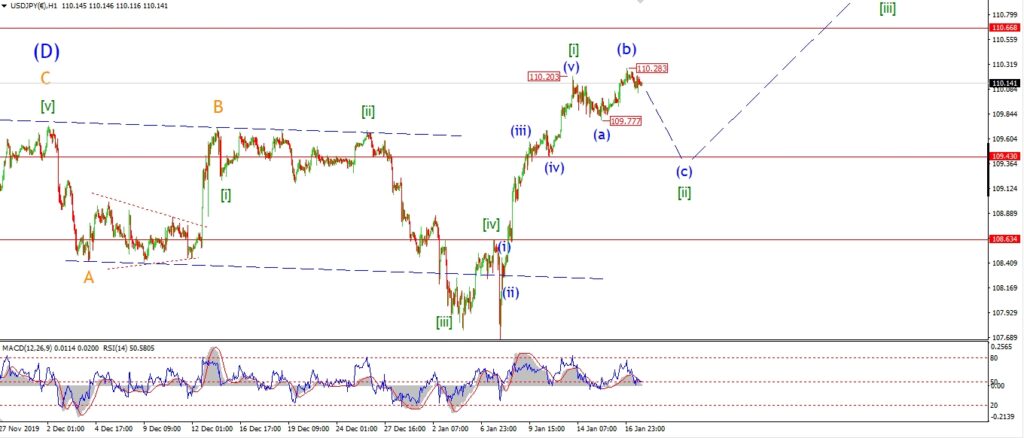
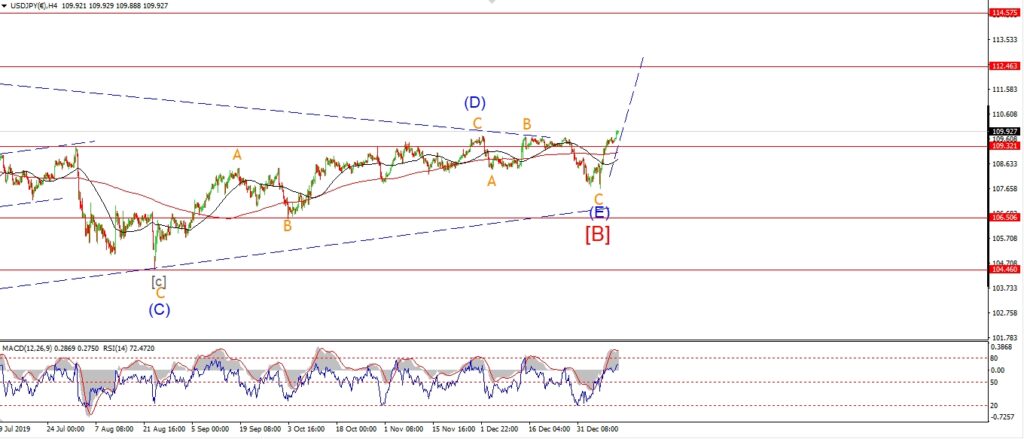
USDJPY did break above the recent wave [i] high today,
but I favor the idea that this is a corrective new high in wave (b) as shown.
That corrective high would suggest wave [ii] is an expanded flat correction,
and wave (c) of [ii] will take us lower early next week.
The new target for wave [ii] is not as low as previously shown now.
And wave (c) of [ii] should find support at the previous fourth wave at 109.43.
Monday;
Watch for wave (c) to head lower and break 109.77 at a minimum.
DOW JONES.
DOW 1hr.
DOW 4hr
DOW daily.
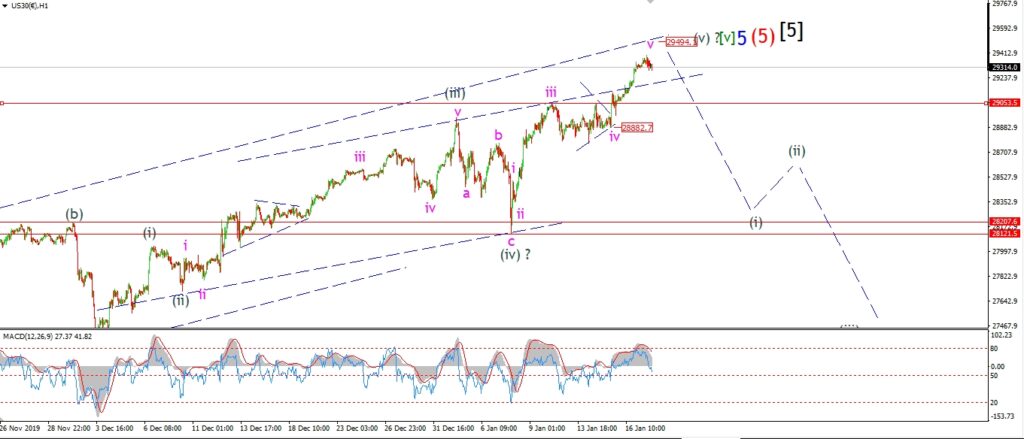
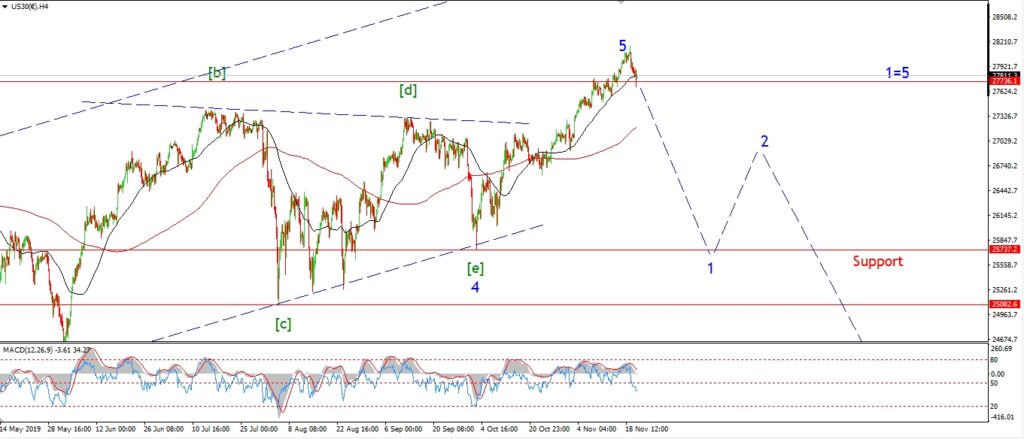
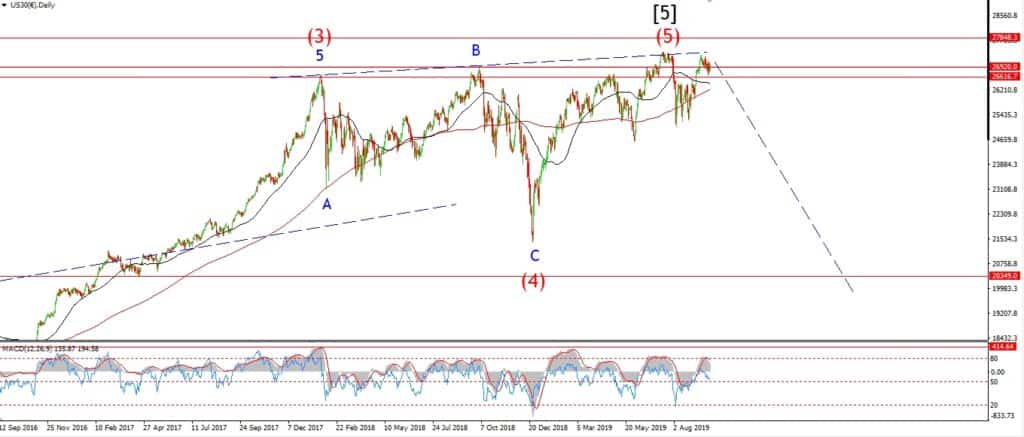
The melt up in wave ‘5’ blue is well and truly over done now
as today the price again rallied against all reason and rhyme.
Liquidity is the buzz word at the moment,
people seem to think that stocks can only rally when the FED is monetizing debt.
Lest we forget that the FED was easing at an unprecedented rate back in 2008 – 2009 also,
but the market fell through all that printing!
This melt up will become a melt down before long and there is nothing the FED can do about it.
Back to reality.
The price is fast approaching the upper trend channel line of the larger trend channel for wave ‘5’ blue.
Price will hit that channel at about 29500.
This becomes the next resistance to the rally in wave (v).
Monday;
If wave (v) is now in force,
then the rally can not last for much longer.
I will be watching the action around that upper trend channel line at 29500.
Lets see if next week brings the fabled decline back into sanity!
GOLD
GOLD 1hr.
GOLD 4hr.
GOLD daily.
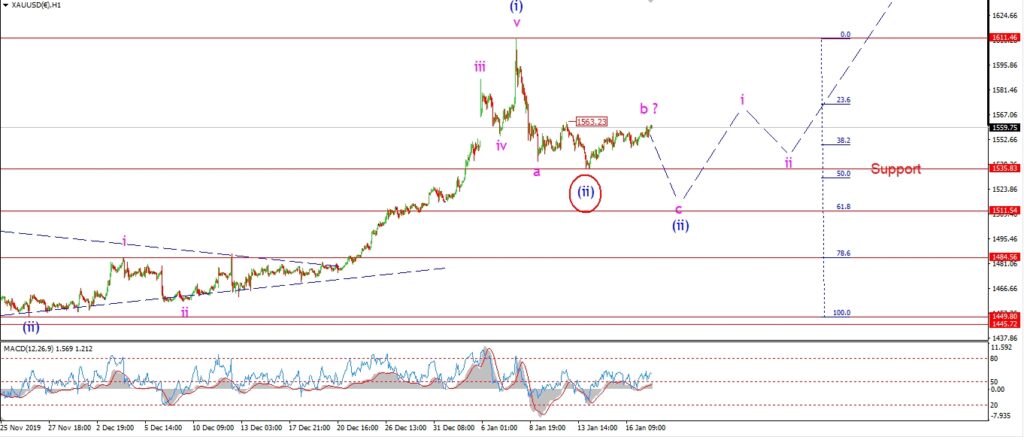
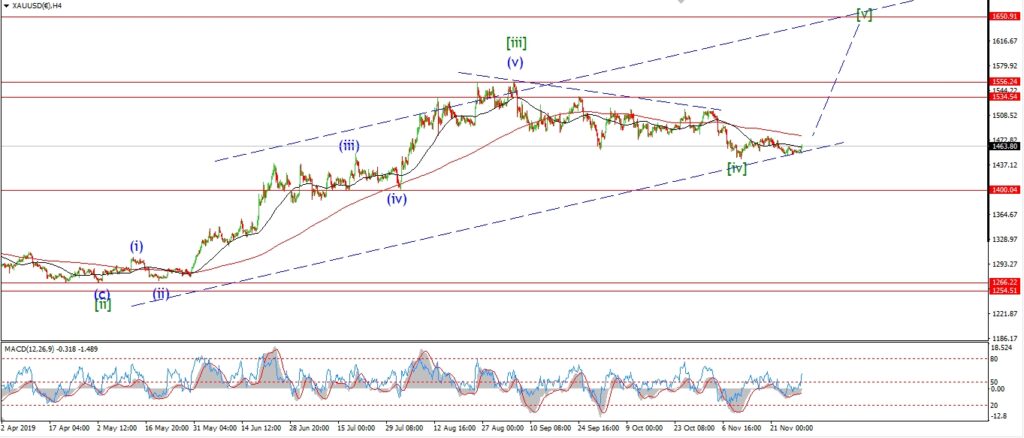
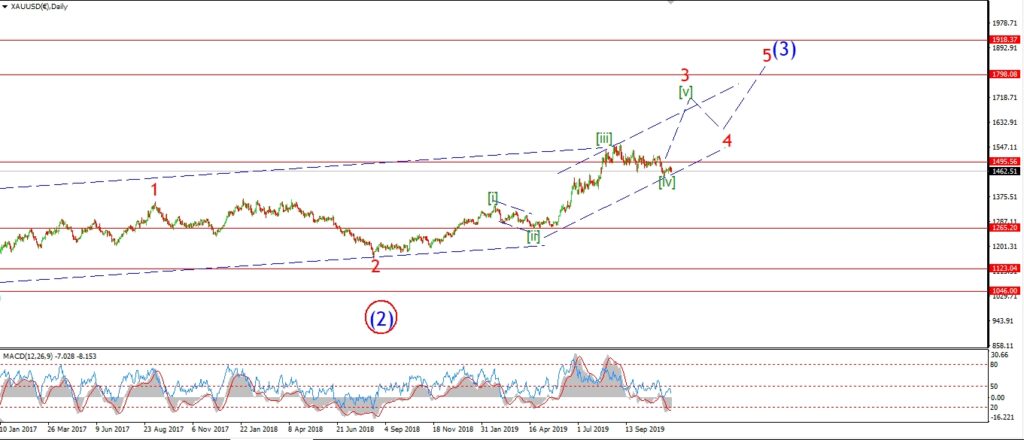
Gold is holding onto the gains off this weeks lows.
I am still looking at this rise in the light of a running flat correction.
And wave ‘c’ should fall again next week to complete the larger correction in wave (ii).
As for the alternate count,
I cant rule out that count either!
Which calls the recent low at 1535 the final low for wave (ii).
If that count is correct,
then we should continue higher from here in wave (iii).
But we will have to wait and see on that front.
Both counts are bullish in the longer term,
but the alternate count points to a more immediate rally at hand.
Monday;
watch for a break of 1535 again to rule out the alternate count and bring on wave the end of wave (ii).
CRUDE OIL.
CRUDE OIL 1hr.
CRUDE OIL 4hr.
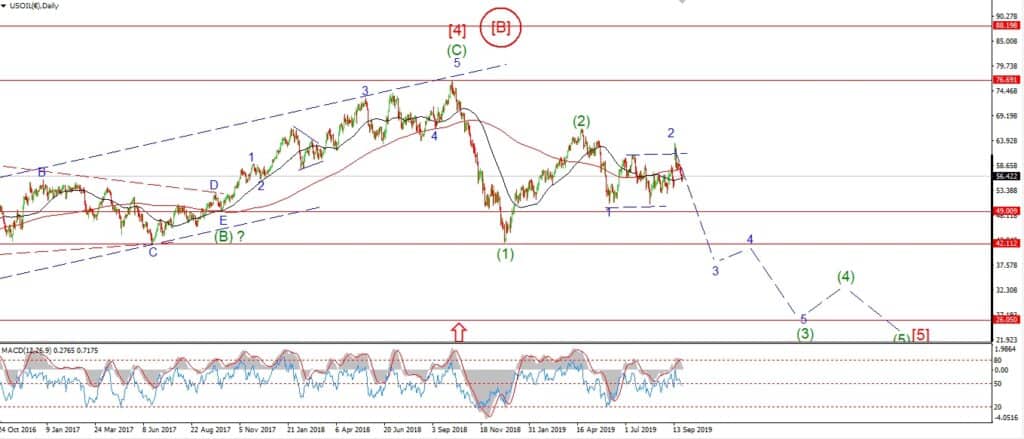
CRUDE OIL daily.
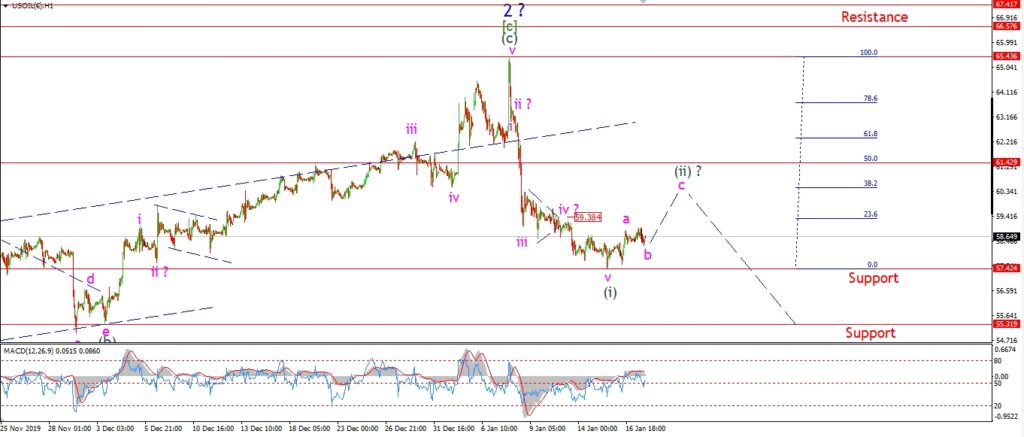
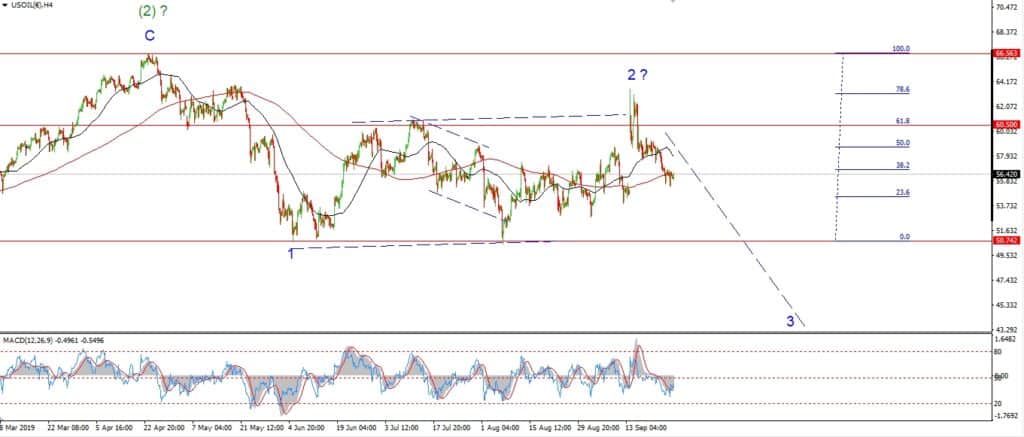
Crude oil is slowly forming a corrective rally in wave (ii).
The action off the recent lows at 57.42 is viewed as waves ‘a’ and ‘b’ of (ii)
which should be near to completion now.
Wave ‘b’ should complete above that low at 57.42,
and wave ‘c’ of (ii) should rally from there up to about 60.50 to complete a three wave correction.
At that point wave (ii) will complete another bearish signal in crude and wave (iii) will be ready to carry us much lower.
Monday;
Wave (ii) should remain in force for the next few sessions as wave ‘c’ plays out.
Lets see if wave (ii) completes below the 50% retracement.
S&P 500.
S&P 500 1hr
S&P 500 4hr
S&P 500 daily.
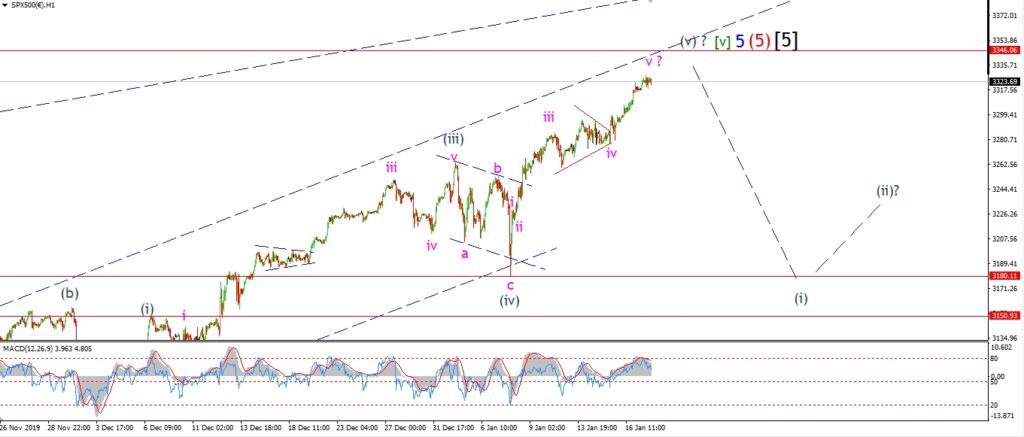
Well todays rally has ruled out the idea of an ending diagonal for wave (v).
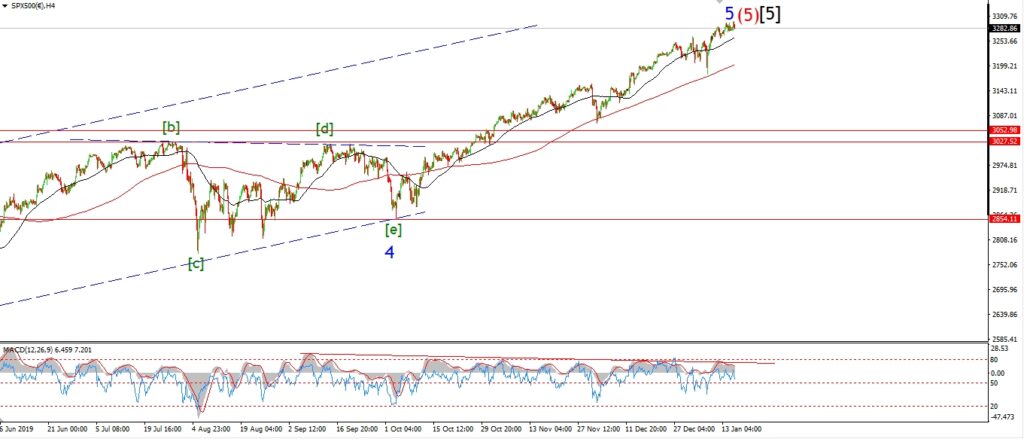
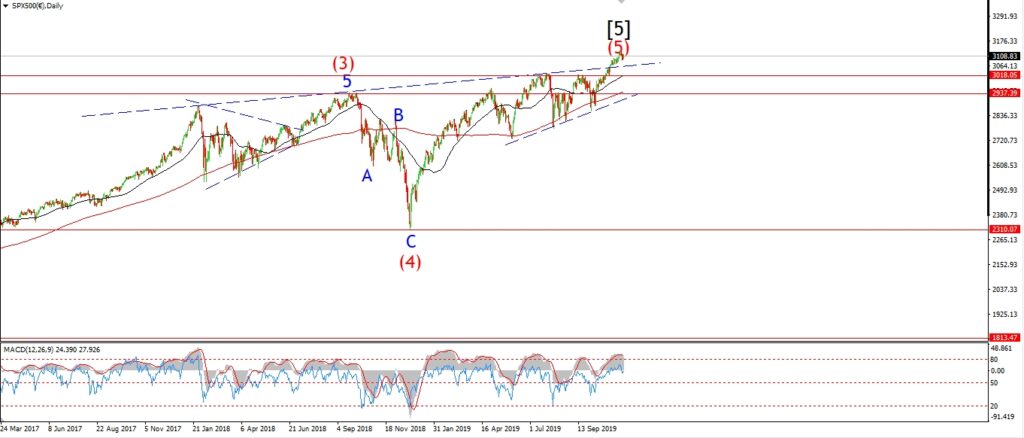
The price is now approaching the larger trend channel line which surrounds wave ‘5’ blue.
It looks like that line will be hit at about 3346.
So that level will be the next point of interest to look for a reversal off the trend line to begin wave (i) down.
Monday;
Watch for wave (v) to top out early next week with a possible touch of the upper channel line.
We will know soon enough if this level will be enough to turn the tide on this rally.
SILVER.
SILVER 1hr
SILVER 4hr.
SILVER daily.
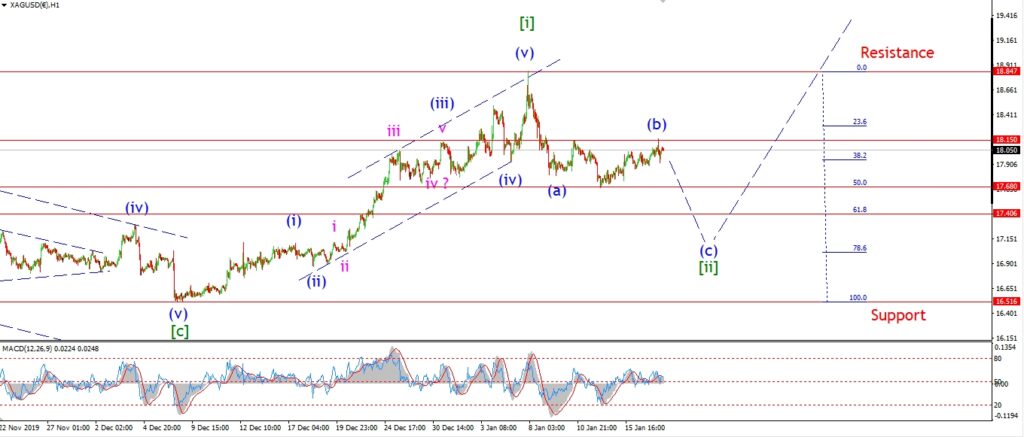
Silver created a slight break of that 18.15 level today,
this slight new high now classifies wave (b) as an expanded flat
rather than a running flat correction as suggested before.
The price dropped after hitting that 18.15 level,
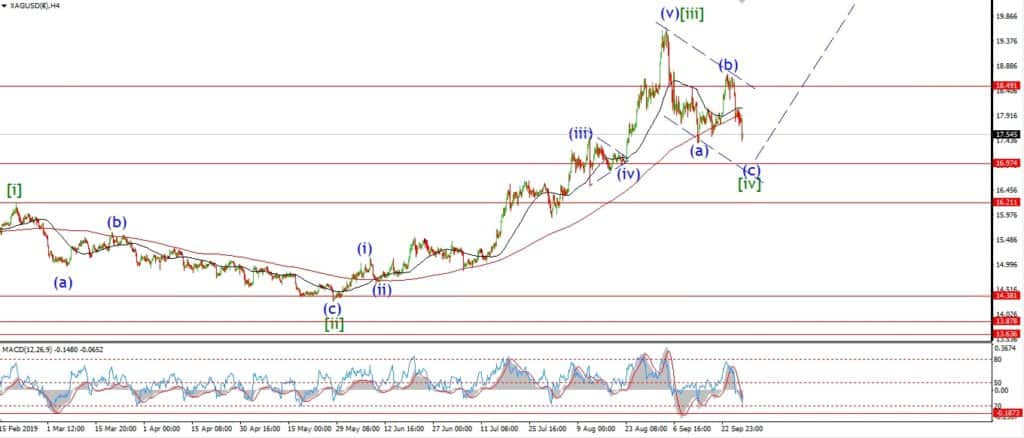
so wave (c) down is now expected the turn lower again over the coming days to finish this corrective decline.
Monday;
Next week is looking like a down week for Silver,
a break of 17.68 will signal wave (c) has begun.
Watch for wave (c) to complete towards the end of the week.
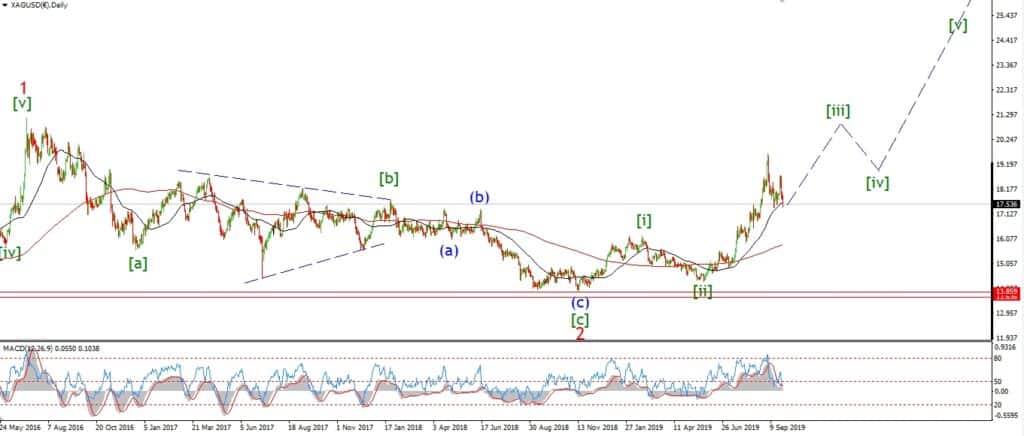
We may get the beginning of the rally in wave [iii] by Friday.
U.S 10YR.
US 10YR 1hr.
US 10YR 4hr.
US 10YR daily.
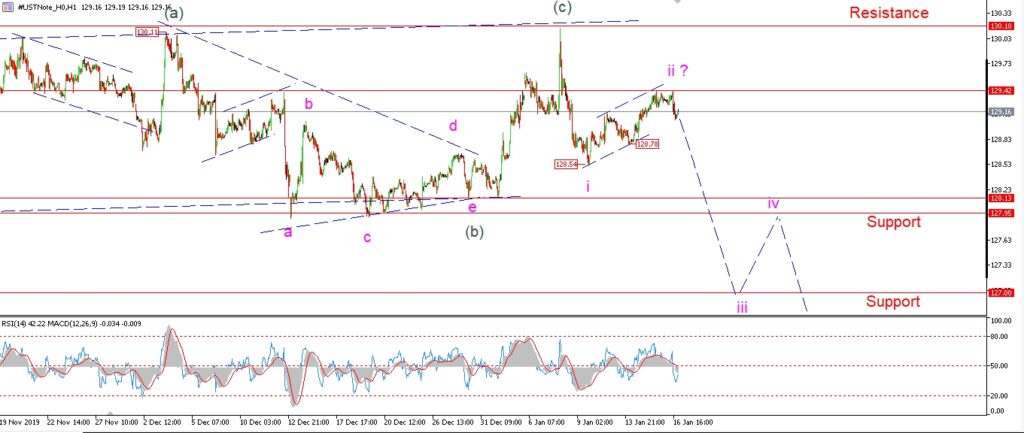
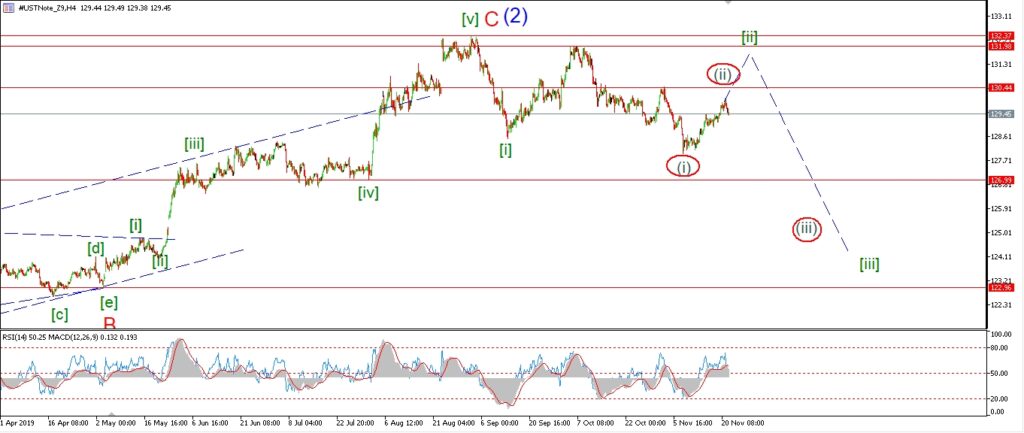
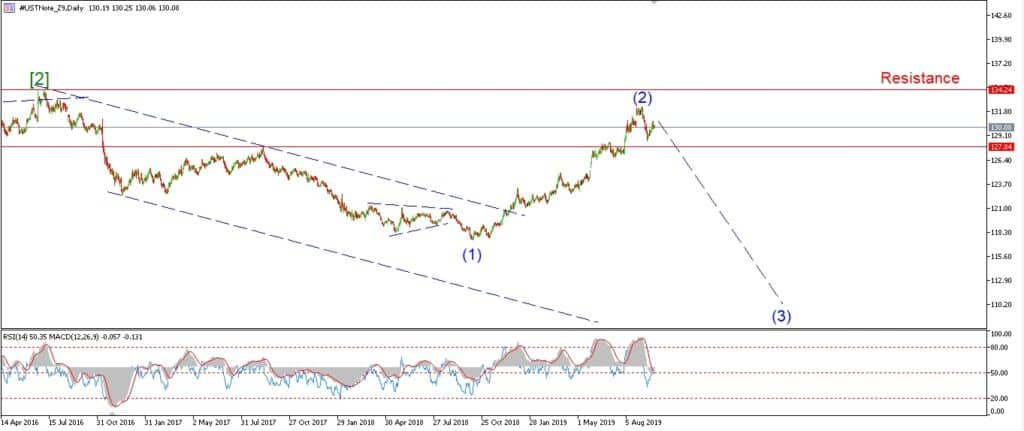
Bonds have not accelerated lower into wave ‘iii’ yet,
but the price is holding below that corrective high at wave ‘ii’ nicely so far.
Wave ‘iii’ should hold below the high at 129.42 next week,
and if we see a drop below 128.54 again that will signal wave ‘iii’ has finally begun.
Wave ‘iii’ should push down towards 127.00 again with ease.
Monday;
129.42 must hold.
Wave ‘iii’ of (i) should continue lower for most of the week and break support.