
Good evening to you all, and may the Lord bless you all tonight.
EURUSD.
EURUSD 1hr.
EURUSD 4hr.
EURUSD daily.
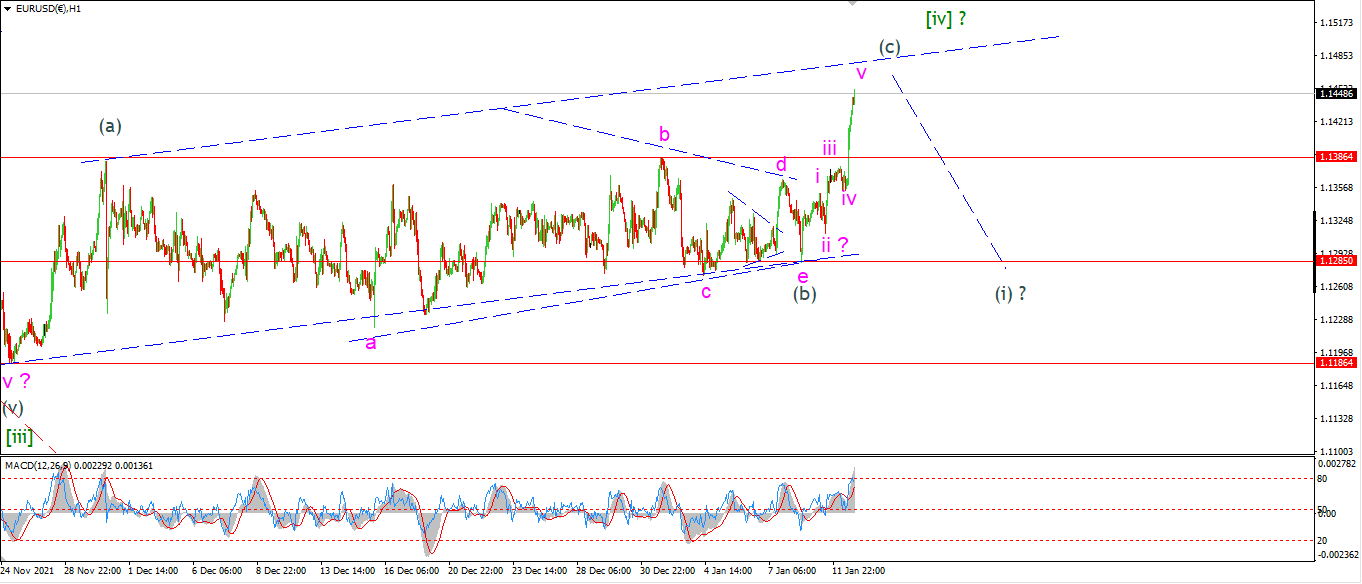
we finally got a clear picture of what is happening in EURUSD today.
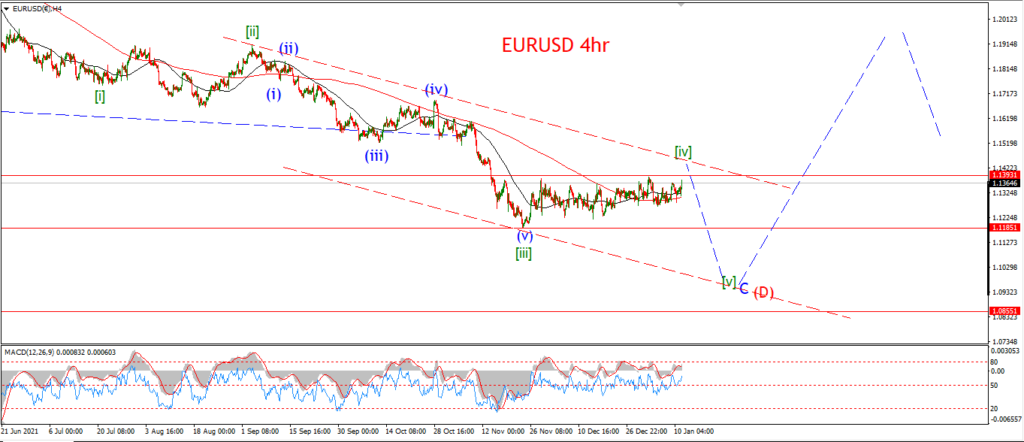
The pattern suggested yesterday for wave [iv] is now in full swing.
the rally has continued and broken above the highs of the triangle wave (b),
and this now confirms wave (c) is underway.
There is a few ways to view the internal pattern of wave (c),
but the upper trend channel suggests a target at the 1.1500 area to complete the correction.
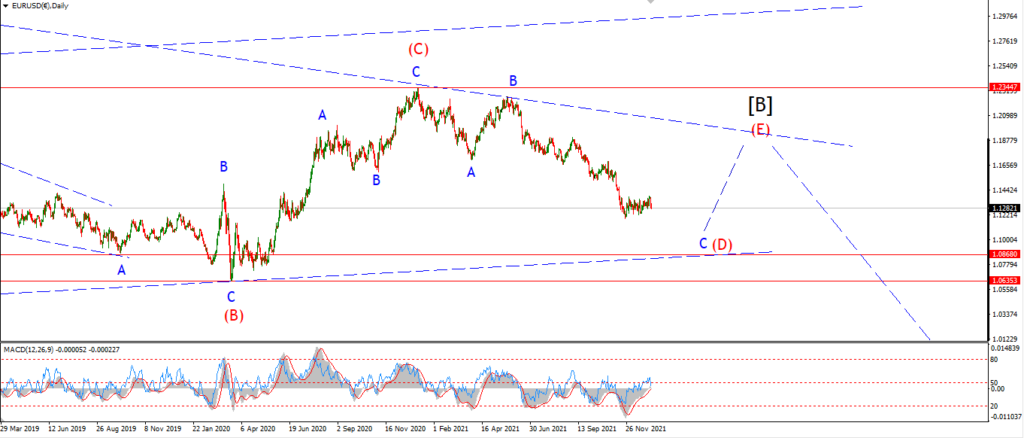
And then we can look lower again for wave [v] to begin next week.
Tomorrow;
Watch for wave (c) to complete five waves up and hit that upper trend line again to complete three waves up.
GBPUSD
GBPUSD 1hr.
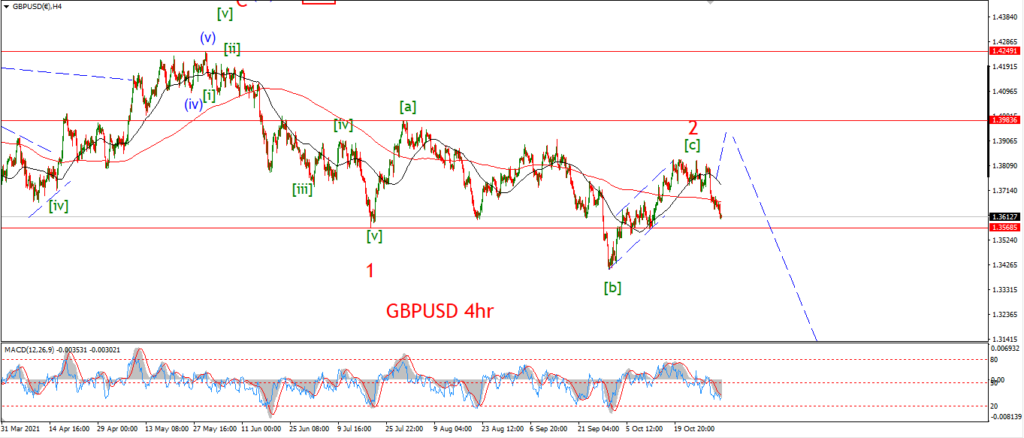
GBPUSD 4hr.
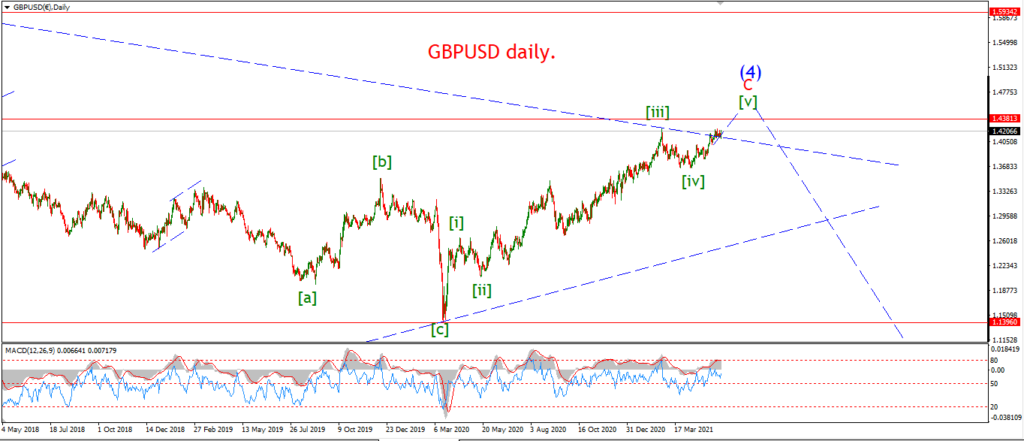
GBPUSD daily.
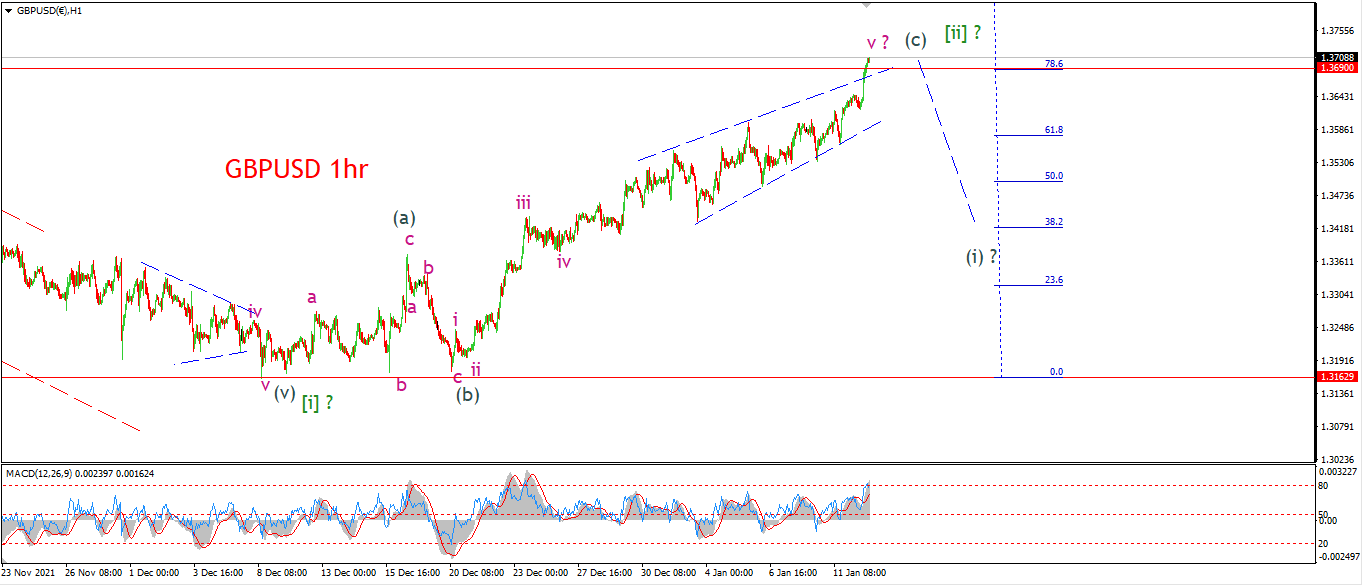
Well this rally in cable is getting very extended as each day goes on.
I keep showing a variation on an ending diagonal for wave ‘v’ of (c).
And tonight is no different.
The rally in wave [ii] has now reached the 78.6% retracement level,
and we have a throw-over above the upper trend line this evening.
Obviously we are getting quite close to that invalidation level at the beginning of wave [i],
but I still see the most likely outcome here as a reversal pattern to begin soon,
and this will signal the beginning of wave [iii] down.
Tomorrow;
Watch for wave (c) to reverse tomorrow and fall back below the rising wedge pattern.
That will signal wave (i) has begun.
USDJPY.
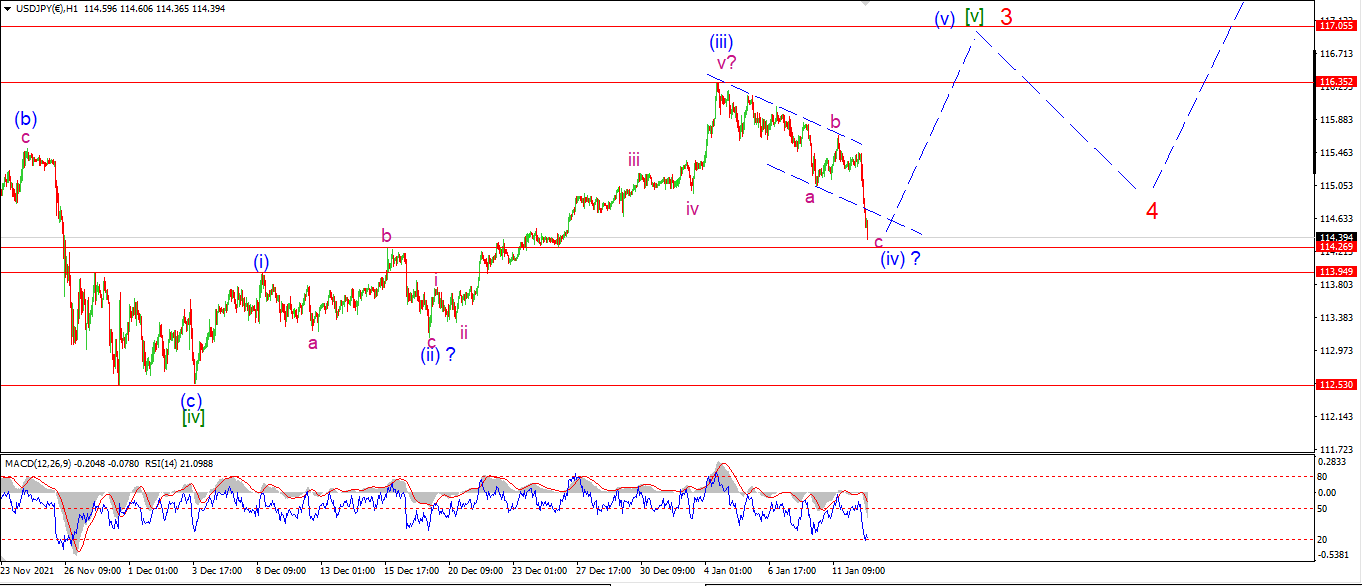
USDJPY 1hr.
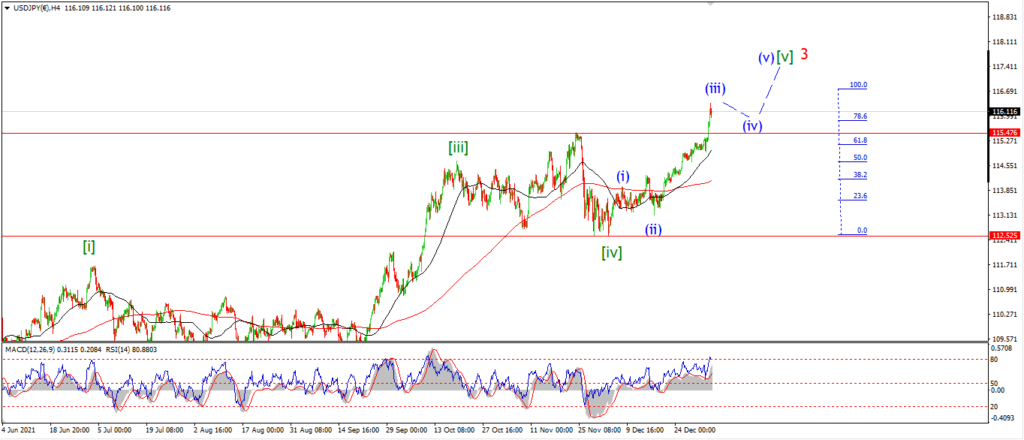
USDJPY 4hr.
USDJPY daily.
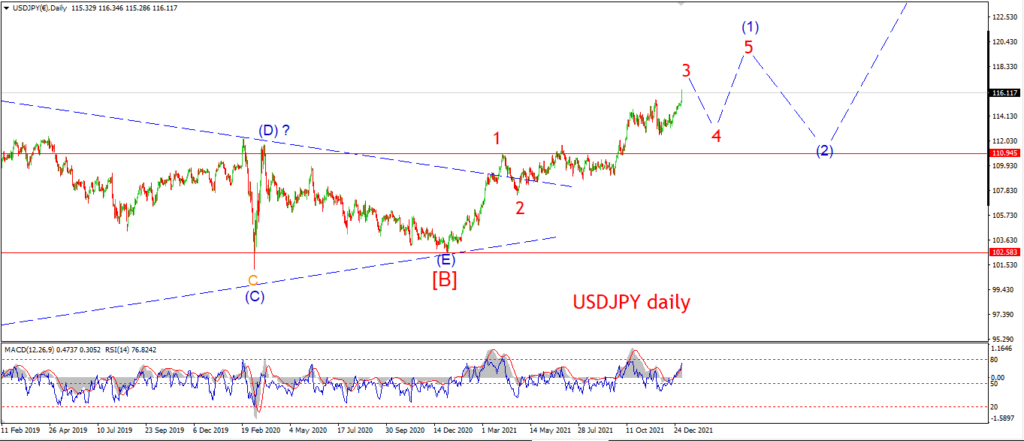
Although the correction lower in wave (iv) ahs expended today,
the decline has not invalidated this pattern yet.
The invalidation level lies at 113.95 at the wave (i) high.
If that level breaks,
then I will have to rethink USDJPY again.
But for now I am sticking to my guns here and I think we will see a reversal higher into wave (v) again this week.
Tomorrow;
Watch for wave ‘c’ to bottom out above 113.95.
The price should bounce back into the channel to begin wave ‘i’ of (v).
DOW JONES.
DOW 1hr.
DOW 4hr
DOW daily.
The Dow barely budged today even with a 7% print on the cpi,
Thats an interesting data point without adding anything else to it!
It is almost like the market knew all this already and it was priced in…..
Or it just does not matter at the end of the cycle!
I have linked the david rosenberg interview above,
and he just nails the disinflation to deflationary future we are looking at here.
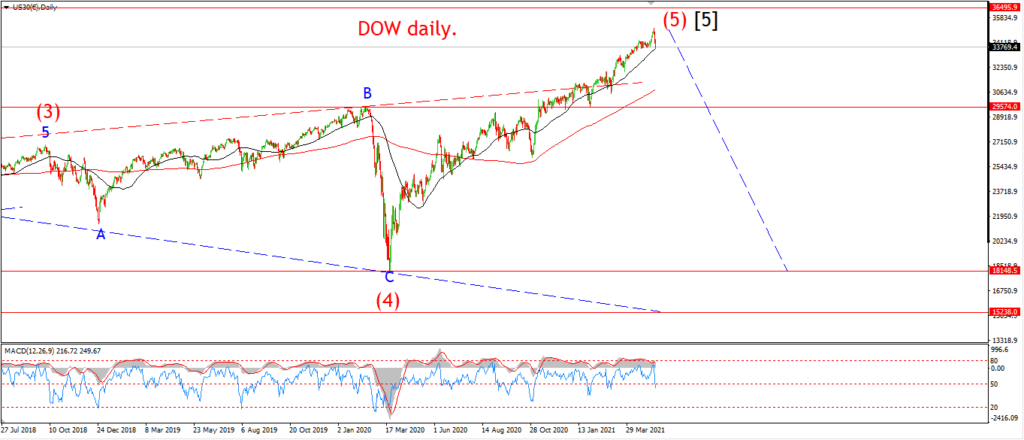
We are at the peak of an inflation cycle now,
and when this turns lower again,
and FED rates begin to tick higher,
and the fiscal punch bowl is pulled away,
this party is going to end with a bang!
And risk assets are in for a beating off all time wildly overvalued highs.
Well,
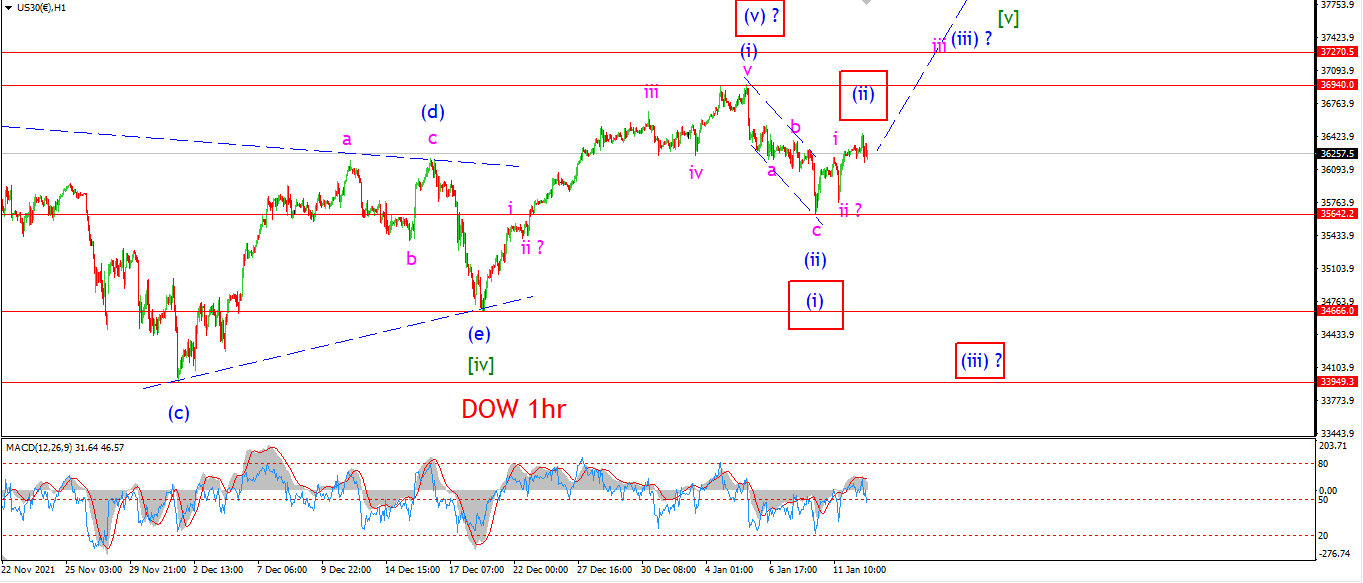
Right now I am torn on the short term count.
I am looking at a three wave rise into todays high.
This does suggest a possible correction higher.
And that fits the alternate count.
So we may be looking at a reversal pattern here after all.
As for the main count,
a drop back below 35640 again will invalidate that bullish count and I can then look towards that alternate count again.
Tomorrow;
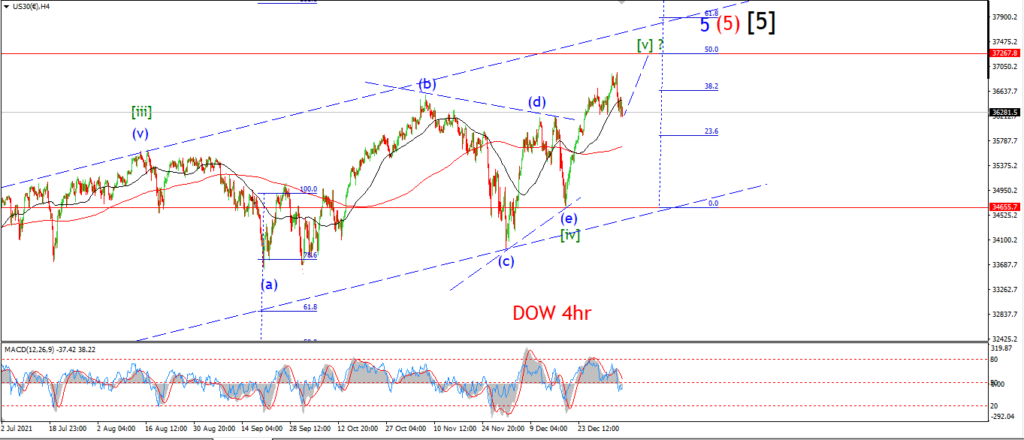
Watch for wave ‘iii’ of (iii) to pull this market higher and confirm the count for wave [v].
If the market falls again tomorrow that will really put the main count under pressure.
GOLD
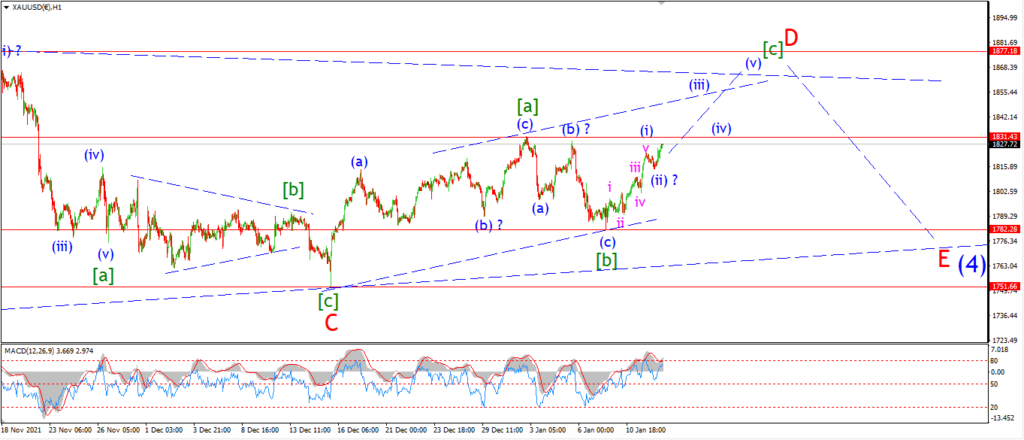
GOLD 1hr.
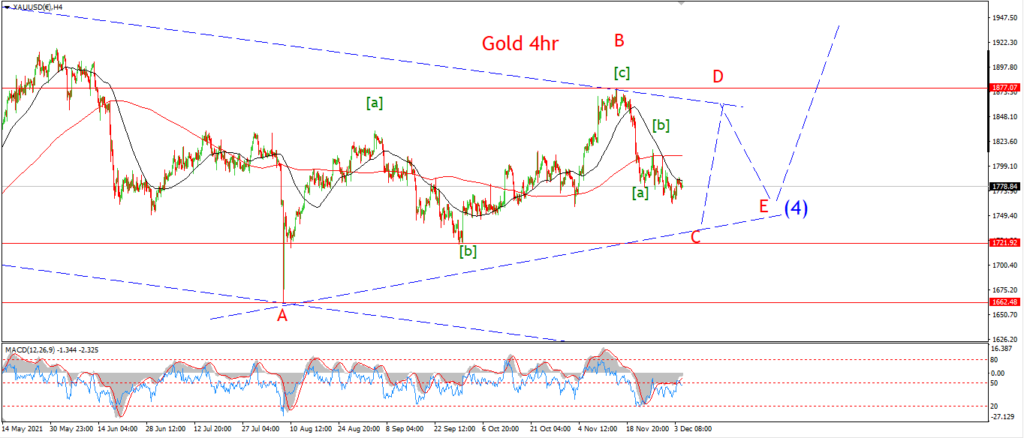
GOLD 4hr.
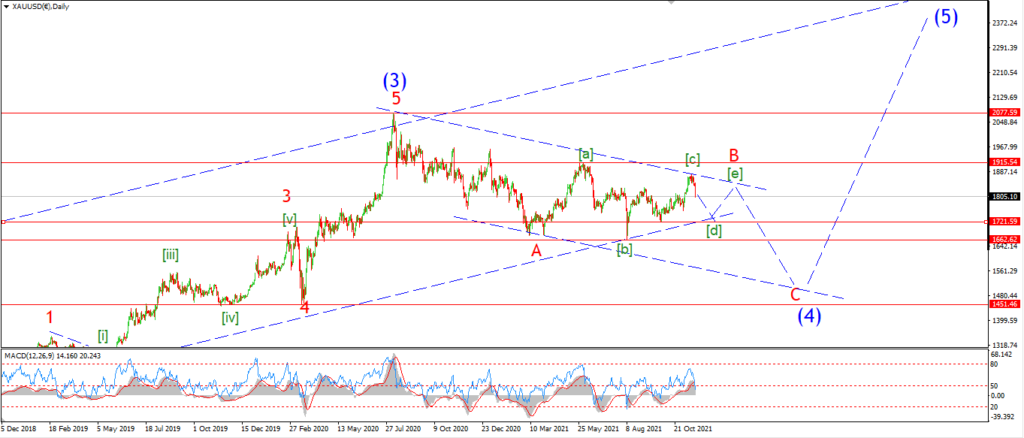
GOLD daily.
The short term pattern in gold is close to confirmation now.
The price must break 1831 to signal wave (iii) of [c] of ‘D’ is underway.
And once that happens I will be looking at an upper target for wave [c] at about 1855.
That will complete three waves up in wave ‘D’ and I can then look lower again into wave ‘E’ to complete the triangle.
Wave ‘D’ must complete below the 1877 high of wave ‘B’.
So that level is the invalidation point for this count.
Tomorrow;
Watch for wave [c] to continue higher towards 1855 in a five wave pattern for the rest of the week.
CRUDE OIL.
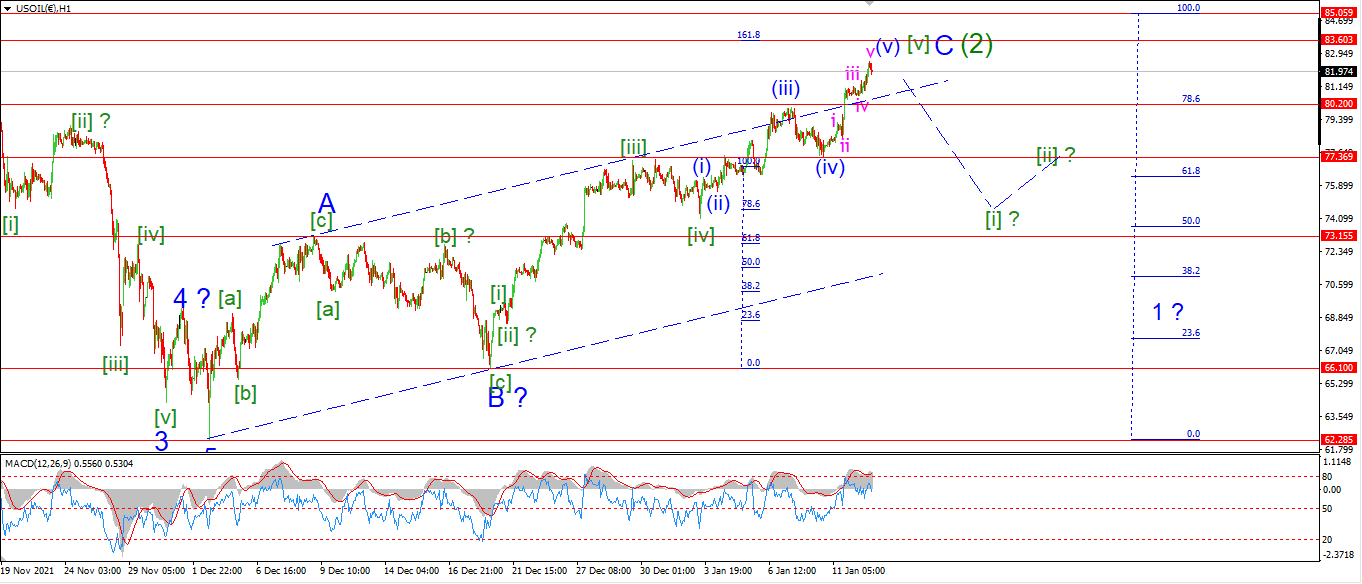
CRUDE OIL 1hr.
CRUDE OIL 4hr.
CRUDE OIL daily.
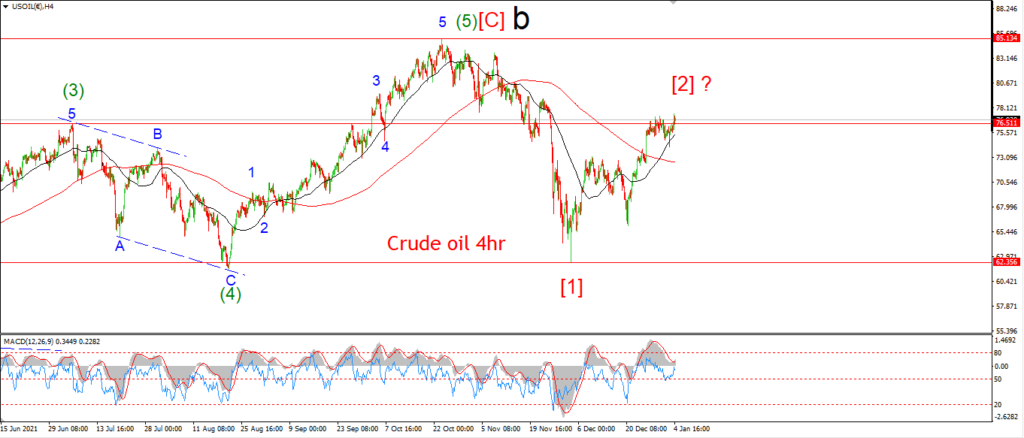
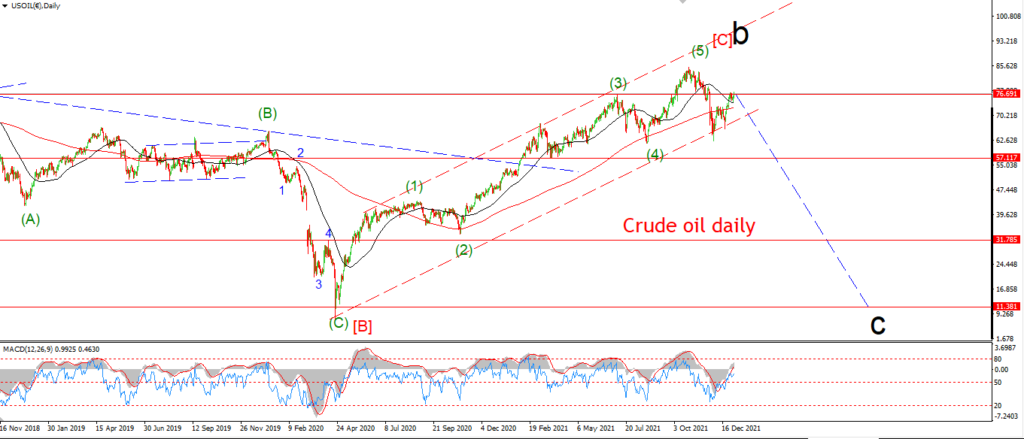
Crude is really in the top end of what a second wave correction should do now,
and It is getting a little hot under my collar for sure now!
The pattern remains valid in wave (2),
and at this point it is still very likely that we see a reversal down into wave (3) over the next few days.
Todays high completed a five wave rally in wave (v) of [v] of ‘C’ of (2),
so the pattern is very full now.
The price has popped above the upper trend channel line again,
and now we need to see an impulsive decline to start and fall back below 77.40 to signal the top is in for wave ‘C’ of (2).
So that’s it,
crude oil must turn now!
Tomorrow;
watch for that initial decline to fall back below the wave (iv) low at 77.40.
S&P 500.
S&P 500 1hr
S&P 500 4hr
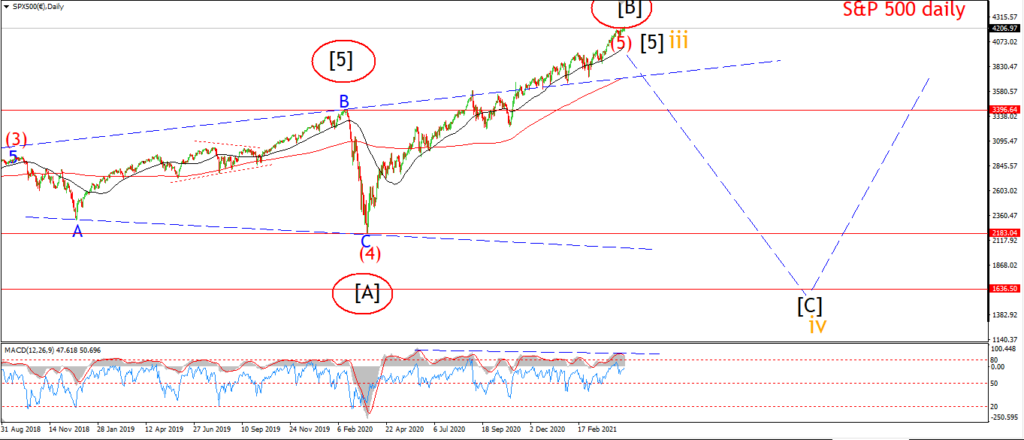
S&P 500 daily.
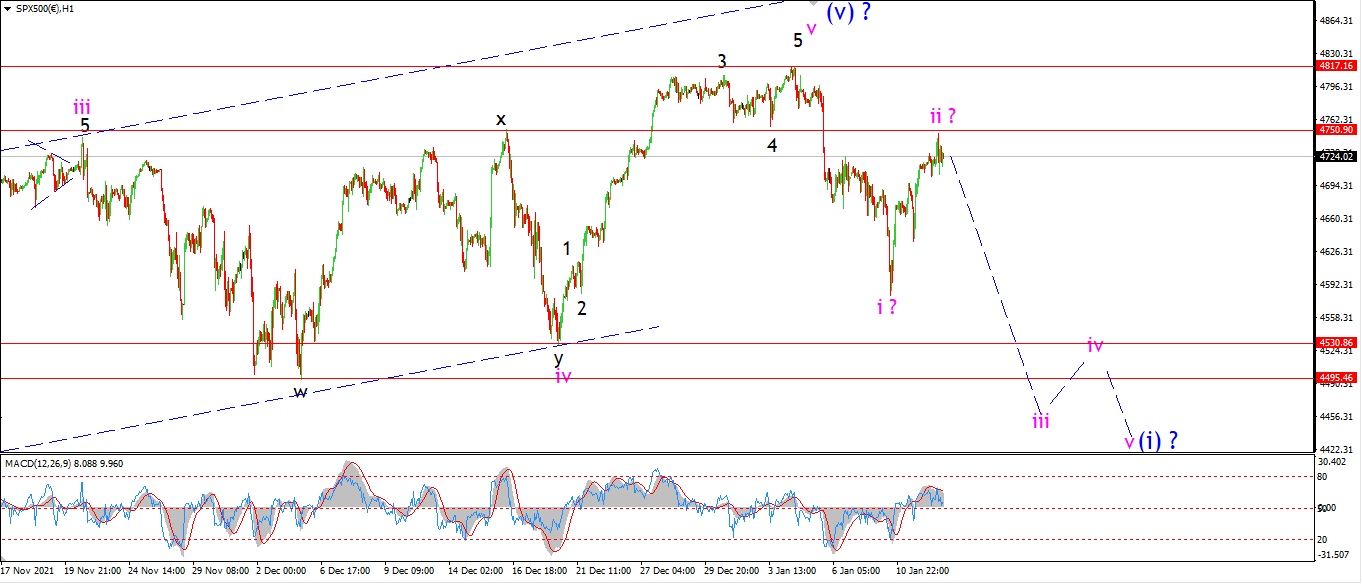
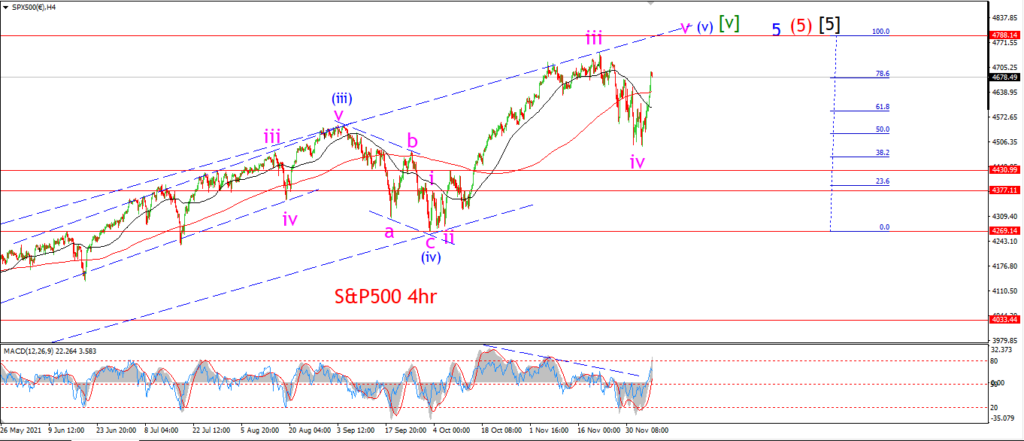
The S&P has traced out a three wave pattern higher into todays highs.
And the price has matched the previous left shoulder highs at wave ‘x’ and wave ‘iii’.
So if we are going to see a decline into a third wave down,
then now is a good time to begin!
The price action was pretty quiet today also,
this can be viewed as a sign that wave ‘ii’ has reached its extreme.
We will have to wait and see if we get a sharp decline into wave ‘iii’ down by Friday to confirm the pattern.
Tomorrow;
Watch for wave ‘ii’ to complete in this area and reverse into wave ‘iii’ down by tomorrow evening.
Wave ‘iii’ down should break the initial support at wave ‘iv’ to signal a larger top is building here.
SILVER.
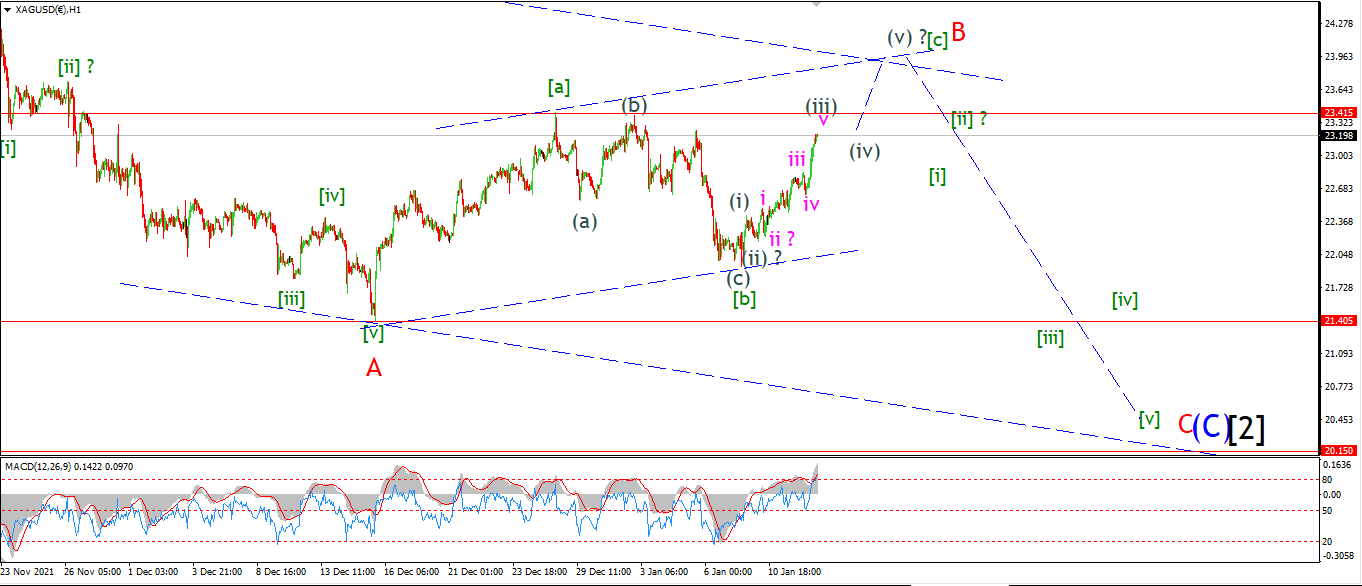
SILVER 1hr
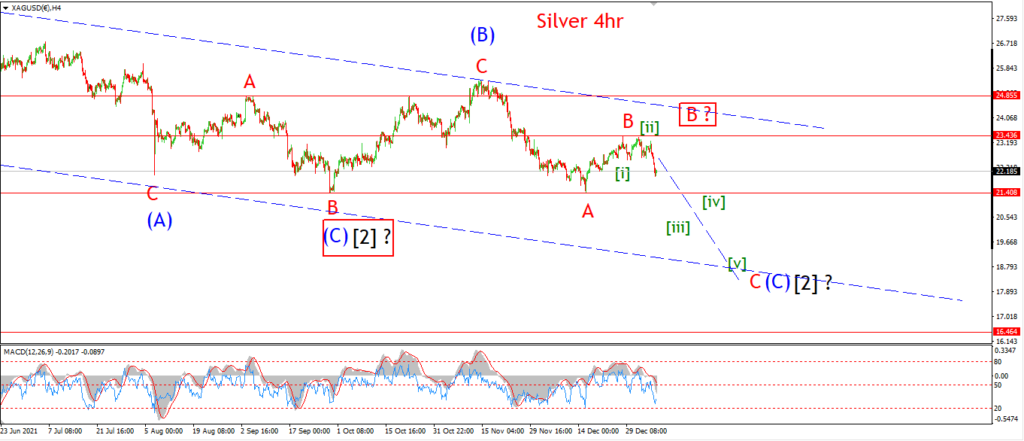
SILVER 4hr.
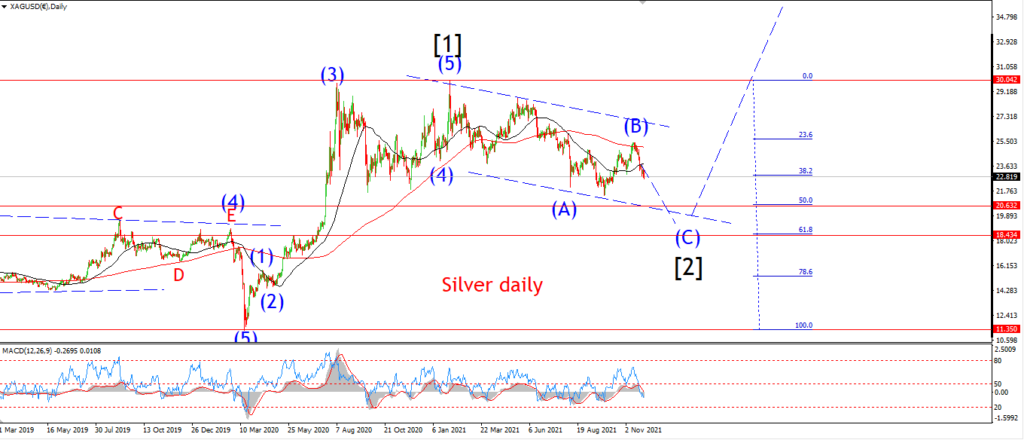
SILVER daily.
I have pulled the trigger on the alternate count for wave ‘B’ today after that spike in price from the cpi print.
I am looking at this action in terms of a five wave rally now in wave [c] of ‘B’.
And wave (iii) of [c] is now coming topping out near the previous highs.
A break of that wave [a] high should lead to a correction into wave (iv).
And wave (v) of [c] should complete early next week.
Tomorrow;
Watch for wave (iii) to opt out near 23.41.
wave (iv) should correct off that level and go sideways into early next week.
BITCOIN
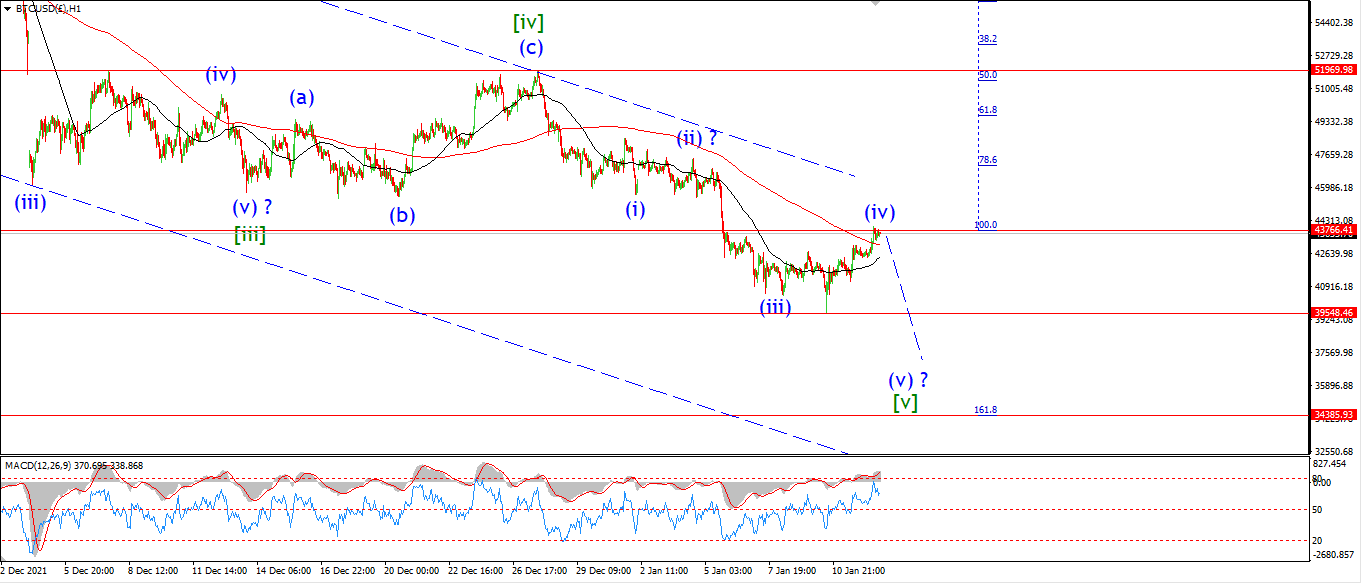
BITCOIN 1hr.
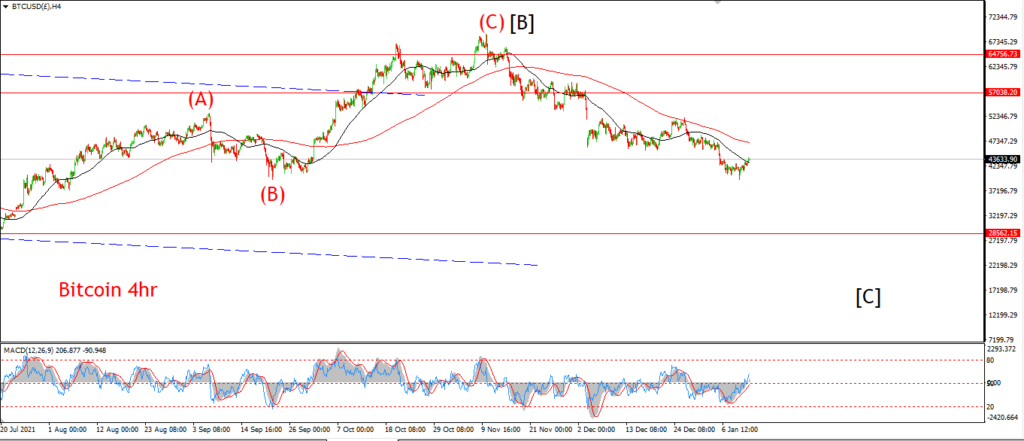
BITCOIN 4hr.

BITCOIN daily.
….
FTSE 100.
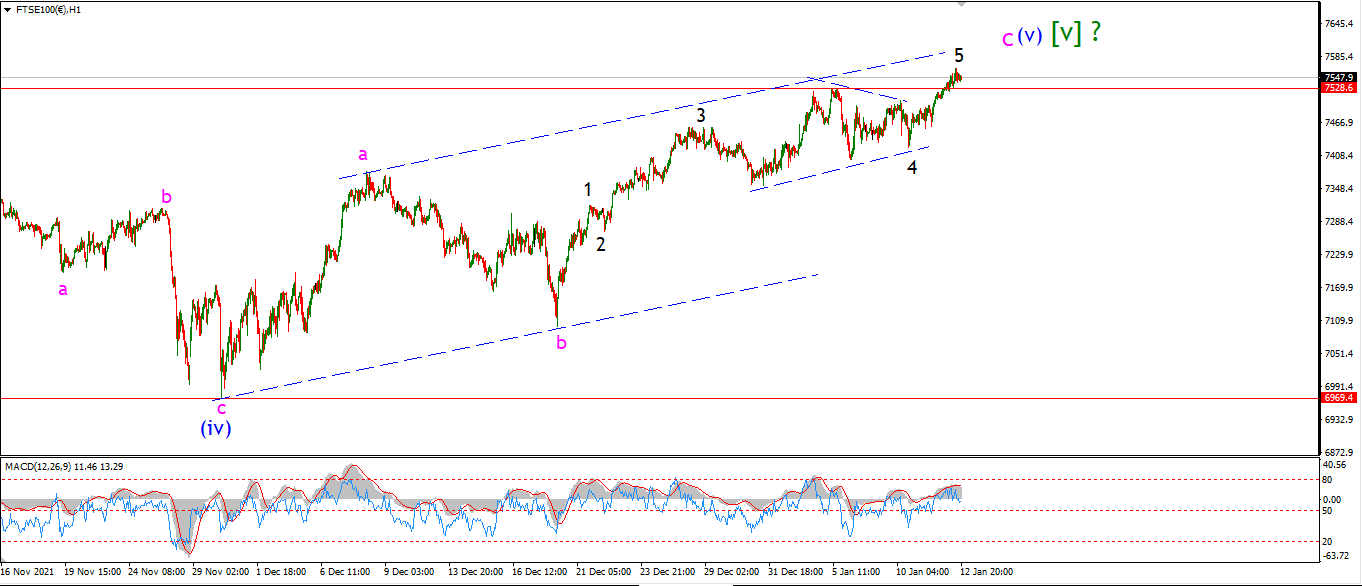
FTSE 100 1hr.
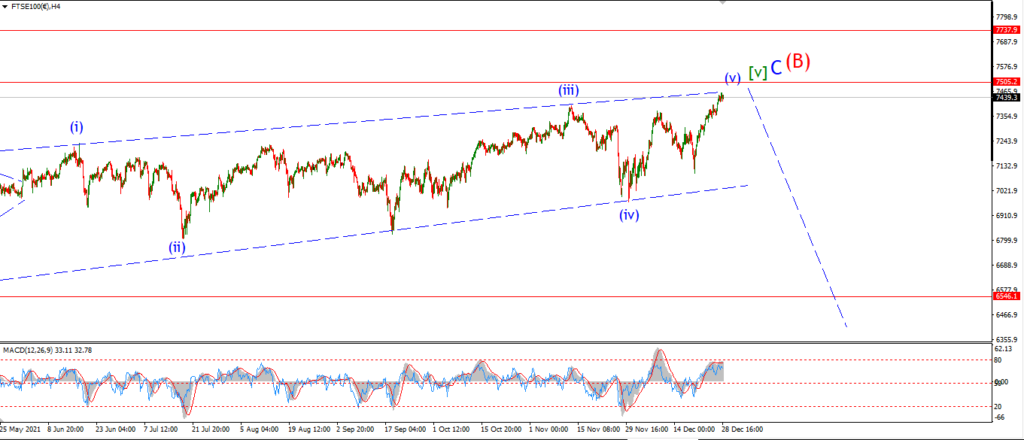
FTSE 100 4hr.

FTSE 100 daily.
….
DAX.
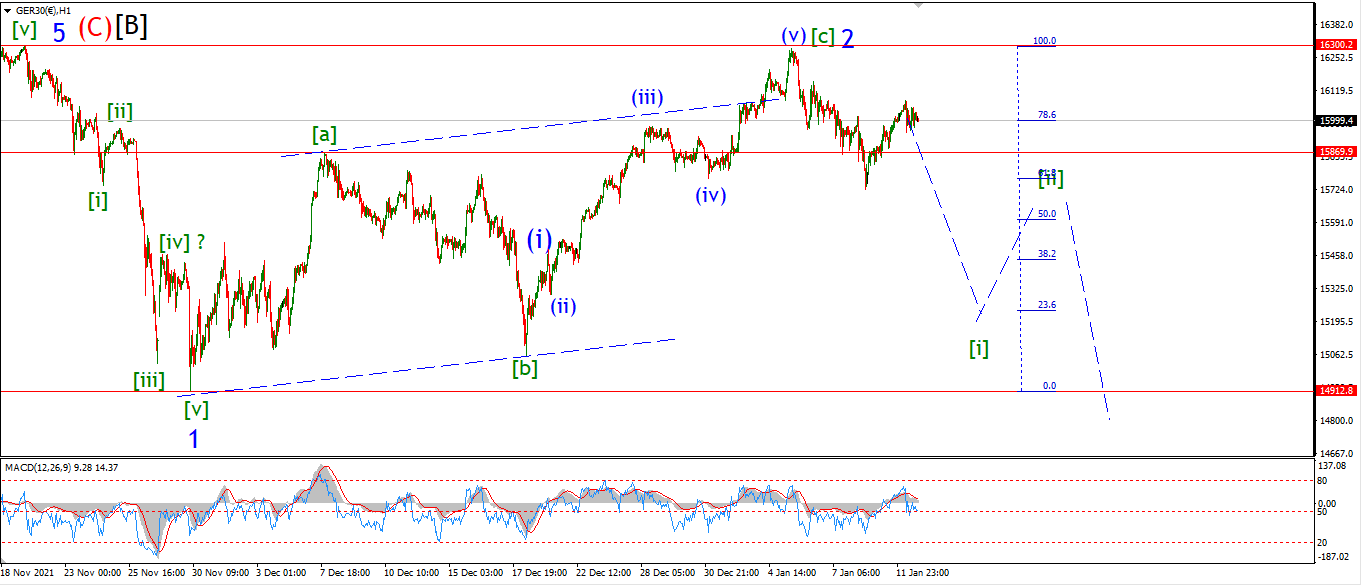
DAX 1hr
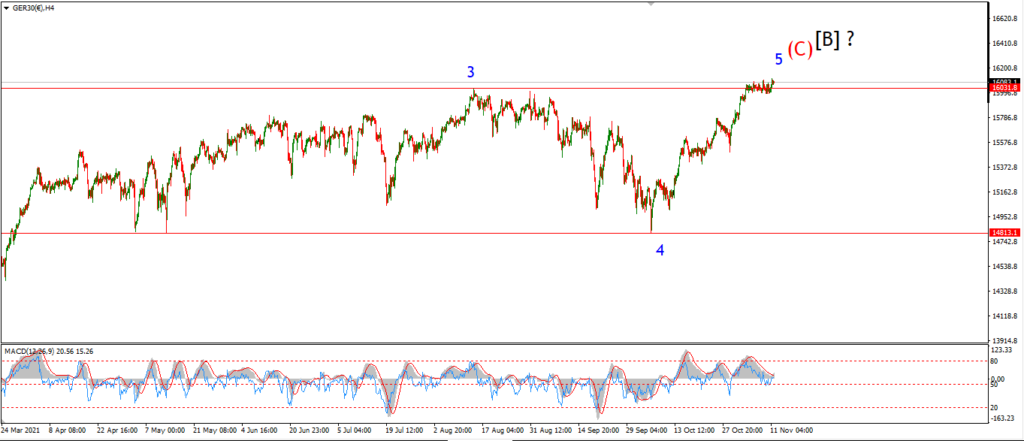
DAX 4hr
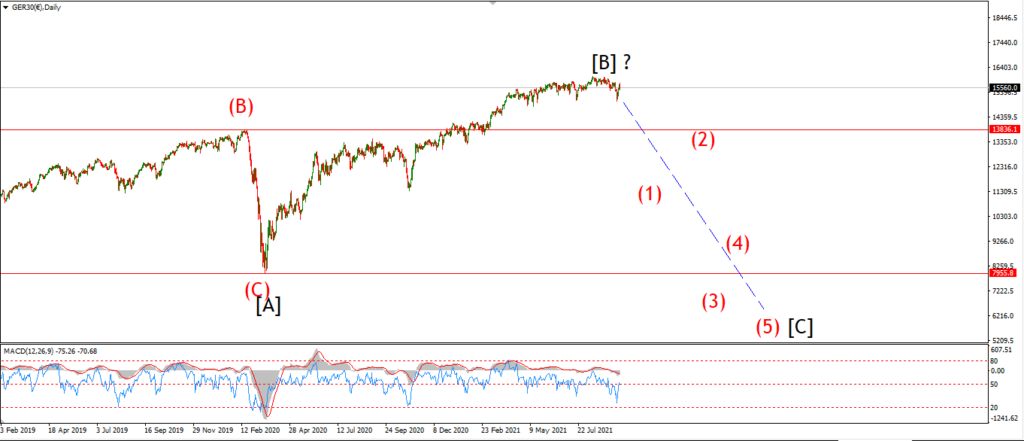
DAX daily.
….
NASDAQ 100.
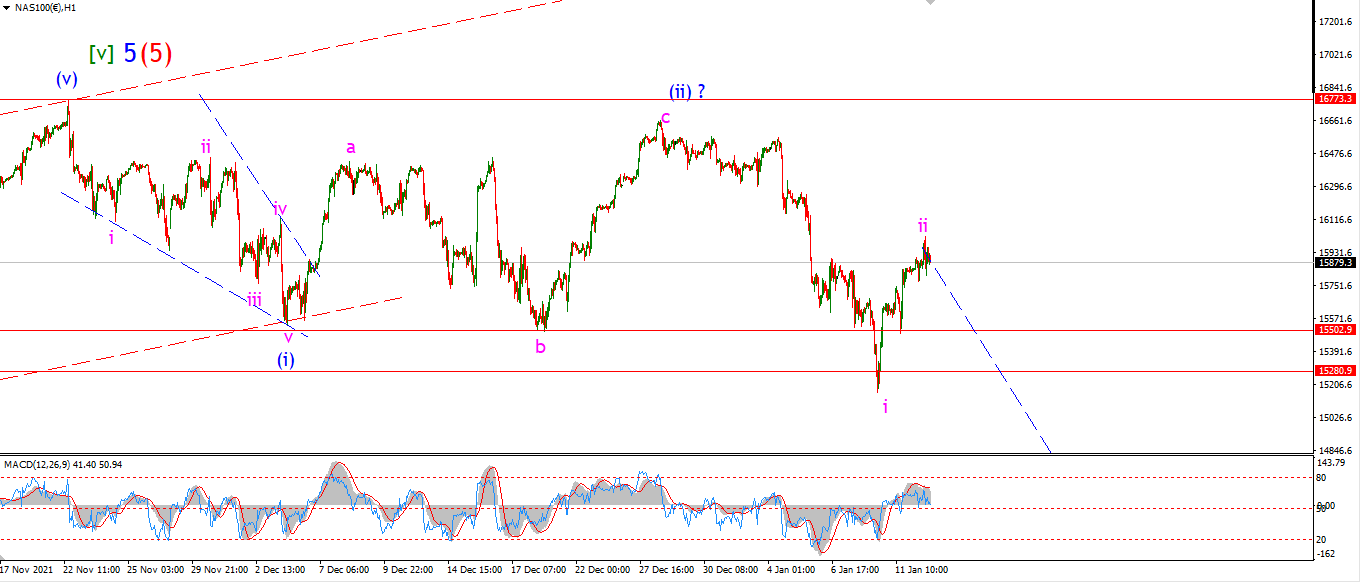
NASDAQ 1hr
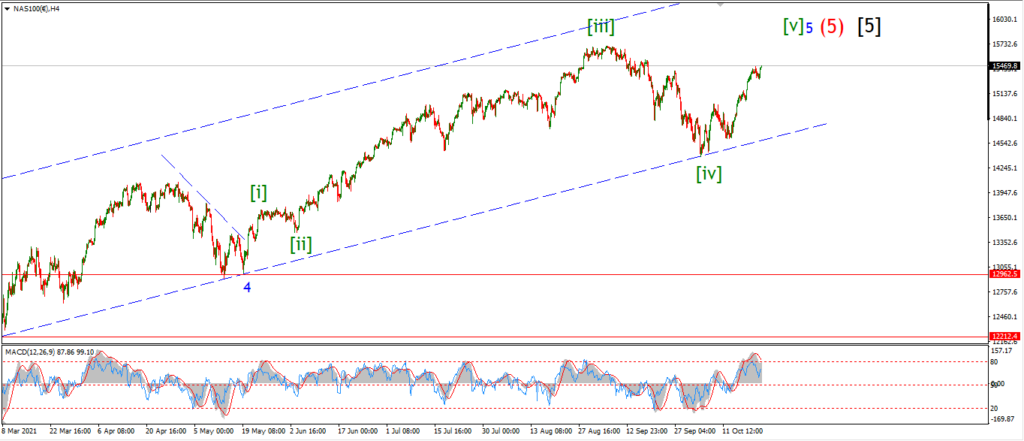
NASDAQ 4hr.
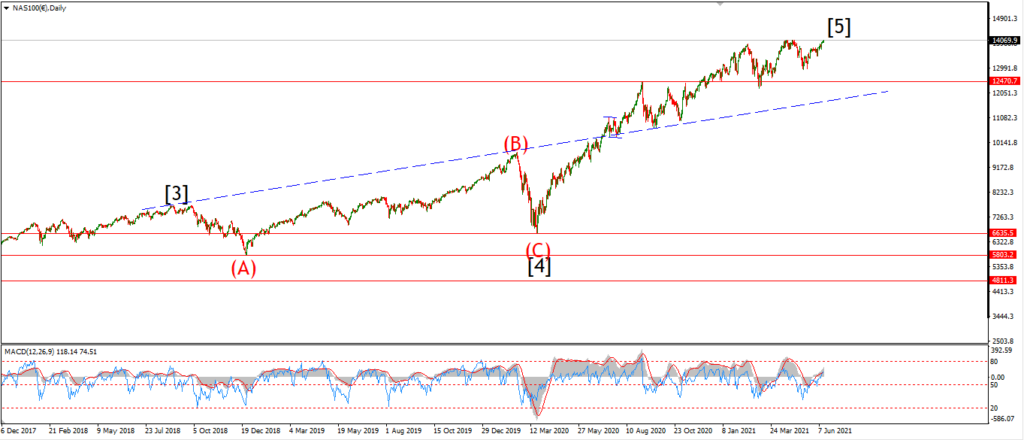
NASDAQ daily.
….