
HI there!
EURUSD.
EURUSD 1hr.
EURUSD 4hr.
EURUSD daily.
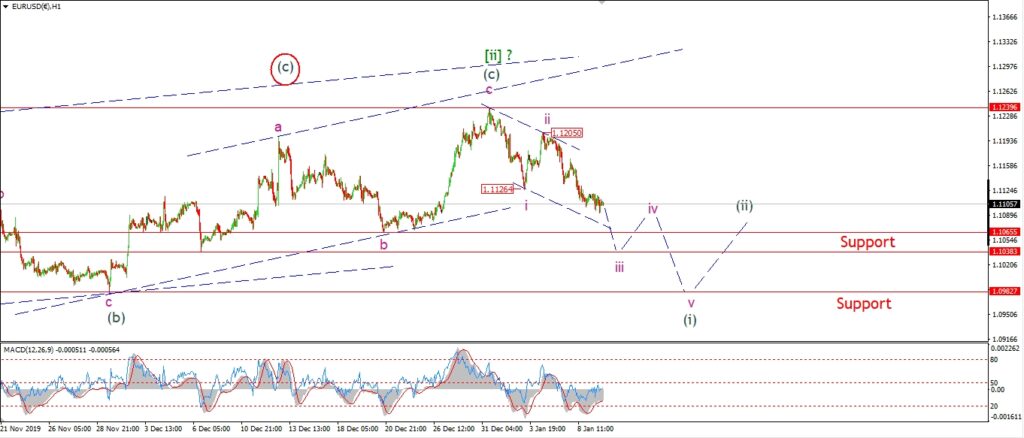
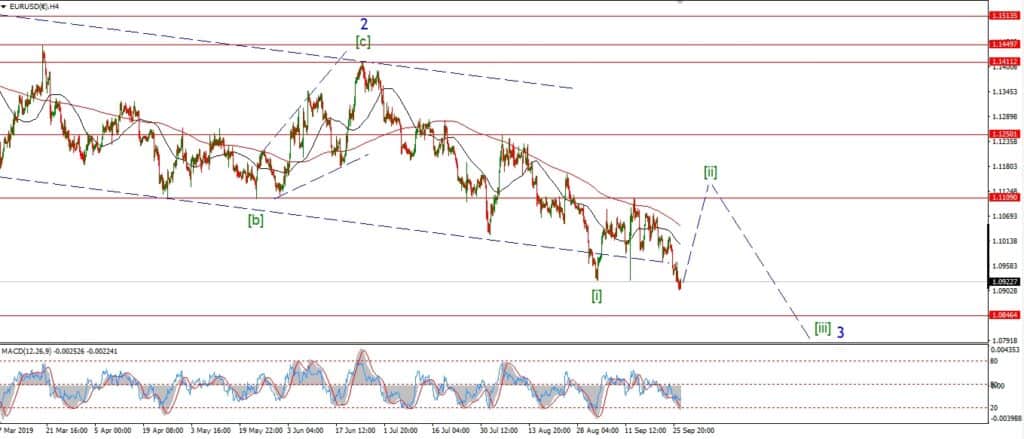
EURUSD is completely flat today where I was expecting an acceleration into the downside.
The price has only fallen in three waves off the wave [ii] high at 1.1239.
so you could also count this decline as a corrective pattern right now.
If this is a correction lower,
that would suggest a rally ahead.
With this in mind,
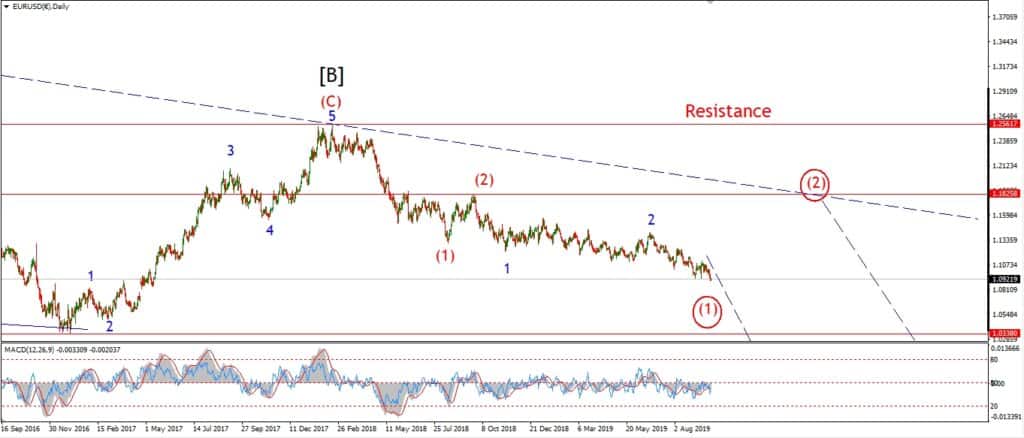
it is worth looking at the larger alternate count for wave (2) red on the daily chart.
That alternate count would allow for a rise into 1.1820 again to complete alternate wave (2) before falling into wave (3).
Tomorrow;
If support holds and the price action continues to move in favor of the upside and the alternate count.
Then we might be looking at a rally over the next few weeks.
Price must fall again and break support at 1.0982 to rule out the alternate count form now.
GBPUSD
GBPUSD 1hr.
GBPUSD 4hr.
GBPUSD daily.
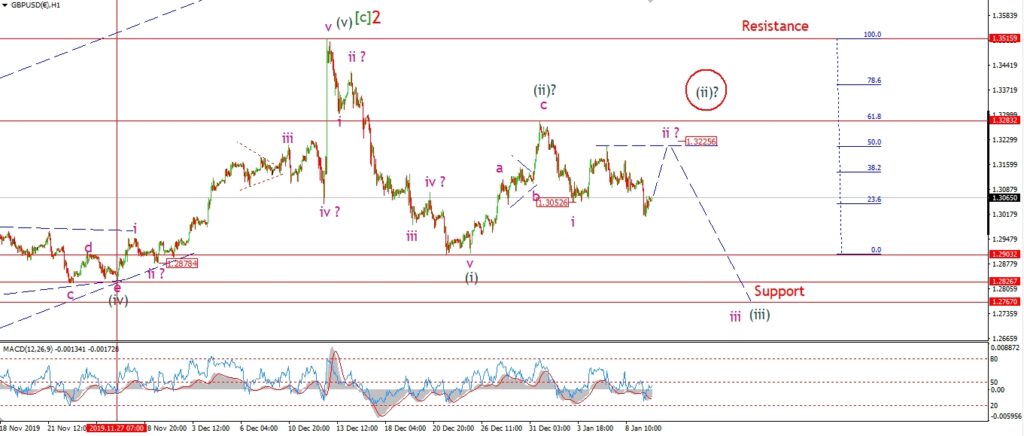
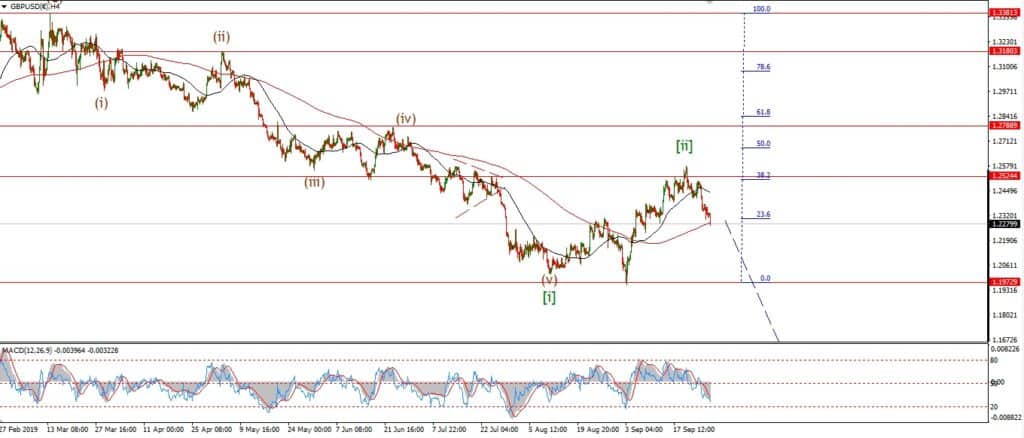
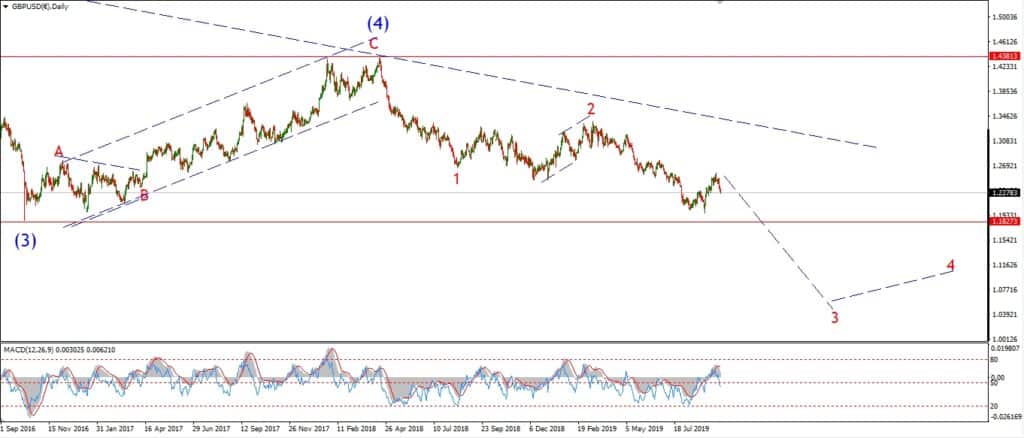
Cable is still holding firm in wave ‘ii’ pink for the moment.
The price drifted below the wave ‘i’ low at 1.3052 today,
but this only changes the correction in wave ‘ii’ to an expanded flat rather than a regular zigzag.
Wave ‘ii’ must rise into 1.3225 again to complete
before turning lower into wave ‘iii’ again.
Tomorrow;
Watch for wave ‘ii’ to complete below 1.3283 and then turn lower into wave ‘iii’ again.
USDJPY.
USDJPY 1hr.
USDJPY 1hr.
USDJPY daily.
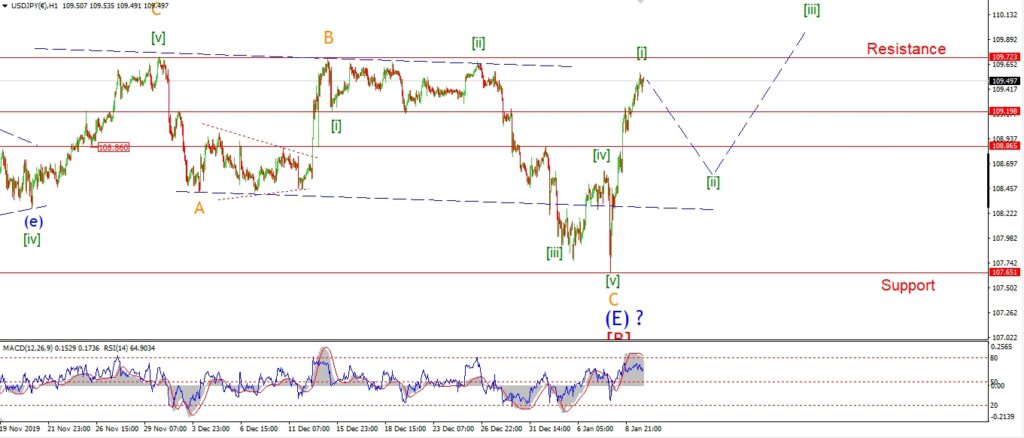
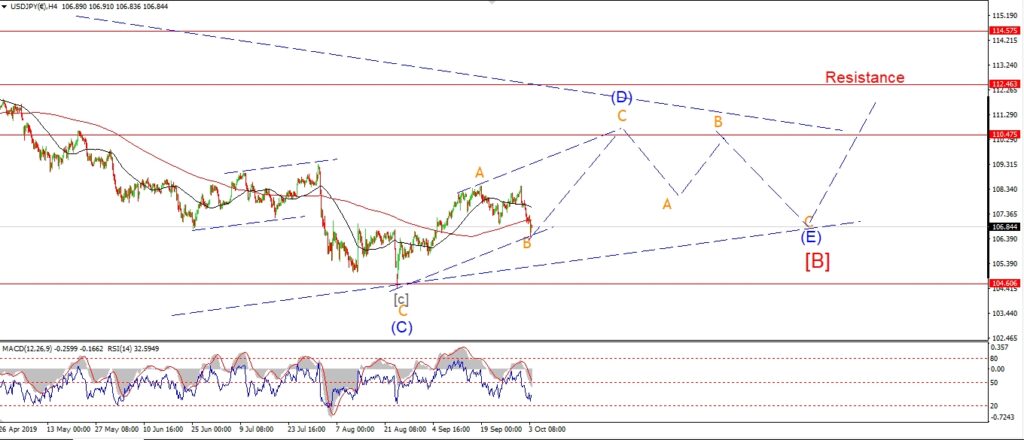
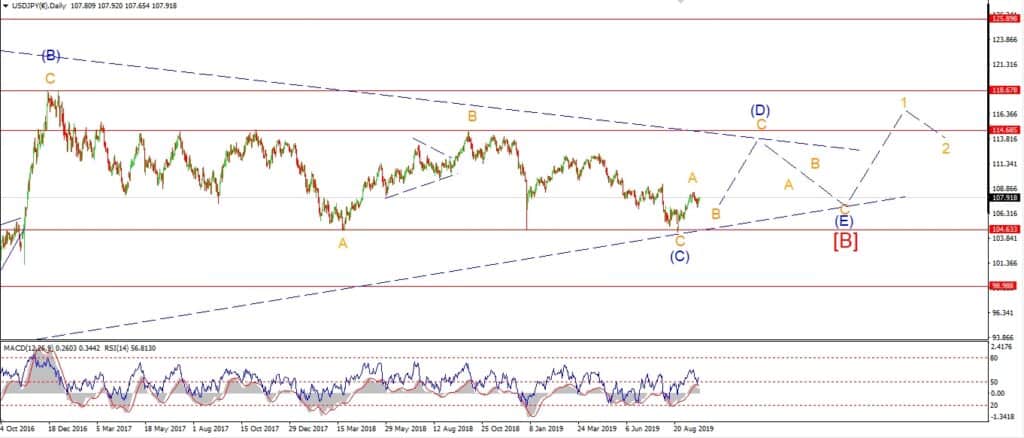
The rally in USDJPY this week is large enough to move the wave count up by one degree.
The price has pushed right up to the resistance level at 109.72,
this level is important because a break above that level
will be a strong signal that the market has turned up out of the large triangle to begin a large rally up in wave [C] red.
The larger wave [C] rally could eventually bring the market up above 125.00.
So there is serious potential here.
Tomorrow;
We need some more price action to follow in our favor before getting very excited.
While it is not necessary,
a break above 109.73 would be very good for the bullish count.
Watch for a correction in wave [ii] green to trace out over the coming few sessions.
This should form a bullish higher low above 107.65 as shown.
DOW JONES.
DOW 1hr.
DOW 4hr
DOW daily.
Turns out that downed jetliners and the prospect of war in the middle east
is actually all time high type of bullish for the market! – go figure!
The madness of crowds will never cease to amaze me!
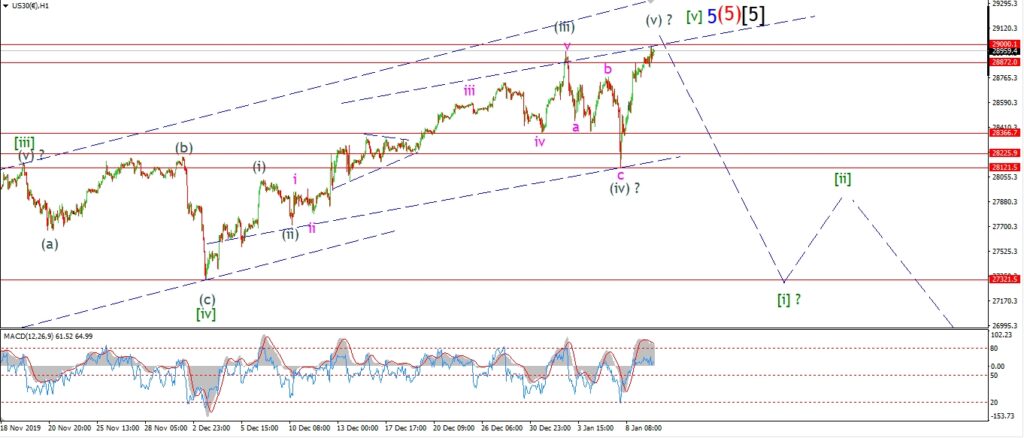
The market did reach for that 29000 level today in wave (v).
And with that move,
the price has again filled the trend channel in wave [v] green,
and we have another five wave structure in place to complete wave [v].
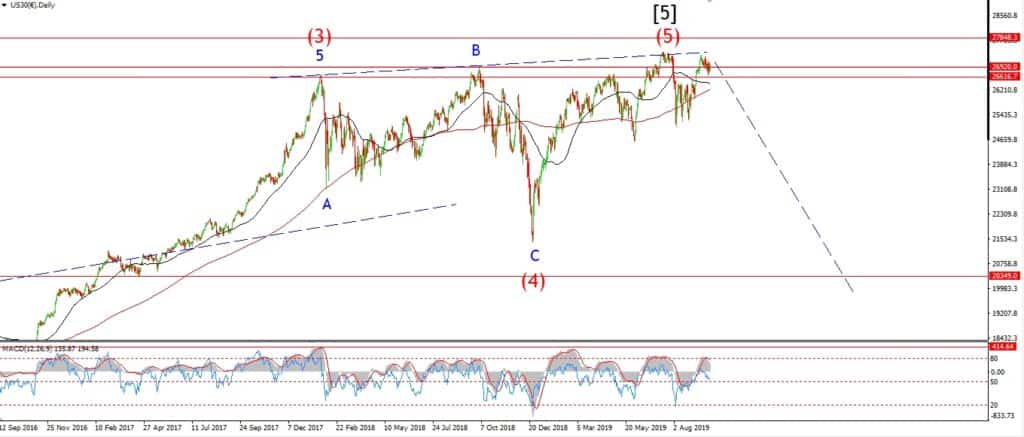
If this short term pattern is close to correct,
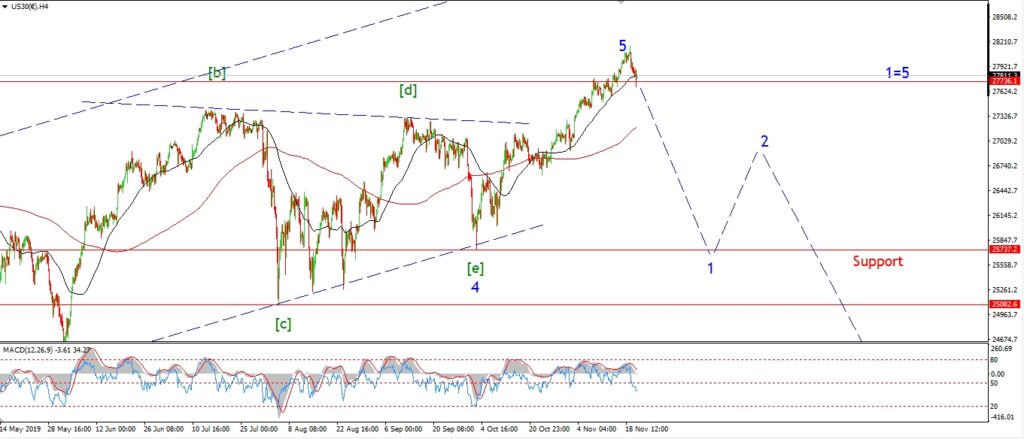
then the outlook here is hard negative for a long time to come.
Tomorrow;
Watch for this wave (v) to complete.
the next move lower will the a sprint, not a jog.
And wave [i] will likely surprise everyone.
The minimum target for wave [i] lies at the previous wave [iv] low of 27320.
GOLD
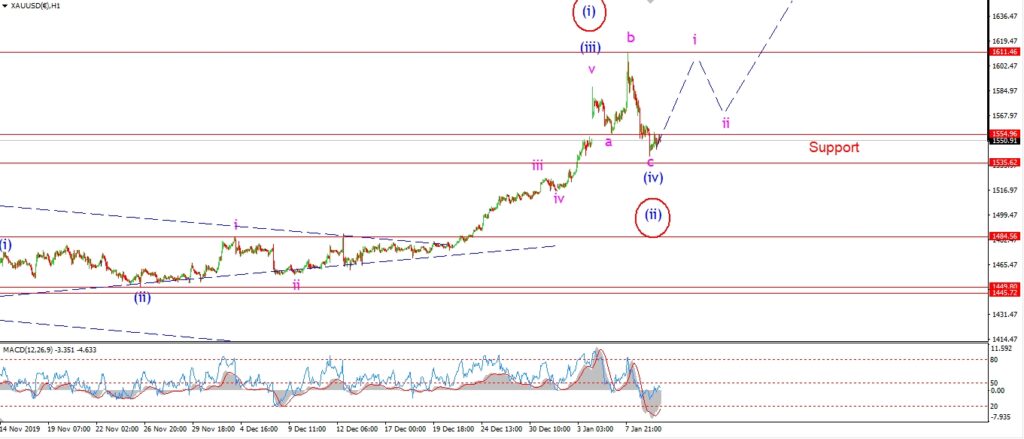
GOLD 1hr.
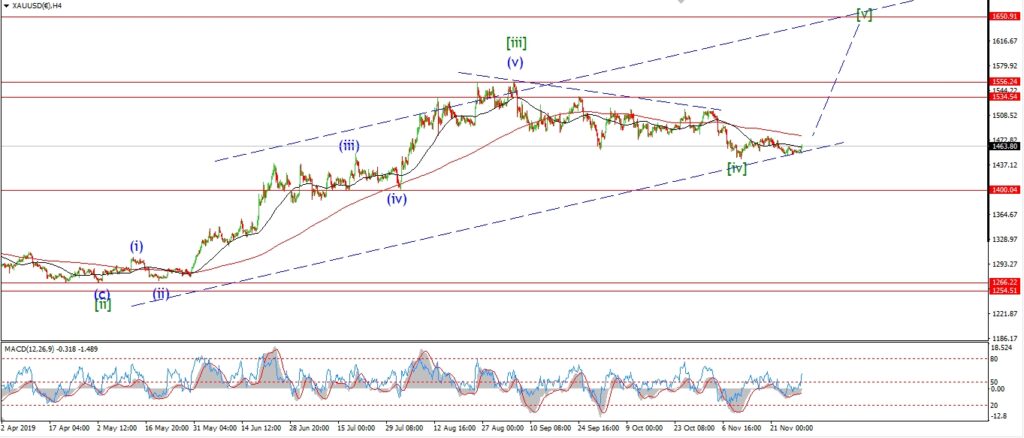
GOLD 4hr.
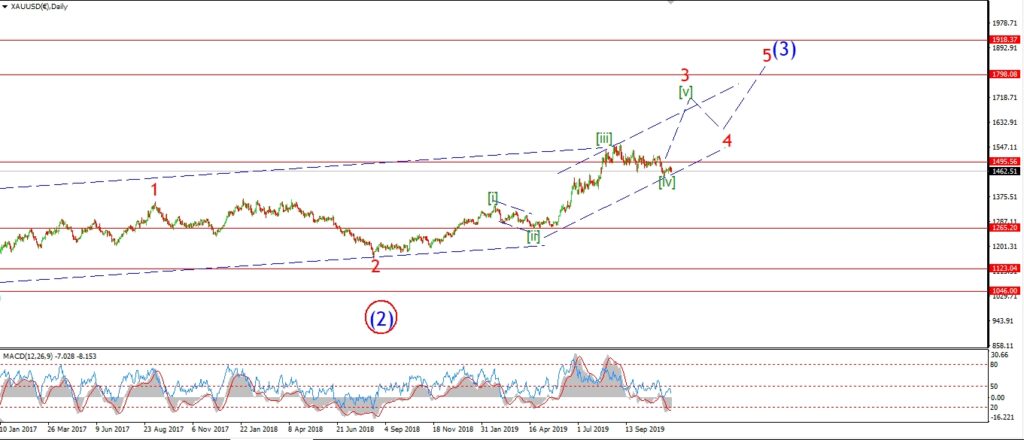
GOLD daily.
It is possible that wave (iv) blue is now complete at the session lows today.
The expanded flat correction has dropped into that initial support zone this evening.
Support is formed by the interim highs within the previous correction.
And this level is a good area for a base to build again to begin wave (v) of [v].
Tomorrow;
Watch for a move higher off the lows at wave (iv) to begin wave ‘i’ of (v).
Wave (v) will be confirmed with a break of 1611 again.
CRUDE OIL.
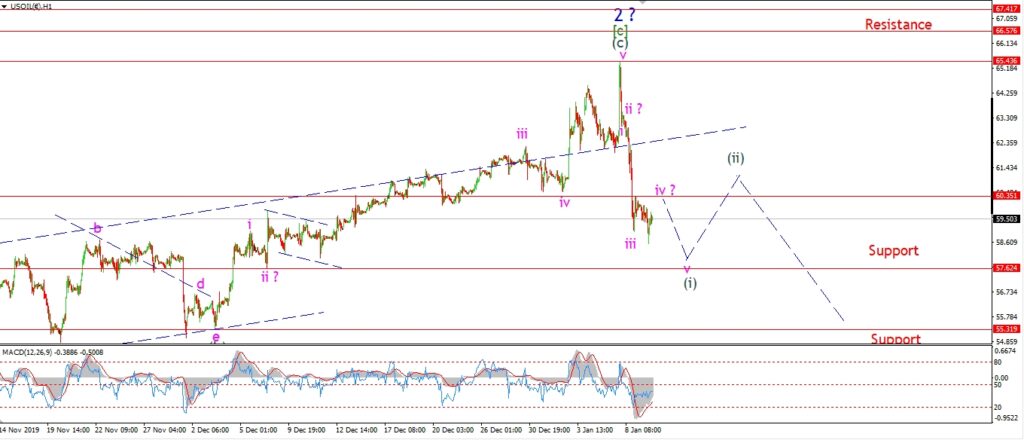
CRUDE OIL 1hr.
CRUDE OIL 4hr.
CRUDE OIL daily.
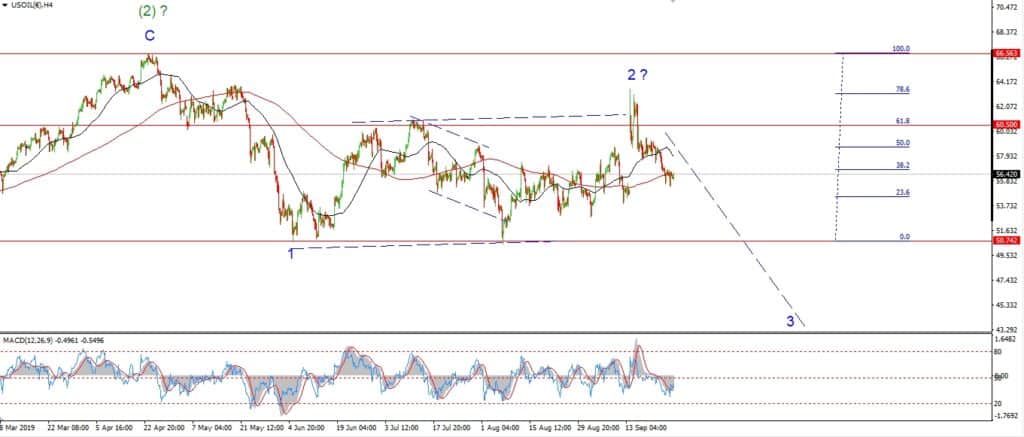
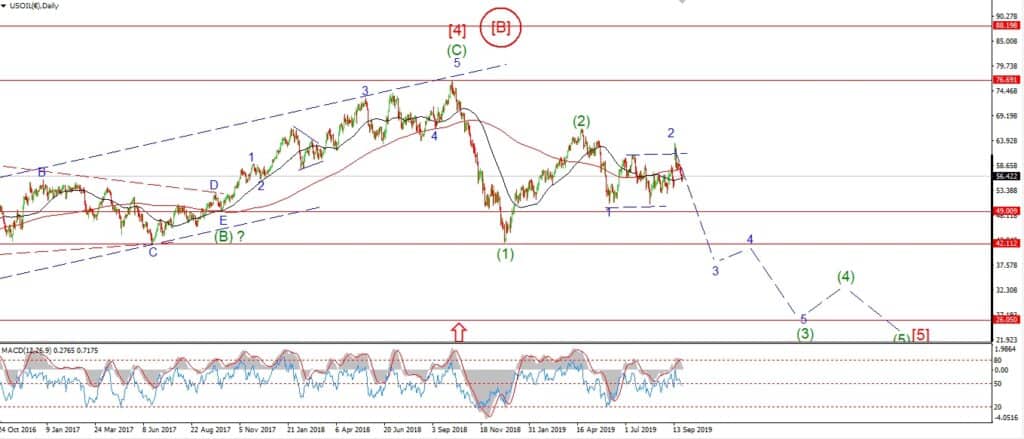
It is hard to know if the sideways action today is part of wave ‘iv’ of (i) down as shown.
Or,
if the low today is the completed wave (i) now in place.
Only the action off that low will decide which interpretation is correct.
A small move up to 60.40 that fails will signal that wave ‘iv’ is complete,
and wave ‘v’ down has begun.
While a larger correction back towards 62.50 again from this low,
will favor the idea that wave (ii) has begun.
Tomorrow;
Watch for wave ‘iv’ to complete and then price should return lower again into wave ‘v’.
I would like to see wave ‘v’ push down below 57.60 again.
S&P 500.
S&P 500 1hr
S&P 500 4hr
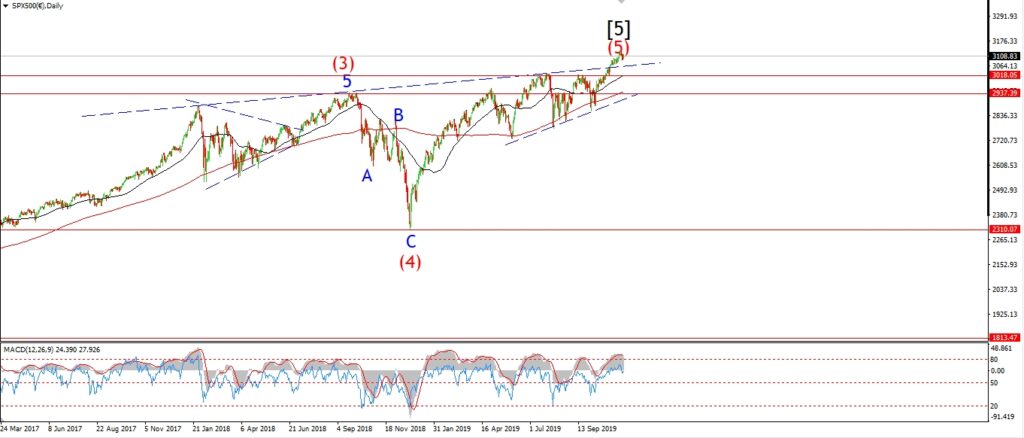
S&P 500 daily.
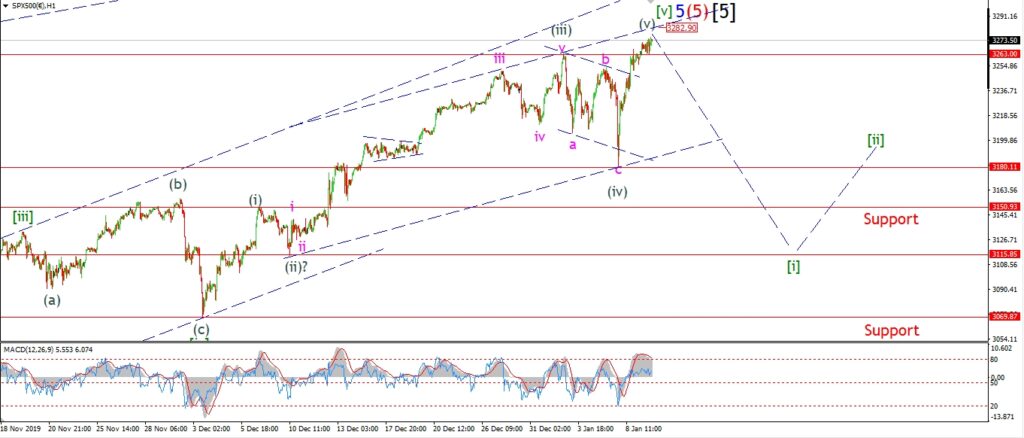
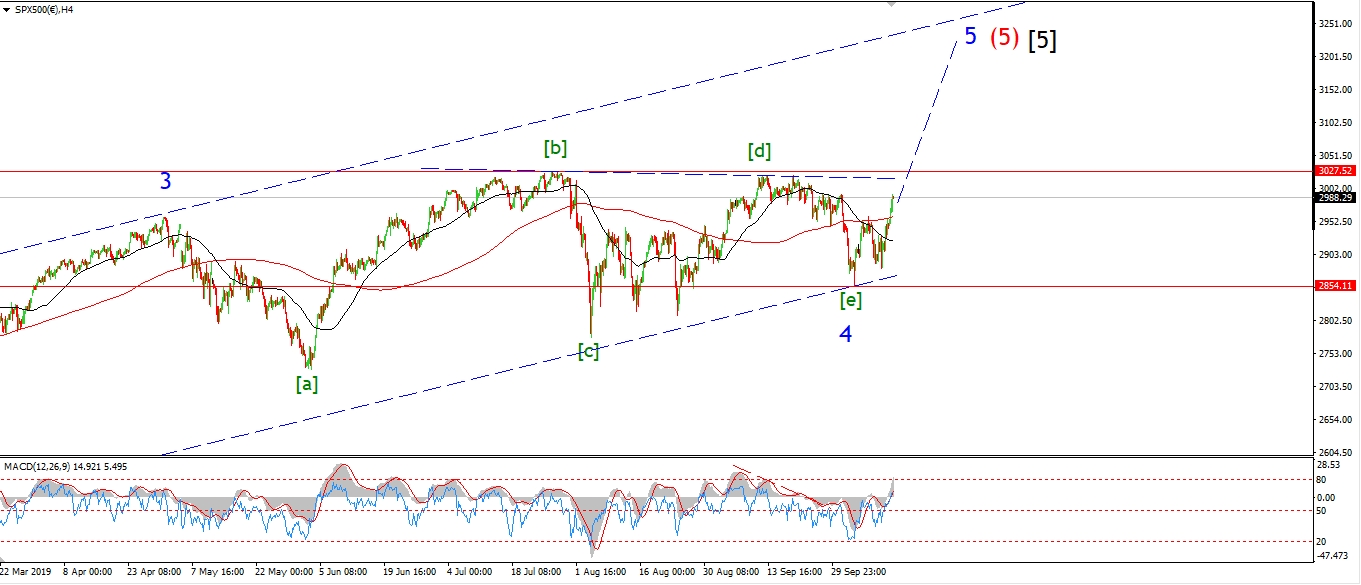
The S&P broke to a new all time high today also.
The price is sitting quietly at the top this evening as I write.
Wave (v) did not touch the upper trend line yet,
it does not have to per se,
but a touch of that line,
followed by a sharp move lower off that line would be a good sign that the top was in for that wave.
Tomorrow;
If we reached that upper trend line it would give us a top at 3283 or so.
Watch for wave (v) to complete again.
I will be on full downside alert next week give that the pattern now looks complete for wave [v] green.
3180 is the key level in the short term.
A break of that level will signal wave [i] down has begun.
SILVER.
SILVER 1hr
SILVER 4hr.
SILVER daily.
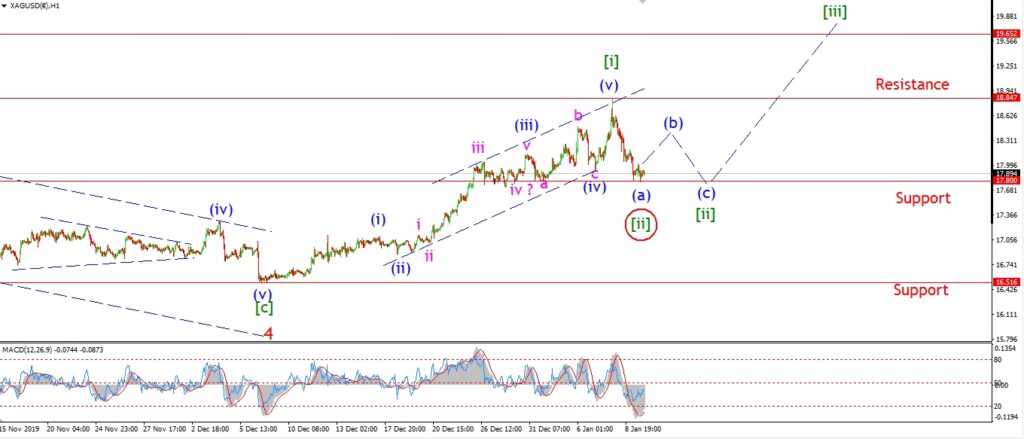
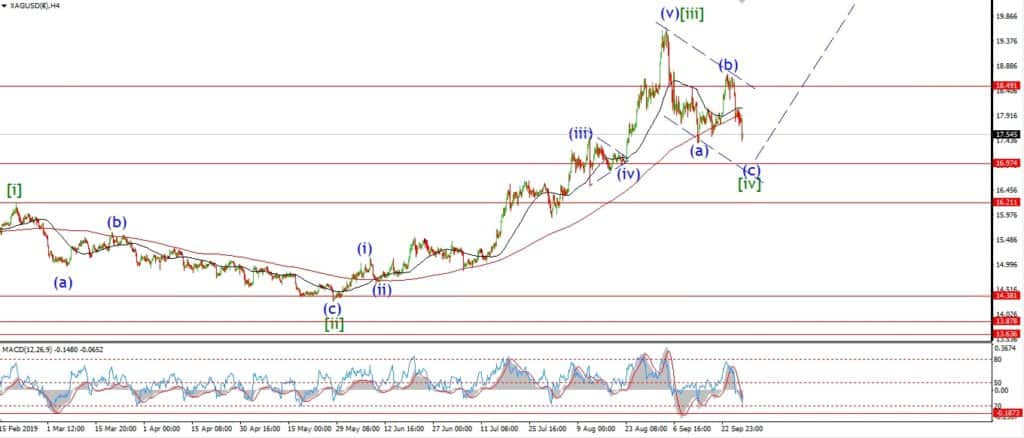
Silver is finding some support at the left wave (iv) shoulder of 17.80 today.
If the price rallies from here in five waves,
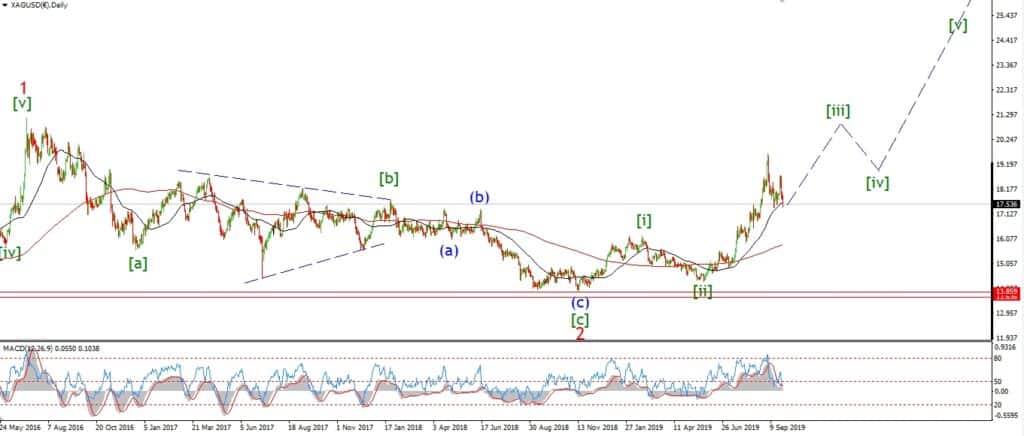
that will signal wave (i) of [iii] has begun.
And that action fits the alternate count.
Otherwise,
the decline off the high is still viewed as wave (a) of [ii],
wave (b) should rise off this low in three waves.
And then wave (c) will fall again to complete a three wave correction in wave [ii] green.
Tomorrow;
Watch for wave (b) to push higher soon.
Wave (b) should top out below 18.80.
U.S 10YR.
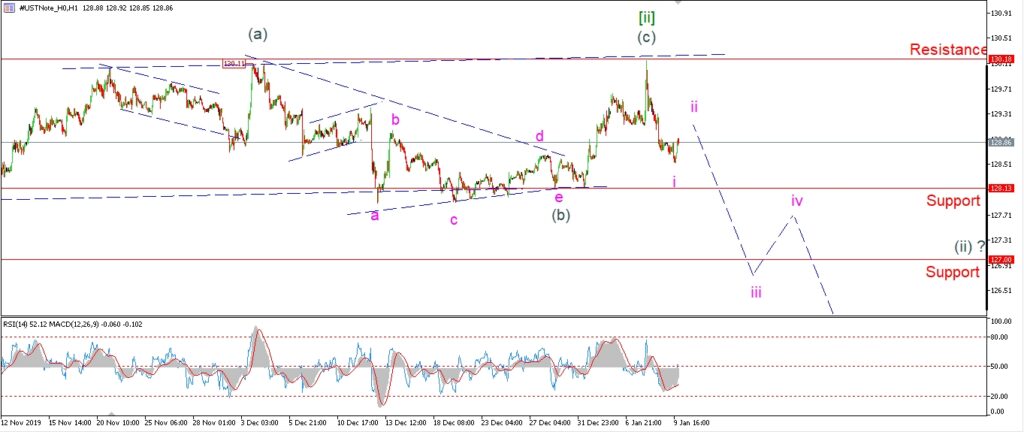
US 10YR 1hr.
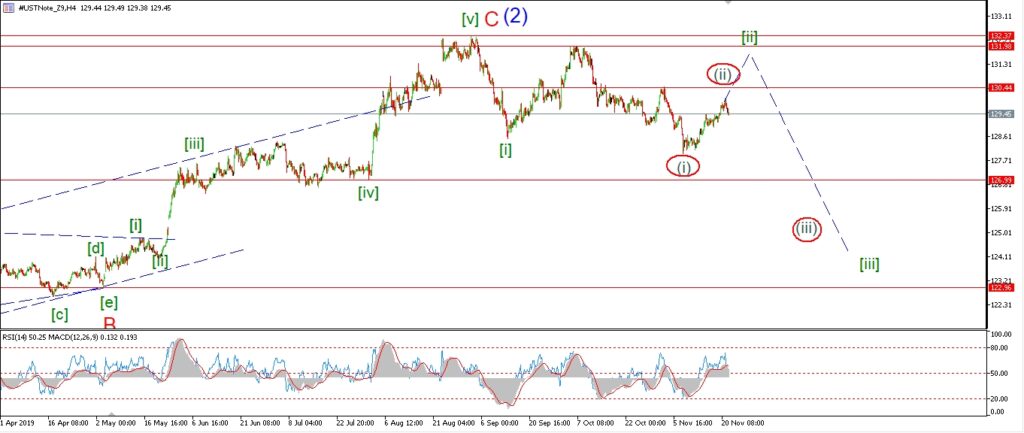
US 10YR 4hr.
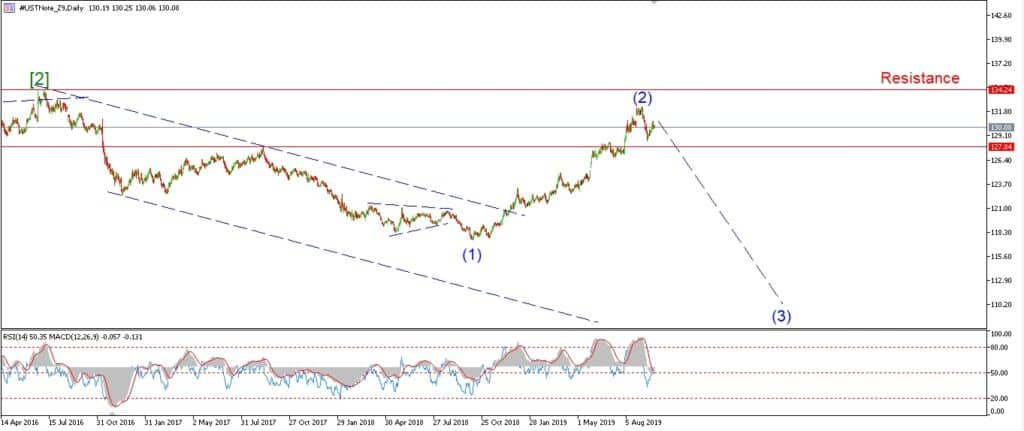
US 10YR daily.
I have moved the wave count in bonds up by one degree also tonight.
So,
the recent correction higher is now viewed as wave [ii] green.
And the decline off that high this week is viewed as wave ‘i’ of (i) of [iii].
The decline in wave ‘i’ can be counted as a five wave structure.
So the rise off the session low is now viewed as the beginning of wave ‘ii’ pink.
Tomorrow;
Watch for wave ‘ii’ to trace out a three wave recovery to complete up above 129.00.
We should see a sharp decline begin next week in wave ‘iii’ of (i).