Learning just a few key candlestick patterns,
along with your Elliott wave analysis,
WILL improve your ability to recognize trading opportunities.
and, that is a fact!
Adding the predictive power of an Elliott wave count
with candlestick patterns
increases the probability of catching major turning points in the price.
So,
by recognizing these candlestick patterns
and applying the the patterns to your Elliott wave count,
will yield results in your trading!
Don’t think of this as a list to memorize.
Think of this as a guide that you jump in and out of, whenever you need to jog your memory!
For the most part Candlestick patterns are about spotting market turns, If you can spot a turn, then you can profit from it. The value of candlestick patterns to spot trading opportunities is a thorny topic among the trading community, but there have been statistical studies on the accuracy of technical analysis and the results are pretty convincing.
I have broken down the patterns into 3 categories:
- Equal open and close candles. ( known as doji candles )
- Short body candles.
- Long body candles.
Within these categories are both bullish reversal and bearish reversal patterns.
So:
When you think you see a familiar candlestick pattern in your charts, You can double check the pattern in this guide and make an informed choice on what to do next.
Here we go!
Equal open and close, Doji patterns.
Doji:
The basic doji candlestick pattern is when a candle’s open and close are almost equal.
The shadows can vary in length.
So the candlestick looks like an inverted cross, a simple cross, or plus sign. The doji conveys an even struggle between the forces of the market, both side pushing with no net gain is achieved. The doji can be both a reversal pattern and a continuation pattern.
Abandoned Baby: Reversal pattern.
This candlestick pattern looks like it sounds, the parents have walked off and left the baby behind!
This is a reversal pattern which can occur at the end of a run in prices.
It is pretty rare to find, but it is pretty reliable when it does happen.
It happens over three candles, the middle candle is a doji which has gapped away from the previous candle. The final candle gaps back the opposite direction.
The gaps leave a clear distance between the shadow of the doji candle and both shadows of the first and third candle, leaving it abandoned.
Harami Cross:
This is another turning point candlestick pattern which most accurate on a daily chart.
Occurring at both a bullish and bearish reversals, it consists of two candles the first candle brings the market to the high or low.
The next candle is a doji which lies inside the range of the real body of the previous candle.
Dragonfly Doji:
The dragonfly normally appears at reversals.
The open and close of the candle are at or near the high of the day. The shadow can vary in length, but is usually quite long.
The Dragonfly doji is quite a powerful reversal indicator and does point to large moves ahead.
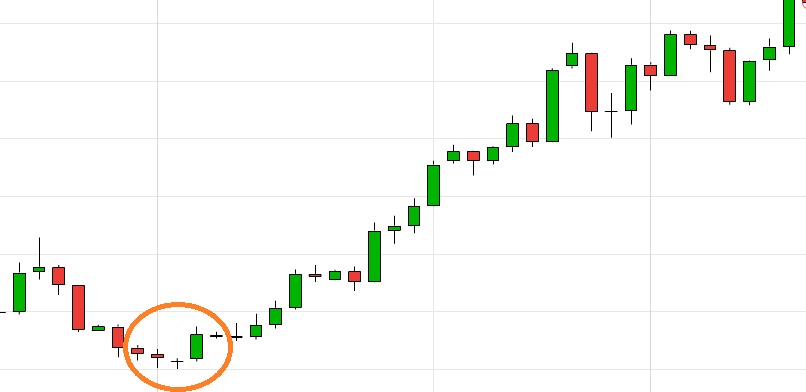
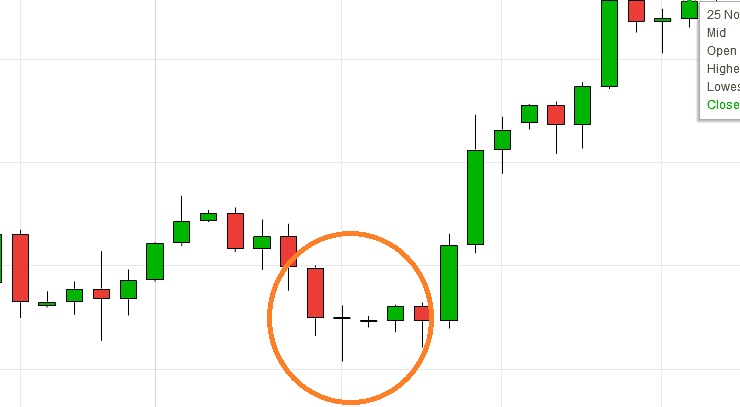
Morning Star Doji:
This is another three candlestick pattern . It is normally associated with a bullish reversal.
The first candle is a clear downtrend with a long body. The next day opens lower but trades in a very narrow price range.
The last day reverses prices higher and should close at or above the midpoint of the first.
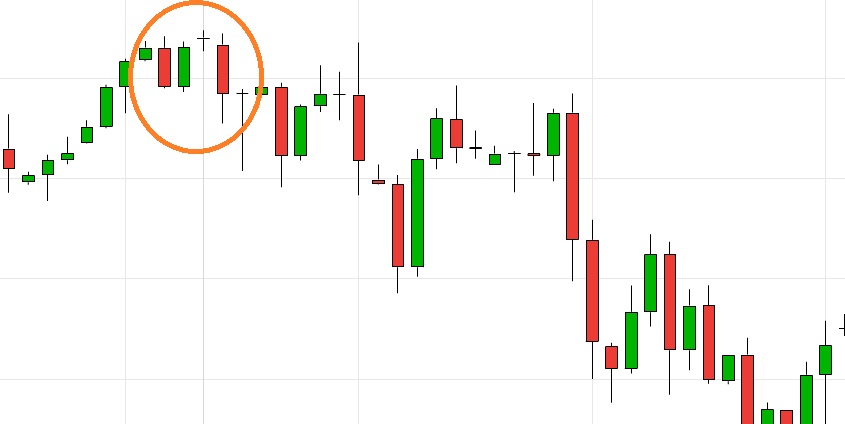 Evening Star Doji:
This candlestick pattern is the opposite of the morning star.
Again, a three day pattern and is associated with a bearish reversal.
The first candle is an uptrend with a long body. The next day opens higher but trades in a very narrow price range.
And the last day reverses lower and should close at or below the midpoint of the first candle.
Gravestone Doji:
Also known as the reverse dragonfly, simply because it is flipped over!
The candlestick pattern shadow can be any length but the open and close are at or near the low of the day.
It can be a bearish reversal pattern, but is more often found within the downtrend, signalling that the downtrend is set to continue.
Short body candles.
Long Shadow candles:
Long shadows are on of the more reliable candlestick patterns.
Candles with a long top shadow and short lower shadow show us that buyers dominate the market, these can lead to or continue a bull run in prices.
On the other end.
Candles with a long lower shadow and short upper shadow show us that sellers dominate the market and these candles can lead to or continue a bear run in prices.
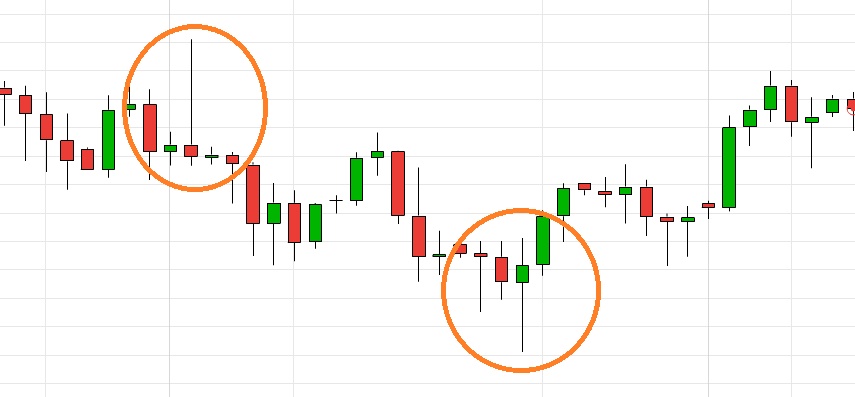
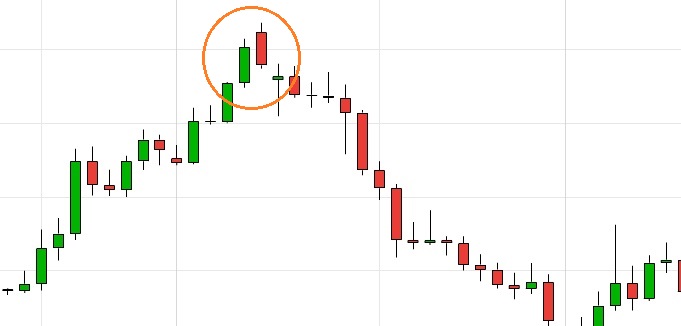
Evening Star:
Similar to the doji version, except the middle candle has a short body. It is a three day pattern and is associated with a bearish reversal.
The first candle is an uptrend with a long body. The next day opens higher but trades with a short real body.
And the last day reverses lower and should close at or below the midpoint of the first candle.
.
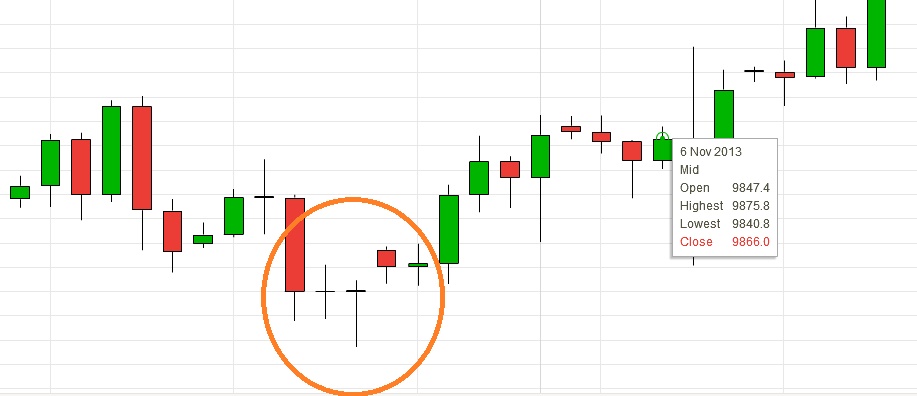
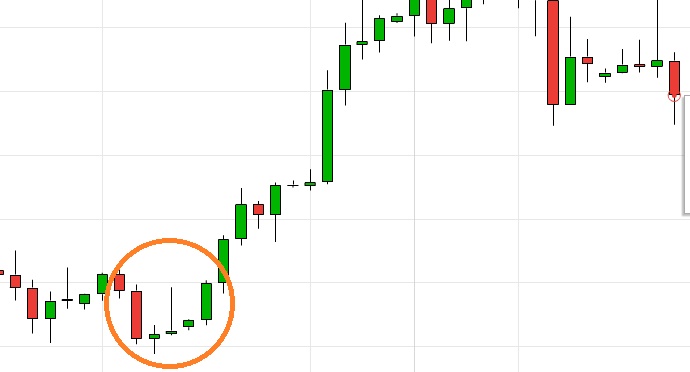
Morning Star:
Again, this pattern is similar to the doji version except the middle candle has a short body.
A three day pattern and is associated with a bullish reversal.
The first candle is an downtrend with a long body. The next day opens lower but trades with a short real body. And the last day reverses higher and should close at or above the midpoint of the first candle.
 Hammer:
This candle is one of those dual meaning candlestick patterns. It can be a bullish reversal pattern, happening near the low of a trend. But it can also occur during the downtrend.
The hammer candle forms when a the price moves lower after the open, and then rallies to close significantly higher than the low. The candlestick ends up looking like a like a square hammer with a long handle.
The hammer candle happens at the start or during a decline.
Inverted hammer:
This is a bullish reversal pattern.
The inverted hammer candle forms when a the price moves higher after the open, it then declines to close significantly lower than the low.
Again, these candlestick patterns end up looking like a like a hammer with a long handle. The hammer candle happens at the end of a decline.
 Hanging Man:
This candle is an indication of a market ready to rally! Showing a bullish impulse.
It forms when the price drops after opening to form a long shadow, then price rallies to close at the highs of the candle.The real body of the candle forms the head, and the long shadow forms the guy’s ‘hanging legs’!
Spinning Top:
Nobody knows how a spinning top will fall once it stops spinning!
And as such the spinning top candle indicates indecision in the market. After the candle closes the market will tend to move away from the spinning top quite rapidly. So it is part of the trend following group of candlestick patterns.
The candle forms with a short real body and an equal upper and lower shadow.
Shooting Star:
This is one of the particularly reliable bearish candlestick patterns. It is signalling that a top is in place and a trader should close any long positions or get ready to short the market.
The market gaps higher on opening, and then rallies to a high. Prices will then decline to close only slightly above the open.
The form of the candle looks as if a star is shooting down towards the ground.
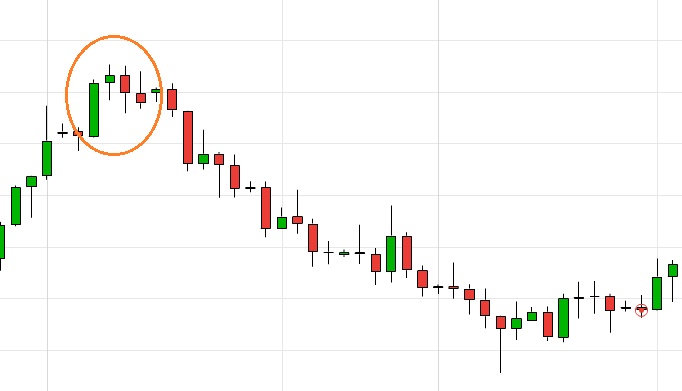
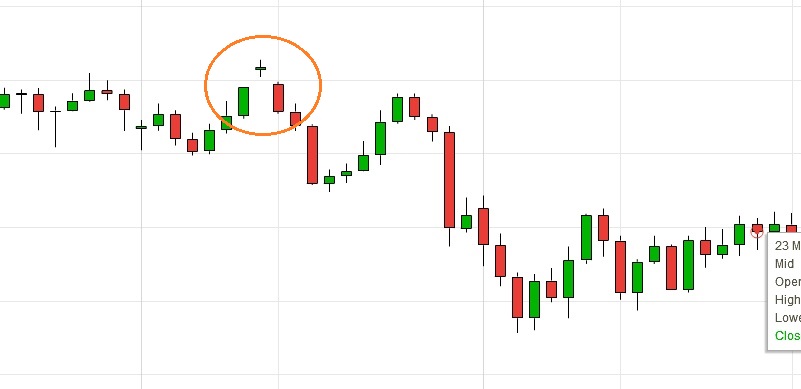
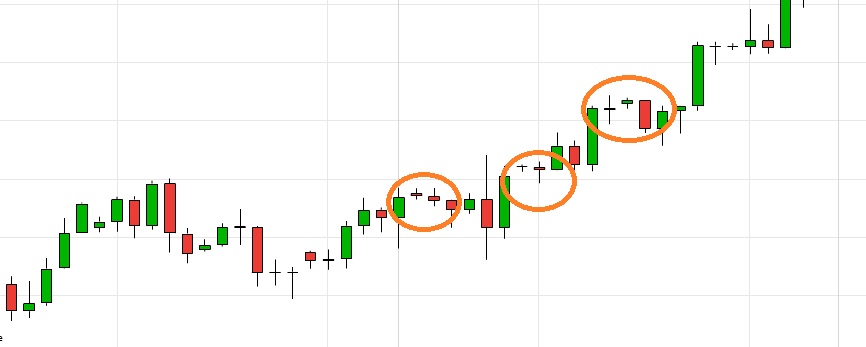
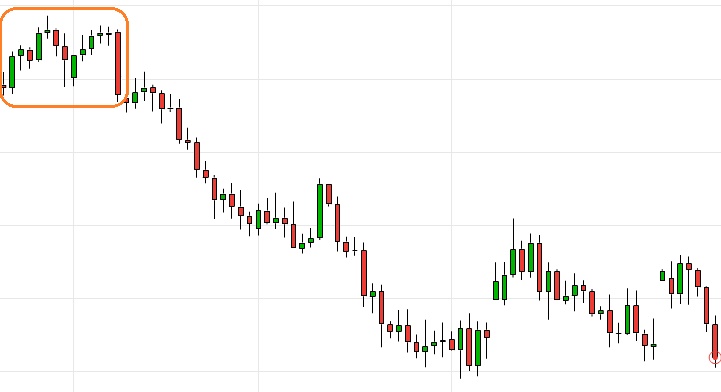
Upside Gap with Two Crows:
This is a bearish pattern that happens over 3 daily candles.
The first candle is a long green candle, the second candle happens with an upward gap open with a small real body.
The final candle is a long red candle which engulfs the second candle, but the close of the day remains above the open of the first day.
This one is technically part of the family of bearish candlestick patterns, but, it usually indicates a corrective reversal within an uptrend, therefore it is hard to trade but can be used more as an indication the the trend is set to continue.
Long body candlestick patterns
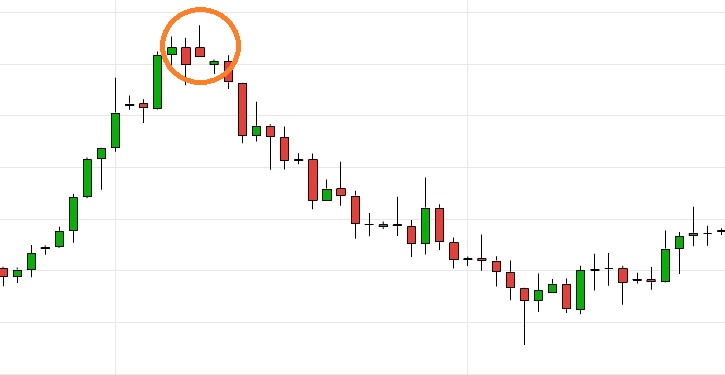
Dark Cloud Cover:
Dark cloud cover candlestick patterns indicate an incoming bearish reversal.
A two candle pattern, the first candle is a long green bullish candle.
The next candle opens higher but reverses and declines, the candle then closes below the center of the first candle.

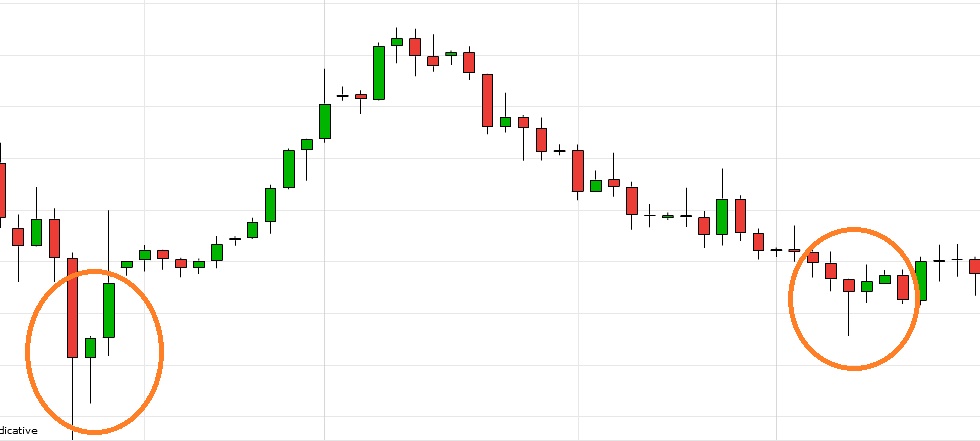
Engulfing Patterns:
This is on of the strong reversal candlestick patterns.
There is both a bearish and bullish engulfing pattern.
The bearish engulfing candle happens at the end of an uptrend, and the bullish at the end of the downtrend.
The first candle has a small real body, the reversal candle is long, ideally with short shadows, the real body of the second candle fully engulfs the first candle.
The strength of the reversal can be gauged based on how many of the previous candles that the engulfing candle swallows up!
The more ‘swallowed candles’, the more powerful the following reversal move will tend to be.
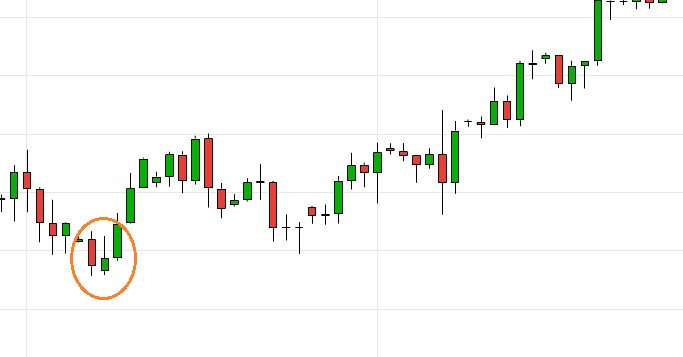
Piercing Line:
This is another of the two candle bullish reversal candlestick patterns.
The first candle is long and red bringing the market lower.
The next candle opens at new lows but rallies to close at a point which ‘pierces through the centreline of the previous candle.
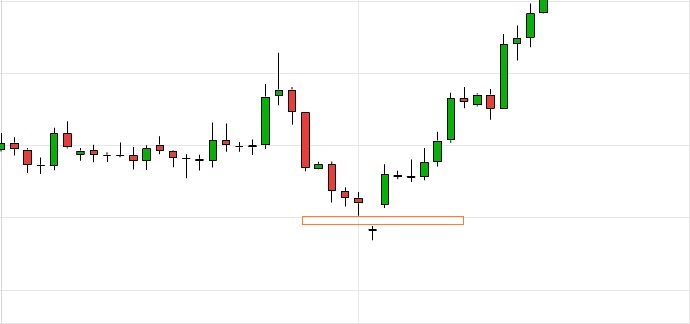
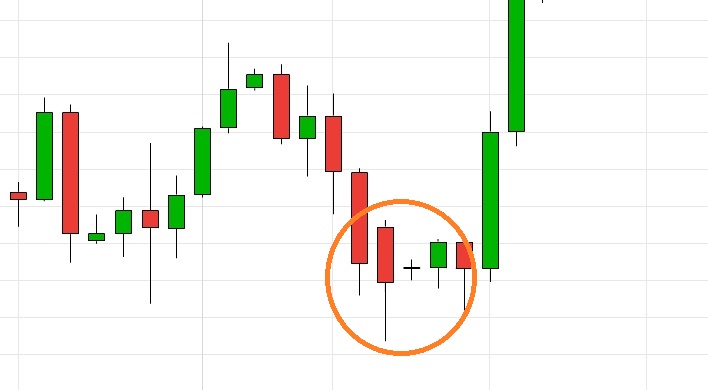
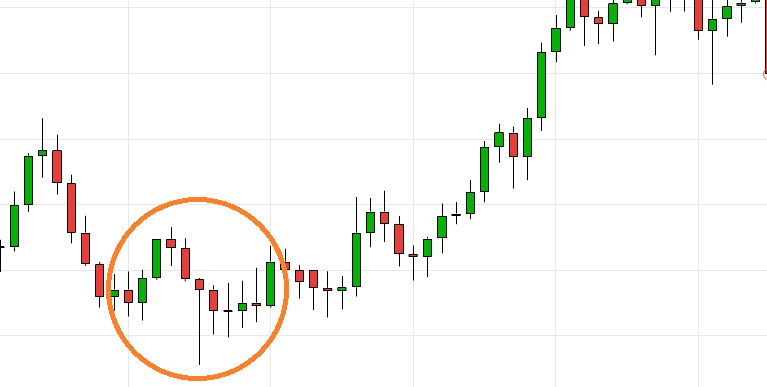
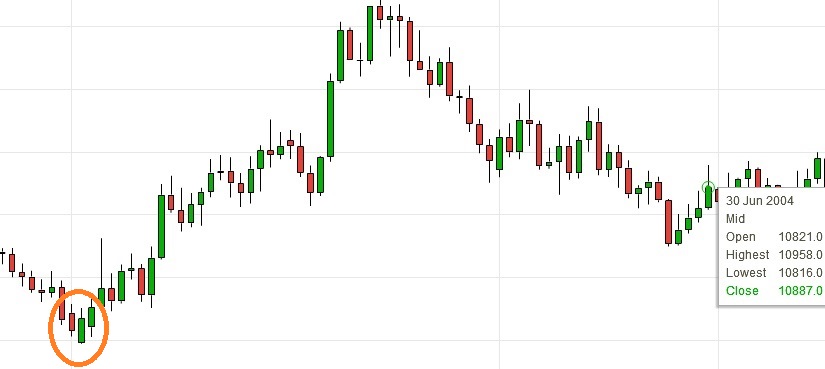
Candlestick Sandwich:
The candlestick sandwich is also a bullish reversal pattern over three days action.
The pattern forms with two red candles surrounding one green candle in the middle, creating a sandwich!
The closing prices of both red candles must be very close, this action creates a support base to trade off.

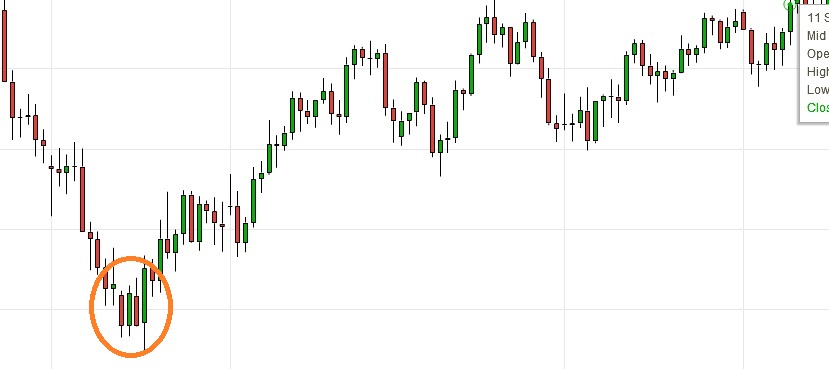
Three green Soldiers:
This candlestick pattern creates a stairway for higher prices. It is a bullish reversal pattern formed with three candles.
The three candles are green, each consecutive candle opens within the real body of the previous candle.
The close of each day brings the market to new highs, signalling an uptrend is about to take off.
Look, you reached the end!
Like I said at the start, use this article as a ‘go to guide’ when you see some candlestick pattern price action that could be forming a reversal in the market you trade!
This guide should be a help in spotting those candle patterns as they form and, and then you can trade on what the pattern suggests will happen next.