
[vc_row][vc_column][vc_column_text]
Over the last few months I have been publishing daily about this expected rally in GOLD prices.
I have LONG suggested that this current phase of the rise in GOLD, will bring the market up to the region of 1550 in a possible wave C rally.
That target remains intact,
BUT;
1550 may well prove to be on the low end,
Given the alternate wave count I am working with.
which calls for a new all time high in GOLD which could dwarf the 2011 high!
Over the last few months the current wave count has been spot on in calling each turning point as it happens in real time.
These examples illustrate how useful Elliott wave analysis is at pinpointing a market reversals.
Here are a few examples this summer alone!
[/vc_column_text][/vc_column][/vc_row][vc_row][vc_column][vc_separator][/vc_column][/vc_row][vc_row][vc_column][vc_column_text]
07-07-17 GOLD DOUBLE BOTTOM, SERIOUSLY BULLISH SETUP.
[/vc_column_text][/vc_column][/vc_row][vc_row][vc_column][vc_separator][/vc_column][/vc_row][vc_row][vc_column width=”1/2″][vc_custom_heading text=”30 min” use_theme_fonts=”yes”][vc_column_text] [/vc_column_text][/vc_column][vc_column width=”1/2″][vc_custom_heading text=”4 Hours” use_theme_fonts=”yes”][vc_column_text]
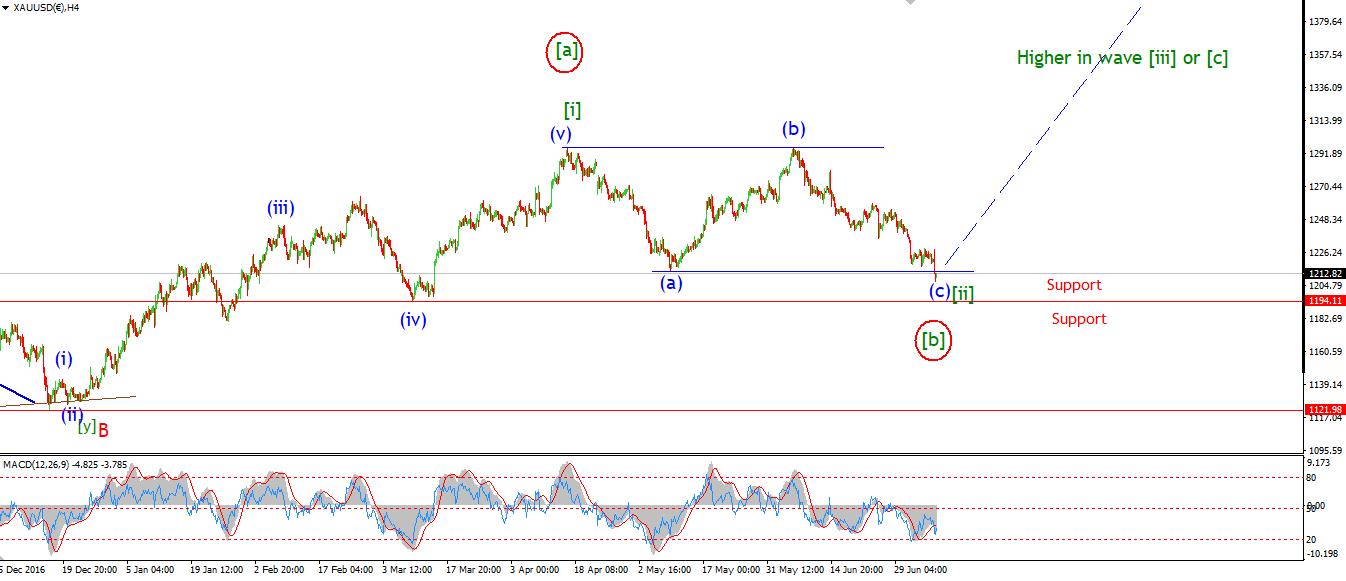 [/vc_column_text][/vc_column][/vc_row][vc_row][vc_column][vc_column_text]On the 7th of July I published the above charts, which called an end to the declines, and a major double bottom to form.
We got the drop that was called for in last nights chart.
GOLD punched thorough 1214 with force this afternoon.
I think at this stage we call this large correction in wave [ii] green, complete.
It has taken a while,
And it has worn out the bulls to a point of capitulation!
I like these market setups,
The sellers have all sold,
And the buyers have all given up!
The way is now clear for another bull run higher in wave [iii] green.
The GOLD price reached a low at 1204 only three days later,
and since that point has rallied to above 1330 at yesterdays highs!
[/vc_column_text][/vc_column][/vc_row][vc_row][vc_column][vc_separator][/vc_column][/vc_row][vc_row][vc_column][vc_column_text]
08-08-17 – GOLD wave count update.
[/vc_column_text][/vc_column][/vc_row][vc_row][vc_column][vc_separator][/vc_column][/vc_row][vc_row][vc_column width=”1/2″][vc_custom_heading text=”30 min” use_theme_fonts=”yes”][vc_column_text]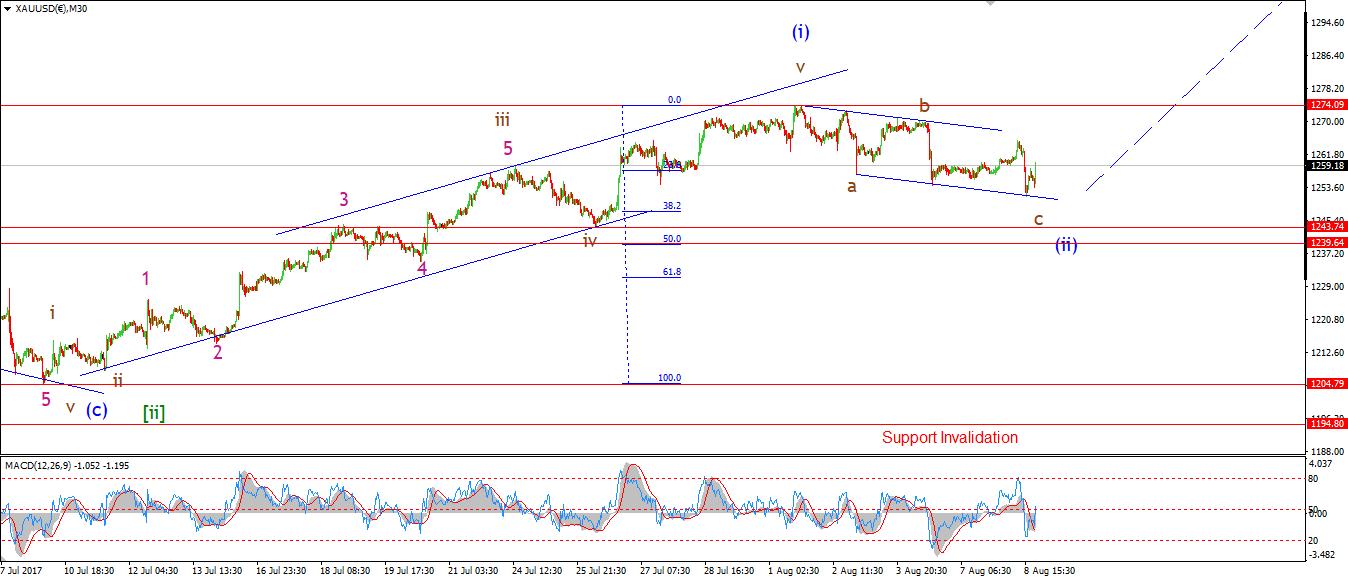 [/vc_column_text][/vc_column][vc_column width=”1/2″][vc_custom_heading text=”4 Hours” use_theme_fonts=”yes”][vc_column_text]
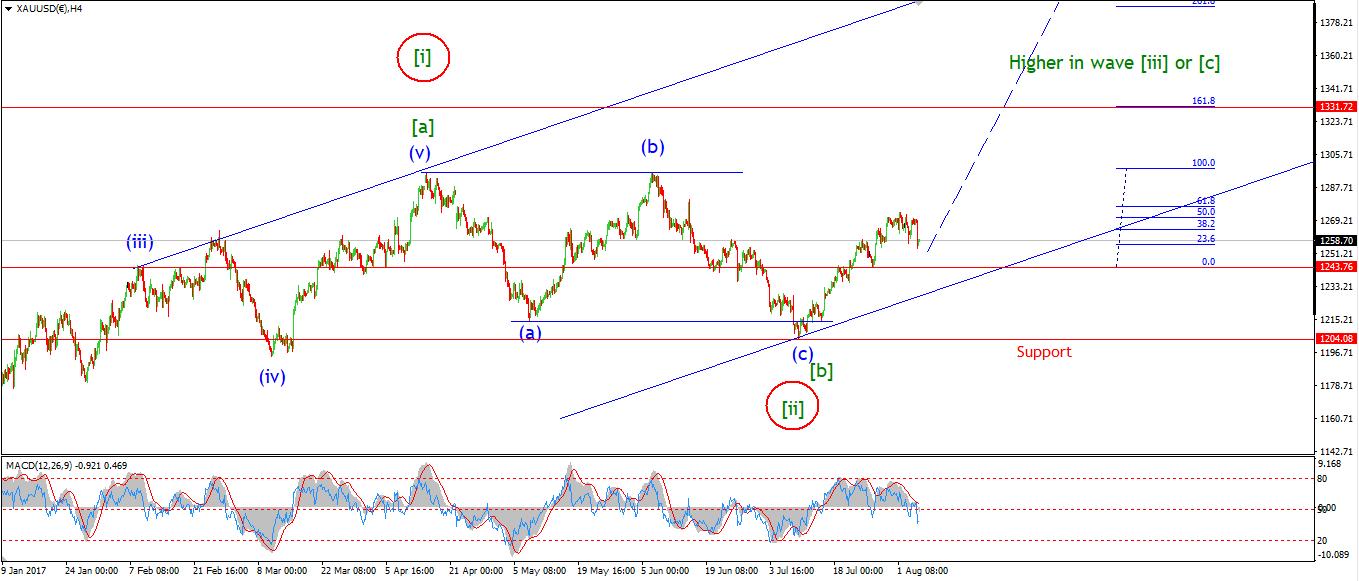 [/vc_column_text][/vc_column][/vc_row][vc_row][vc_column][vc_column_text]On the 8th of August I updated the wave count to an even more bullish interpretation.
The price had declined off the recent high in a corrective form, and looked again like it was about to set a significant low.
Heres what I thought that night;
The price action is now viewed as a rise off the low in wave (i) blue,
And the recent decline is now labelled wave (ii) blue.
This decline is approaching completion as the lower trendline has been reached again.
Wave (ii) blue could be a complex double combination wave, which has a 3,3,3 internal structure.
Initial support lies at 1243, the previous fourth wave.
For tomorrow;
I am actively on the lookout for a rally to begin in wave (iii) blue.
This one should be significant,
A break of 1274 will indicate wave (iii) has begun.
The price bottomed that day, at 1251.
We all know what happened from that point on, as todays price shows!
From these examples it is easy to see why an Elliott wave perspective is invaluable as you plan your investment and trading strategy.
The future for GOLD is looking very exciting indeed according to the current Elliott wave setup!
Get the inside line on the future for the GOLD price,
Check out the membership levels available for BULLWAVES.ORG
[/vc_column_text][/vc_column][/vc_row][vc_row][vc_column][vc_separator][/vc_column][/vc_row]